Cider Market Size and Share Forecast Outlook 2025 to 2035

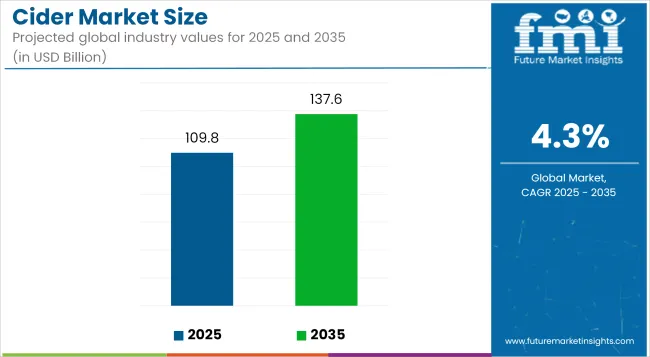
The global cider market is projected to grow from USD 109.8 billion in 2025 to USD 137.6 billion by 2035, expanding at a CAGR of 4.3% during the forecast period. Flavored cider will dominate the product segment with a 64% market share in 2025, while glass bottles will lead the packaging segment with a 48% share. Hypermarkets/supermarkets are expected to remain the key distribution channel, with online retail gaining momentum due to rising direct-to-consumer trends.
Quick Stats of Cider Market

  • Market Value (2025): USD 109.8 billion
  • Forecast Value (2035): USD 137.6 billion
  • Forecast CAGR: 4.3%
  • Top Segment by Product (2025): Flavored Cider (64% share)
  • Top Segment by Packaging (2025): Glass Bottles (48% share)

Cider Market Size Industry Value Analysis

The growth of the cider market is being supported by the rising demand for low-alcohol and fruit-based alcoholic beverages, especially among millennials and Gen Z consumers. As health awareness increases, cider is gaining favor over beer and spirits due to its lighter profile and diverse flavor offerings. Additionally, innovations in functional ciders with adaptogens and probiotics are expanding the consumer base beyond casual drinkers.

Flavored ciders continue to draw new consumers by offering berry, citrus, and exotic fruit blends that align with seasonal preferences. Craft and premium ciders are also reshaping regional markets by highlighting local apple varieties and artisanal fermentation techniques. Moreover, the growing popularity of gluten-free options is encouraging consumers with dietary restrictions to shift from traditional beer to cider.

Canned packaging is gaining traction, especially among younger consumers, due to portability and environmental considerations. However, glass bottles remain the preferred choice for premium and on-premise sales. The market is further influenced by regional preferences, with flavored ciders dominating in the United States and Australia, while unflavored heritage variants maintain stronghold in France and the UK.

Digital commerce and influencer-driven branding strategies are enabling smaller cider brands to build loyal followings and enter emerging markets with minimal capital investment. Meanwhile, major global players are focusing on sustainability, brand storytelling, and strategic tie-ups with regional breweries to expand their global footprint.

Semi-Annual Demand Space Update

The below table gives an overview of the change in CAGR over six months of the base year (2024) and current year (2025) for the industry. This analysis uncovers the critical fluctuations of performance and shows the pattern of revenue realization - giving stakeholders a clearer sight on the annual growth trajectory. H1 is short for the first six months of the year, from January to June. H2, the latter half of the year, the months of July through December.

Particular Value CAGR
H1 (2024 to 2034) 4.1%
H2 (2024 to 2034) 4.2%
H1 (2025 to 2035) 4.3%
H2 (2025 to 2035) 4.5%

The above table depicts the anticipated CAGR across the industry demand space. The industry is estimated to grow at 4.1% in H1, 2024 and is projected to touch 4.2% in H2, 2024. Progressing into 2025, CAGR rises even more up to 4.3% in the first half before proceeding to reach 4.5% during the second half. This is the first half (H1 2025) the industry gained 10 BPS, and in the second half (H2 2025) the industry gained 20 BPS, indicating increasing momentum of consumption worldwide.

Analyzing Cider Market by Top Investment Segments

By Product Type

Segment Value Share (2025)
Flavored 64%

This industry can be bifurcated into product types, with flavored options expected to have a major share of around 64% industry share in 2025, while unflavored options will have a 36% industry share. The flavored segment is gaining popularity due to its taste profiles, largely attracting younger drinkers and casual alcohol consumers.

The interest in fruits-most options like berry, mango, pear, and citrus has increased much with innovation by brands such as Angry Orchard (Boston Beer Company), Kopparberg, Strongbow (Heineken), and Rekorderlig.

Alongside the arousing need for high discovery by these brands, different new exotic flavors are being introduced to change consumer preferences. Increasing demand for low-in alcohol and gluten-free beverages has also supported the growth of flavored cider as many brands take the health-conscious route to present themselves as alternatives to beer.

However, the unflavored segment retains a significant 36% industry share, primarily based on its traditional appeal and strong heritage in regions like the UK, Ireland, and France. Such brands as Westons, Thatchers, and Aspall continue to dominate this sector, catering to the classic consumer of apple-based options with minimal add-ons.

The steady demand for pure, high-quality, unflavored options sourced from autumn apple harvesting is partly attributed to the craft cider movement among purists and connoisseurs as well. Changing consumer preferences suggests continued growth for flavored cider, while unflavored options enjoys its dear base of traditional cider-consuming customers.

By Packaging Type

Segment Value Share (2025)
Glass bottles 48%

The industry is segmented by packaging type, with glass bottles expected to dominate, holding a 48% industry share in 2025, while aluminum cans will account for 30%. The culture of packaging for premium and craft preferred glass bottles due to their best quality, tradition, and sustainability.

Many of the historical brands like Thatchers, Aspall, and Westons are still bottling in glass because it gives authenticity and premium feel to the products. Glass bottles are the most used containers for pubs, restaurants, and specialty liquor stores where considerations of presentation and brand perception play a major role in the buying decision.

Apart from that, glass is recyclable many times over, which goes a long way to meet the growing requirement for eco-friendly packaging by consumers. Meanwhile, aluminum cans have been on the rise, making up 30% of the industry by 2025. The drivers of this trend-partitioned portable and convenient, not doubting sustainability themselves, led to increasing volumes of canned options.

Global brands like Strongbow from Heineken, Angry Orchard belonging to Boston Beer Company, and Kopparberg quickly followed suit to ensure that their range complements the ready-to-drink concept, bringing out more options geared toward the younger consumers seeking on-the-go beverage alternatives.

Lightweight and easily transportable cans, too, make the carbon footprint smaller than glass altogether. Canned options have gained further traction as ready-to-drink (RTD) alcoholic beverages, as outside consumption occasions such as festivals and picnics become more ubiquitous.

Key Trends and Purchasing Criteria Across Cider Consumer Segments

The industry is increasing steadily due to the increasing consumer demand for fruit alcoholic beverages and brewing innovation. Producers focus on high product quality, utilizing diverse types of fruits and natural fermentation methods to create strong flavor profiles. Compliance with regulation is still important, ensuring adherence to alcohol levels and labeling regulations.

Retailers, for example, supermarkets, off-licenses, and online, cater to differences in consumer preferences by carrying a selection of mainstream, craft, and premium brands. The growing demand for organic, gluten-free, and low-strength options has led retailers to carry more products to attract health-conscious and experimental consumers.

End consumers value variety in taste, cost, and brand image. Customers are increasingly trying new flavors from classic apple to international flavors such as pear, berry, and spiced options. As the industry trends toward healthier drinking, lower-sugar options and creative fermentation methods remain key drivers for industry growth, providing a dynamic and changing marketplace.

Risk Assessment

The industry is prone to several risks such as changing consumer tastes, supply chain issues, regulatory limitations, price volatility, and others. Businesses need to actively manage these risks to support industry growth and brand strength.

Changing consumer trends are a major challenge, as demand for low-alcohol, craft, organic, and flavored options keeps changing. Failure to keep up with these trends can result in falling sales. To counter this, brands need to diversify product lines, invest in industry research, and adopt new flavors or health-oriented formulations.

Supply chain disruptions may impact raw material access, including apples and other fruits utilized in making cider. Harsh climate, plant illness, and global logistics breakdowns can lead to unstable prices and delays in production. To mitigate this, cider producers must source ingredients from varied regions, establish long-term relationships with suppliers, and locate substitute fruit varieties.

Concerns about sustainability are also on the rise, and customers are driving environmentally focused sourcing, reusable packaging, and carbon-free manufacturing. Not adhering to these parameters can mean damage to reputation. Investing capital into sustainable cultivation techniques, renewable-packaging materials, and energy-reduction manufacturing will be crucial to long-term survivability in business.

To thrive, brands must be vigilant about innovation, supply chain resilience, compliance with regulations, pricing strategies, and sustainability efforts as they adapt to evolving consumer trends and industry conditions.
Country-wise Analysis

Cider Market Size Cagr Analysis By Country

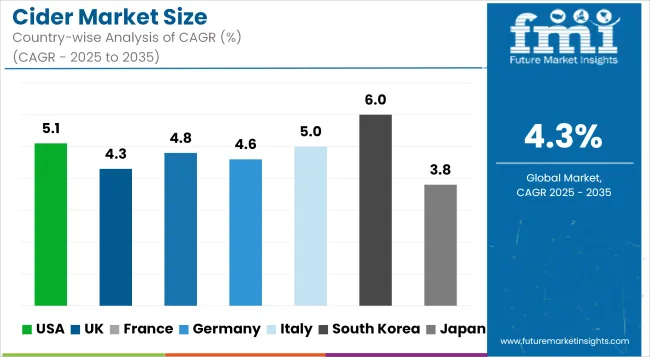
Countries CAGR (2025 to 2035)
USA 5.1%
UK 4.3%
France 4.8%
Germany 4.6%
Italy 5%
South Korea 6%
Japan 3.8%
China 7.2%
Australia 5.4%
New Zealand 5.6%

USA

The USA industry will grow steadily between 2025 and 2035 at a CAGR of 5.1%. Low-alcohol, flavor appeal is particularly favored among younger generations of consumers like millennials and Gen Z, who want lighter and sweeter variations of alcoholic beverages and spirits.

While craft cideries drive native apple varieties and handmade production styles, the USA industry sees growing interest in gluten-free products and alternative flavors. Cider is picking up steam in off- and on-premise retail channels. Moreover, extensive availability at supermarkets and bars and strong promotional efforts by leading players are expected to further fuel growth.

UK

In the UK, the industry is expected to grow at a steady rate of 4.3% CAGR during the forecast period. The nation has a long history production, and the industry is strong with growing demand for premium and craft options. Regional taste profiles and old-fashioned manufacturing processes are becoming fashion brands, particularly among urban consumers who look for new taste sensations.

The move towards lower-alcohol drinks and the health trend is driving cider's popularity, especially among women. As there is an increase in the craft industry, the UKindustry will be subject to steady but sustained increases in domestic and export consumption.

France

The French industry will witness modest growth at a CAGR of 4.8%. France, which houses some of the world's most famous cider-making regions, such as Normandy and Brittany, boasts a rich cultural heritage with cider. Ciders produced using specific regional apple varieties and old production methods remain in demand.

In the coming years, the French industry will be fueled by the increasing trend of consumers looking for premium, locally produced drinks. France's youth, attracted by the range in casual and gourmet establishments, is also driving the increasing demand for options throughout supermarkets, restaurants, and bars.

Germany

Germany, with a traditional beer culture, is developing a drift toward cider at an estimated CAGR of 4.6%. While alcoholic preference remains among beer, it is finding a space for itself, particularly with fitness-conscious consumers looking for low-alcoholic options.

With a rise in the demand for premium and craft options, specifically those processed using locally available apple harvests, industry growth will be induced. German customers are increasingly turning towards small-batch, naturally fermented options as part of the global trend of artisan and sustainable drinks. Higher demand, combined with creative packaging and branding, will further drive growth.

Italy

Italy will experience a high growth rate in theindustry, with a CAGR of 5%. Italy, being a wine country, is gradually turning into anindustry, especially in the urban areas where the consumer is looking for more varied alcoholic products.

Increasing popularity with fresh fruit flavor and weak alcohol strength to appeal to the new generation exists. In addition, the transition towards craft options and gluten-free drinks are additional drivers. The Italian industry will experience growth over the next decade as the product is consolidated in its variegated alcoholic beverages industry.

South Korea

South Korea's industry will expand at a high CAGR of 6.0%. As a more recent industry, South Korea is spurred by expansion within a growing, increasingly health-oriented population, rising disposable incomes, and the popularity of the Western style of drinking.

Young urban professionals, particularly in metropolitan cities like Seoul, are taking up as a hip substitute for beer and soju, which are traditional liquor drinks. Demand for local and foreign options, especially for distinctive flavors, will be on the rise. Social media and influencer campaigns have also been instrumental in popularizing among the youth population.

Japan

The Japanese industry is anticipated to see moderate growth at a CAGR of 3.8%. While the country boasts a good history of alcoholic drinks, it is a niche within the bigger drinks industry. Demand is especially robust from the youth, who are looking for a substitute for beer and sake.

The growing popularity of reduced alcohol strength beverages, combined with fruit-flavored drinks, should help fuel the industry's ongoing growth. However, historical Japanese alcoholic drinks' industry dominance does mean that it is still going to struggle to gain mass-market penetration, even with increasing interest in consumption.

China

The Chinese industryis expanding explosively at a 7.2% CAGR by calculation. The national middle-class growth of urban young consumers, and specifically that of national urban young consumers, is pushing the importation of higher-quality beverages. Cider presents itself as a fashionable, healthier choice for beer and spirits, and therefore, it is rising in popularity in bars, cafes, and supermarkets.

While local manufacturing is still at an early stage, collaboration with overseas manufacturers is growing in volume. Social marketing and influencer marketing are similarly playing a central role in upping the presence for Chinese consumers high on tech allegiance. With the sharp expansion in the numbers of youth and mounting disposable income, the Chinese industry will maintain its expansion course in the next two years or so.

Australia

The Australian industry is forecasted to record a 5.4% CAGR growth during the period 2025 to 2035. Consumption has grown remarkably, with especially health-aware consumers looking for beverages other than beer and spirits. Consumers in Australia are increasingly becoming attracted to options utilizing locally grown apples and natural products.

With premium and craft options gaining popularity, the industry is set to grow, with additional local players emerging to provide products to cater to increasing demand. The trend towards lower-strength drinks, coupled with the fact that it is gluten-free, is set to continue driving industry growth during the forecast period.

New Zealand

The New Zealand industry is set to witness steady growth at a rate of 5.6% CAGR. New Zealand has a rich culture, and indigenous cider producers offer high-quality options made from its rich apple orchards. The increasing popularity of light, fruity alcoholic drinks among urban customers is driving demand.

Craft options, normally made after embracing sustainable practices, are increasingly popular among New Zealanders. Besides that, increasing growth in health-drinking culture and demand for gluten-free beverages are further fueling the demand. With more foreign brands further building their reach across New Zealand, the business is on upward growth.
Cider Market Suppliers, Brands, and Distributors

Cider Market Size Analysis By Company

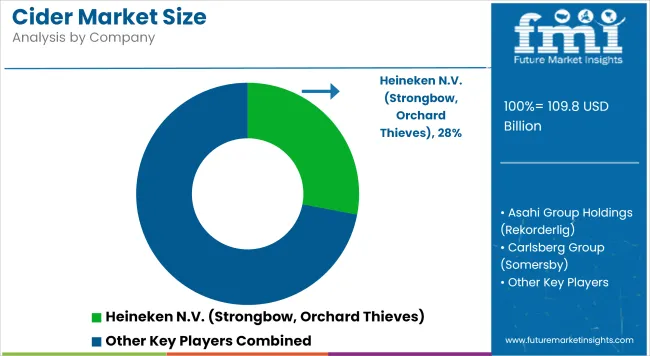
The global cider market is moderately consolidated, with key multinational players competing alongside emerging craft and regional producers. Industry leaders are leveraging flavor innovation, and premium positioning to strengthen brand appeal across diverse demographics. Flavored cider lines featuring exotic fruits, botanicals, and functional ingredients are being rapidly introduced to align with evolving consumer health trends.

Companies like Heineken N.V., Anheuser-Busch InBev, and C&C Group plc dominate global distribution through flagship brands such as Strongbow, Stella Artois Cidre, and Magners. These players are focused on expanding into high-growth regions like Asia Pacific and Latin America through acquisitions and localized product variants.

Sustainability is a growing competitive differentiator. Players are investing in recyclable packaging, regenerative apple farming, and carbon-neutral production facilities to build long-term consumer trust. Social media campaigns and influencer partnerships are increasingly being used to target millennial and Gen Z consumers, especially for premium and ready-to-drink (RTD) offerings.

Private-label and regional brands are gaining traction in developed markets by offering artisanal quality at competitive prices. Collaborations with local orchards and breweries are also helping smaller players expand their presence in retail chains and specialty outlets.

The market is expected to remain dynamic, driven by changing flavor preferences, regional innovations, and the emergence of hybrid and alcohol-free cider segments.

Latest Cider Industry News

  • Molson Coors: In January 2025, Molson Coors announced a strategic partnership with Fever-Tree in the USA to enhance its portfolio of flavored beverages, including ciders. This move is designed to capitalize on the growing demand for innovative and premium cider offerings.
  • Carlsberg Group: In November 2024, Carlsberg joined the REfresh Alliance, a coalition of ten global beverage companies committed to accelerating renewable energy adoption across the beverage industry’s supply chain. This initiative supports Carlsberg’s sustainability goals and strengthens its position in the cider and broader beverage market.

Key Market Players

  • Heineken N.V.
  • Anheuser-Busch InBev
  • C&C Group plc
  • Carlsberg Group
  • Aston Manor Cider
  • Kopparberg
  • Rekorderlig
  • Thatchers
  • Aspall
  • Woodchuck Hard Cider

Cider Market Segmentation

By Product Type:

The industry is segmented into flavored and unflavored.

By Packaging Type:

The industry is segment into glass bottles, plastic bottles, and aluminum cans.

By Distribution Channel:

The industry is categorized into hypermarkets/supermarkets, specialty stores, and online retail.

By Region:

The industry is analyzed across North America, Latin America, Europe, Asia Pacific, and MEA (Middle East & Africa), identifying regional demand patterns and growth opportunities.

Table of Content

  1. Executive Summary
  2. Market Overview
  3. Market Background
  4. Global Market Analysis 2020 to 2024 and Forecast, 2025 to 2035
  5. Global Market Analysis 2020 to 2024 and Forecast 2025 to 2035, By Product Type
    • Flavoured Cider
    • Unflavoured Cider
  6. Global Market Analysis 2020 to 2024 and Forecast 2025 to 2035, By Packaging Type
    • Glass Bottles
    • Plastic Bottles
    • Aluminium Cans
  7. Global Market Analysis 2020 to 2024 and Forecast 2025 to 2035, By Distribution Channel
    • Hypermarkets/Supermarkets
    • Specialty Stores
    • Online Retail
  8. Global Market Analysis 2020 to 2024 and Forecast 2025 to 2035, By Region
    • North America
    • Latin America
    • Europe
    • Asia Pacific
    • MEA
  9. North America Market Analysis 2020 to 2024 and Forecast 2025 to 2035, By Country
  10. Latin America Market Analysis 2020 to 2024 and Forecast 2025 to 2035, By Country
  11. Europe Market Analysis 2020 to 2024 and Forecast 2025 to 2035, By Country
  12. Asia Pacific Market Analysis 2020 to 2024 and Forecast 2025 to 2035, By Country
  13. MEA Market Analysis 2020 to 2024 and Forecast 2025 to 2035, By Country
  14. Key Countries Market Analysis
  15. Market Structure Analysis
  16. Competition Analysis
    • Heineken N.V.
    • C&C Group plc
    • Asahi Premium, Ltd
    • Seattle Company
    • Vander Mill Ciders
    • The Boston Beer Company
    • Carlton & United Breweries
    • Distell Group
    • Aston Manor
    • Woodchuck Cidery
    • Molson Coors Brewing Company
    • Carlsberg Breweries A/S
  17. Assumptions & Acronyms Used
  18. Research Methodology

List of Tables

  • Table 1: Global Market Value (USD Million) Forecast by Region, 2020 to 2035
  • Table 2: Global Market Volume (Litres) Forecast by Region, 2020 to 2035
  • Table 3: Global Market Value (USD Million) Forecast by Product Type, 2020 to 2035
  • Table 4: Global Market Volume (Litres) Forecast by Product Type, 2020 to 2035
  • Table 5: Global Market Value (USD Million) Forecast by Packaging Type, 2020 to 2035
  • Table 6: Global Market Volume (Litres) Forecast by Packaging Type, 2020 to 2035
  • Table 7: Global Market Value (USD Million) Forecast by Distribution Channel, 2020 to 2035
  • Table 8: Global Market Volume (Litres) Forecast by Distribution Channel, 2020 to 2035
  • Table 9: North America Market Value (USD Million) Forecast by Country, 2020 to 2035
  • Table 10: North America Market Volume (Litres) Forecast by Country, 2020 to 2035
  • Table 11: North America Market Value (USD Million) Forecast by Product Type, 2020 to 2035
  • Table 12: North America Market Volume (Litres) Forecast by Product Type, 2020 to 2035
  • Table 13: North America Market Value (USD Million) Forecast by Packaging Type, 2020 to 2035
  • Table 14: North America Market Volume (Litres) Forecast by Packaging Type, 2020 to 2035
  • Table 15: North America Market Value (USD Million) Forecast by Distribution Channel, 2020 to 2035
  • Table 16: North America Market Volume (Litres) Forecast by Distribution Channel, 2020 to 2035
  • Table 17: Latin America Market Value (USD Million) Forecast by Country, 2020 to 2035
  • Table 18: Latin America Market Volume (Litres) Forecast by Country, 2020 to 2035
  • Table 19: Latin America Market Value (USD Million) Forecast by Product Type, 2020 to 2035
  • Table 20: Latin America Market Volume (Litres) Forecast by Product Type, 2020 to 2035
  • Table 21: Latin America Market Value (USD Million) Forecast by Packaging Type, 2020 to 2035
  • Table 22: Latin America Market Volume (Litres) Forecast by Packaging Type, 2020 to 2035
  • Table 23: Latin America Market Value (USD Million) Forecast by Distribution Channel, 2020 to 2035
  • Table 24: Latin America Market Volume (Litres) Forecast by Distribution Channel, 2020 to 2035
  • Table 25: Europe Market Value (USD Million) Forecast by Country, 2020 to 2035
  • Table 26: Europe Market Volume (Litres) Forecast by Country, 2020 to 2035
  • Table 27: Europe Market Value (USD Million) Forecast by Product Type, 2020 to 2035
  • Table 28: Europe Market Volume (Litres) Forecast by Product Type, 2020 to 2035
  • Table 29: Europe Market Value (USD Million) Forecast by Packaging Type, 2020 to 2035
  • Table 30: Europe Market Volume (Litres) Forecast by Packaging Type, 2020 to 2035
  • Table 31: Europe Market Value (USD Million) Forecast by Distribution Channel, 2020 to 2035
  • Table 32: Europe Market Volume (Litres) Forecast by Distribution Channel, 2020 to 2035
  • Table 33: Asia Pacific Market Value (USD Million) Forecast by Country, 2020 to 2035
  • Table 34: Asia Pacific Market Volume (Litres) Forecast by Country, 2020 to 2035
  • Table 35: Asia Pacific Market Value (USD Million) Forecast by Product Type, 2020 to 2035
  • Table 36: Asia Pacific Market Volume (Litres) Forecast by Product Type, 2020 to 2035
  • Table 37: Asia Pacific Market Value (USD Million) Forecast by Packaging Type, 2020 to 2035
  • Table 38: Asia Pacific Market Volume (Litres) Forecast by Packaging Type, 2020 to 2035
  • Table 39: Asia Pacific Market Value (USD Million) Forecast by Distribution Channel, 2020 to 2035
  • Table 40: Asia Pacific Market Volume (Litres) Forecast by Distribution Channel, 2020 to 2035
  • Table 41: MEA Market Value (USD Million) Forecast by Country, 2020 to 2035
  • Table 42: MEA Market Volume (Litres) Forecast by Country, 2020 to 2035
  • Table 43: MEA Market Value (USD Million) Forecast by Product Type, 2020 to 2035
  • Table 44: MEA Market Volume (Litres) Forecast by Product Type, 2020 to 2035
  • Table 45: MEA Market Value (USD Million) Forecast by Packaging Type, 2020 to 2035
  • Table 46: MEA Market Volume (Litres) Forecast by Packaging Type, 2020 to 2035
  • Table 47: MEA Market Value (USD Million) Forecast by Distribution Channel, 2020 to 2035
  • Table 48: MEA Market Volume (Litres) Forecast by Distribution Channel, 2020 to 2035

List of Figures

  • Figure 1: Global Market Value (USD Million) by Product Type, 2025 to 2035
  • Figure 2: Global Market Value (USD Million) by Packaging Type, 2025 to 2035
  • Figure 3: Global Market Value (USD Million) by Distribution Channel, 2025 to 2035
  • Figure 4: Global Market Value (USD Million) by Region, 2025 to 2035
  • Figure 5: Global Market Value (USD Million) Analysis by Region, 2020 to 2035
  • Figure 6: Global Market Volume (Litres) Analysis by Region, 2020 to 2035
  • Figure 7: Global Market Value Share (%) and BPS Analysis by Region, 2025 to 2035
  • Figure 8: Global Market Y-o-Y Growth (%) Projections by Region, 2025 to 2035
  • Figure 9: Global Market Value (USD Million) Analysis by Product Type, 2020 to 2035
  • Figure 10: Global Market Volume (Litres) Analysis by Product Type, 2020 to 2035
  • Figure 11: Global Market Value Share (%) and BPS Analysis by Product Type, 2025 to 2035
  • Figure 12: Global Market Y-o-Y Growth (%) Projections by Product Type, 2025 to 2035
  • Figure 13: Global Market Value (USD Million) Analysis by Packaging Type, 2020 to 2035
  • Figure 14: Global Market Volume (Litres) Analysis by Packaging Type, 2020 to 2035
  • Figure 15: Global Market Value Share (%) and BPS Analysis by Packaging Type, 2025 to 2035
  • Figure 16: Global Market Y-o-Y Growth (%) Projections by Packaging Type, 2025 to 2035
  • Figure 17: Global Market Value (USD Million) Analysis by Distribution Channel, 2020 to 2035
  • Figure 18: Global Market Volume (Litres) Analysis by Distribution Channel, 2020 to 2035
  • Figure 19: Global Market Value Share (%) and BPS Analysis by Distribution Channel, 2025 to 2035
  • Figure 20: Global Market Y-o-Y Growth (%) Projections by Distribution Channel, 2025 to 2035
  • Figure 21: Global Market Attractiveness by Product Type, 2025 to 2035
  • Figure 22: Global Market Attractiveness by Packaging Type, 2025 to 2035
  • Figure 23: Global Market Attractiveness by Distribution Channel, 2025 to 2035
  • Figure 24: Global Market Attractiveness by Region, 2025 to 2035
  • Figure 25: North America Market Value (USD Million) by Product Type, 2025 to 2035
  • Figure 26: North America Market Value (USD Million) by Packaging Type, 2025 to 2035
  • Figure 27: North America Market Value (USD Million) by Distribution Channel, 2025 to 2035
  • Figure 28: North America Market Value (USD Million) by Country, 2025 to 2035
  • Figure 29: North America Market Value (USD Million) Analysis by Country, 2020 to 2035
  • Figure 30: North America Market Volume (Litres) Analysis by Country, 2020 to 2035
  • Figure 31: North America Market Value Share (%) and BPS Analysis by Country, 2025 to 2035
  • Figure 32: North America Market Y-o-Y Growth (%) Projections by Country, 2025 to 2035
  • Figure 33: North America Market Value (USD Million) Analysis by Product Type, 2020 to 2035
  • Figure 34: North America Market Volume (Litres) Analysis by Product Type, 2020 to 2035
  • Figure 35: North America Market Value Share (%) and BPS Analysis by Product Type, 2025 to 2035
  • Figure 36: North America Market Y-o-Y Growth (%) Projections by Product Type, 2025 to 2035
  • Figure 37: North America Market Value (USD Million) Analysis by Packaging Type, 2020 to 2035
  • Figure 38: North America Market Volume (Litres) Analysis by Packaging Type, 2020 to 2035
  • Figure 39: North America Market Value Share (%) and BPS Analysis by Packaging Type, 2025 to 2035
  • Figure 40: North America Market Y-o-Y Growth (%) Projections by Packaging Type, 2025 to 2035
  • Figure 41: North America Market Value (USD Million) Analysis by Distribution Channel, 2020 to 2035
  • Figure 42: North America Market Volume (Litres) Analysis by Distribution Channel, 2020 to 2035
  • Figure 43: North America Market Value Share (%) and BPS Analysis by Distribution Channel, 2025 to 2035
  • Figure 44: North America Market Y-o-Y Growth (%) Projections by Distribution Channel, 2025 to 2035
  • Figure 45: North America Market Attractiveness by Product Type, 2025 to 2035
  • Figure 46: North America Market Attractiveness by Packaging Type, 2025 to 2035
  • Figure 47: North America Market Attractiveness by Distribution Channel, 2025 to 2035
  • Figure 48: North America Market Attractiveness by Country, 2025 to 2035
  • Figure 49: Latin America Market Value (USD Million) by Product Type, 2025 to 2035
  • Figure 50: Latin America Market Value (USD Million) by Packaging Type, 2025 to 2035
  • Figure 51: Latin America Market Value (USD Million) by Distribution Channel, 2025 to 2035
  • Figure 52: Latin America Market Value (USD Million) by Country, 2025 to 2035
  • Figure 53: Latin America Market Value (USD Million) Analysis by Country, 2020 to 2035
  • Figure 54: Latin America Market Volume (Litres) Analysis by Country, 2020 to 2035
  • Figure 55: Latin America Market Value Share (%) and BPS Analysis by Country, 2025 to 2035
  • Figure 56: Latin America Market Y-o-Y Growth (%) Projections by Country, 2025 to 2035
  • Figure 57: Latin America Market Value (USD Million) Analysis by Product Type, 2020 to 2035
  • Figure 58: Latin America Market Volume (Litres) Analysis by Product Type, 2020 to 2035
  • Figure 59: Latin America Market Value Share (%) and BPS Analysis by Product Type, 2025 to 2035
  • Figure 60: Latin America Market Y-o-Y Growth (%) Projections by Product Type, 2025 to 2035
  • Figure 61: Latin America Market Value (USD Million) Analysis by Packaging Type, 2020 to 2035
  • Figure 62: Latin America Market Volume (Litres) Analysis by Packaging Type, 2020 to 2035
  • Figure 63: Latin America Market Value Share (%) and BPS Analysis by Packaging Type, 2025 to 2035
  • Figure 64: Latin America Market Y-o-Y Growth (%) Projections by Packaging Type, 2025 to 2035
  • Figure 65: Latin America Market Value (USD Million) Analysis by Distribution Channel, 2020 to 2035
  • Figure 66: Latin America Market Volume (Litres) Analysis by Distribution Channel, 2020 to 2035
  • Figure 67: Latin America Market Value Share (%) and BPS Analysis by Distribution Channel, 2025 to 2035
  • Figure 68: Latin America Market Y-o-Y Growth (%) Projections by Distribution Channel, 2025 to 2035
  • Figure 69: Latin America Market Attractiveness by Product Type, 2025 to 2035
  • Figure 70: Latin America Market Attractiveness by Packaging Type, 2025 to 2035
  • Figure 71: Latin America Market Attractiveness by Distribution Channel, 2025 to 2035
  • Figure 72: Latin America Market Attractiveness by Country, 2025 to 2035
  • Figure 73: Europe Market Value (USD Million) by Product Type, 2025 to 2035
  • Figure 74: Europe Market Value (USD Million) by Packaging Type, 2025 to 2035
  • Figure 75: Europe Market Value (USD Million) by Distribution Channel, 2025 to 2035
  • Figure 76: Europe Market Value (USD Million) by Country, 2025 to 2035
  • Figure 77: Europe Market Value (USD Million) Analysis by Country, 2020 to 2035
  • Figure 78: Europe Market Volume (Litres) Analysis by Country, 2020 to 2035
  • Figure 79: Europe Market Value Share (%) and BPS Analysis by Country, 2025 to 2035
  • Figure 80: Europe Market Y-o-Y Growth (%) Projections by Country, 2025 to 2035
  • Figure 81: Europe Market Value (USD Million) Analysis by Product Type, 2020 to 2035
  • Figure 82: Europe Market Volume (Litres) Analysis by Product Type, 2020 to 2035
  • Figure 83: Europe Market Value Share (%) and BPS Analysis by Product Type, 2025 to 2035
  • Figure 84: Europe Market Y-o-Y Growth (%) Projections by Product Type, 2025 to 2035
  • Figure 85: Europe Market Value (USD Million) Analysis by Packaging Type, 2020 to 2035
  • Figure 86: Europe Market Volume (Litres) Analysis by Packaging Type, 2020 to 2035
  • Figure 87: Europe Market Value Share (%) and BPS Analysis by Packaging Type, 2025 to 2035
  • Figure 88: Europe Market Y-o-Y Growth (%) Projections by Packaging Type, 2025 to 2035
  • Figure 89: Europe Market Value (USD Million) Analysis by Distribution Channel, 2020 to 2035
  • Figure 90: Europe Market Volume (Litres) Analysis by Distribution Channel, 2020 to 2035
  • Figure 91: Europe Market Value Share (%) and BPS Analysis by Distribution Channel, 2025 to 2035
  • Figure 92: Europe Market Y-o-Y Growth (%) Projections by Distribution Channel, 2025 to 2035
  • Figure 93: Europe Market Attractiveness by Product Type, 2025 to 2035
  • Figure 94: Europe Market Attractiveness by Packaging Type, 2025 to 2035
  • Figure 95: Europe Market Attractiveness by Distribution Channel, 2025 to 2035
  • Figure 96: Europe Market Attractiveness by Country, 2025 to 2035
  • Figure 97: Asia Pacific Market Value (USD Million) by Product Type, 2025 to 2035
  • Figure 98: Asia Pacific Market Value (USD Million) by Packaging Type, 2025 to 2035
  • Figure 99: Asia Pacific Market Value (USD Million) by Distribution Channel, 2025 to 2035
  • Figure 100: Asia Pacific Market Value (USD Million) by Country, 2025 to 2035
  • Figure 101: Asia Pacific Market Value (USD Million) Analysis by Country, 2020 to 2035
  • Figure 102: Asia Pacific Market Volume (Litres) Analysis by Country, 2020 to 2035
  • Figure 103: Asia Pacific Market Value Share (%) and BPS Analysis by Country, 2025 to 2035
  • Figure 104: Asia Pacific Market Y-o-Y Growth (%) Projections by Country, 2025 to 2035
  • Figure 105: Asia Pacific Market Value (USD Million) Analysis by Product Type, 2020 to 2035
  • Figure 106: Asia Pacific Market Volume (Litres) Analysis by Product Type, 2020 to 2035
  • Figure 107: Asia Pacific Market Value Share (%) and BPS Analysis by Product Type, 2025 to 2035
  • Figure 108: Asia Pacific Market Y-o-Y Growth (%) Projections by Product Type, 2025 to 2035
  • Figure 109: Asia Pacific Market Value (USD Million) Analysis by Packaging Type, 2020 to 2035
  • Figure 110: Asia Pacific Market Volume (Litres) Analysis by Packaging Type, 2020 to 2035
  • Figure 111: Asia Pacific Market Value Share (%) and BPS Analysis by Packaging Type, 2025 to 2035
  • Figure 112: Asia Pacific Market Y-o-Y Growth (%) Projections by Packaging Type, 2025 to 2035
  • Figure 113: Asia Pacific Market Value (USD Million) Analysis by Distribution Channel, 2020 to 2035
  • Figure 114: Asia Pacific Market Volume (Litres) Analysis by Distribution Channel, 2020 to 2035
  • Figure 115: Asia Pacific Market Value Share (%) and BPS Analysis by Distribution Channel, 2025 to 2035
  • Figure 116: Asia Pacific Market Y-o-Y Growth (%) Projections by Distribution Channel, 2025 to 2035
  • Figure 117: Asia Pacific Market Attractiveness by Product Type, 2025 to 2035
  • Figure 118: Asia Pacific Market Attractiveness by Packaging Type, 2025 to 2035
  • Figure 119: Asia Pacific Market Attractiveness by Distribution Channel, 2025 to 2035
  • Figure 120: Asia Pacific Market Attractiveness by Country, 2025 to 2035
  • Figure 121: MEA Market Value (USD Million) by Product Type, 2025 to 2035
  • Figure 122: MEA Market Value (USD Million) by Packaging Type, 2025 to 2035
  • Figure 123: MEA Market Value (USD Million) by Distribution Channel, 2025 to 2035
  • Figure 124: MEA Market Value (USD Million) by Country, 2025 to 2035
  • Figure 125: MEA Market Value (USD Million) Analysis by Country, 2020 to 2035
  • Figure 126: MEA Market Volume (Litres) Analysis by Country, 2020 to 2035
  • Figure 127: MEA Market Value Share (%) and BPS Analysis by Country, 2025 to 2035
  • Figure 128: MEA Market Y-o-Y Growth (%) Projections by Country, 2025 to 2035
  • Figure 129: MEA Market Value (USD Million) Analysis by Product Type, 2020 to 2035
  • Figure 130: MEA Market Volume (Litres) Analysis by Product Type, 2020 to 2035
  • Figure 131: MEA Market Value Share (%) and BPS Analysis by Product Type, 2025 to 2035
  • Figure 132: MEA Market Y-o-Y Growth (%) Projections by Product Type, 2025 to 2035
  • Figure 133: MEA Market Value (USD Million) Analysis by Packaging Type, 2020 to 2035
  • Figure 134: MEA Market Volume (Litres) Analysis by Packaging Type, 2020 to 2035
  • Figure 135: MEA Market Value Share (%) and BPS Analysis by Packaging Type, 2025 to 2035
  • Figure 136: MEA Market Y-o-Y Growth (%) Projections by Packaging Type, 2025 to 2035
  • Figure 137: MEA Market Value (USD Million) Analysis by Distribution Channel, 2020 to 2035
  • Figure 138: MEA Market Volume (Litres) Analysis by Distribution Channel, 2020 to 2035
  • Figure 139: MEA Market Value Share (%) and BPS Analysis by Distribution Channel, 2025 to 2035
  • Figure 140: MEA Market Y-o-Y Growth (%) Projections by Distribution Channel, 2025 to 2035
  • Figure 141: MEA Market Attractiveness by Product Type, 2025 to 2035
  • Figure 142: MEA Market Attractiveness by Packaging Type, 2025 to 2035
  • Figure 143: MEA Market Attractiveness by Distribution Channel, 2025 to 2035
  • Figure 144: MEA Market Attractiveness by Country, 2025 to 2035

Frequently Asked Questions

How big is the cider market in 2025 and 2035?

The global cider market is valued at USD 109.8 billion in 2025 and projected to reach USD 137.6 billion by 2035.

Which is the top product type in the cider market?

Flavored cider dominates the market with a 64% share in 2025.

What is the growth outlook for the cider market?

The cider market is forecasted to grow at a CAGR of 4.3% from 2025 to 2035.

Which country will see the fastest growth in cider consumption?

China is expected to be the fastest-growing market with a 7.2% CAGR during the forecast period.

Explore Similar Insights

Future Market Insights

Cider Market