The role of packaging inthe cider industry becomes quintessential for the preservation and maintenance of cider products' quality, freshness, and attractiveness. With the cider industry expanding right now, package manufacturers are creating new alternatives to satisfy consumer requirements for sustainable, convenient, and high-class design. The market is rapidly embracing eco-friendly raw materials, lightweight packaging, and smart labeling systems to engage consumers while complying with regulations.
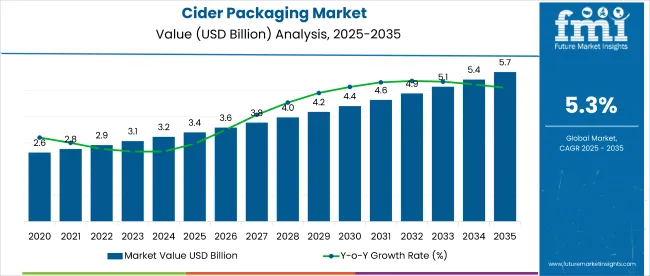
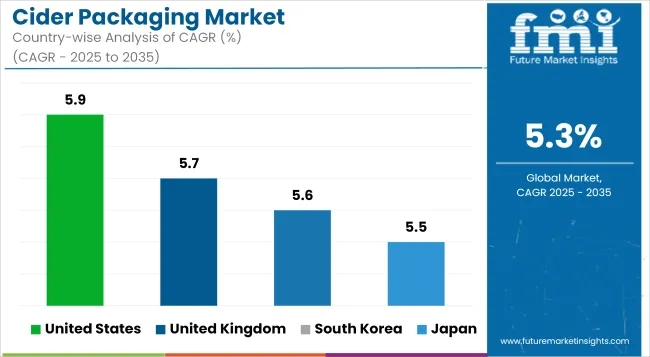
The global cider packaging market is forecast to reach USD 3.4 billion by 2025, with an estimated CAGR of 5.3%, reaching USD 5.7 billion by 2035. Growth is driven by the demand for craft ciders, premium packaging designs, and sustainable packaging solutions.
Innovations in biodegradable bottles, the growing popularity of aluminium cans, and digital printing methods are accelerating market growth. Packaging formats that are resealable and reusable are becoming more in demand, giving consumers sustainable and convenient choices.
Brands are introducing temperature-sensitive labels that inform consumers about the optimal serving conditions. Moreover, minimalist packaging designs are emerging to fulfill the premiumization trend in the cider industry. The AI-driven supply chain management is optimizing the usage of packaging materials and reducing waste in production.
Key Market Metrics
Metric | Value |
---|---|
Market Size in 2025 | USD 3.4 Billion |
Projected Market Size in 2035 | USD 5.7 Billion |
CAGR (2025 to 2035) | 5.3% |
The cider packaging market in the Asia-Pacific region is set to grow as there is an increasing urban middle class and more people are demanding alcoholic beverages. Countries such as China, Japan, and South Korea are shifting to more premium and imported ciders, leading to an increase in demand for quality glass bottles and sustainable packaging.
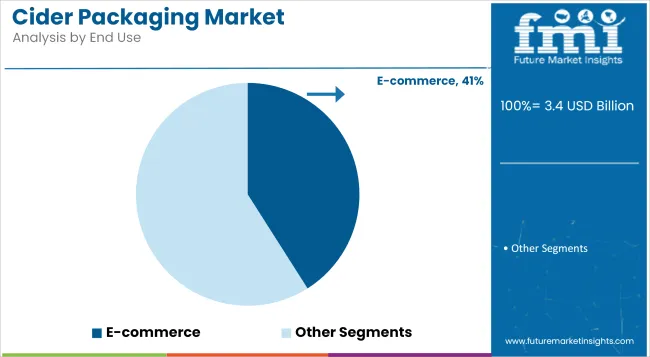
The direct-to-consumer sale and growth of e-commerce further push consumers into requiring protective and visually appealing packaging. With the government-promoting policies towards sustainability, recyclable cans and biodegradable cartons also become more accepted.
Greater investments in smart, opening technology such as NFC-enabled labels improve consumer interaction and brand engagement. The cider production from emerging economies also necessitated cost-effective scalable packaging. Further, lightweight high-barrier materials reduce packaging costs and increase transport efficiency by manufacturers.
North America remains a dominant player in the cider packaging market, North America, however, still remains a stronghold in the cider packaging business, driven largely by a thriving craft cider industry and consumers favoring innovations in portable-type packaging. About the world, more and more aluminum can-vision is being developed in the USA and Canada, owing to its recyclability and lightweight.
Sustainable packaging initiatives are increasingly motivating cider brands to move from plastic shrink wraps to paperboard carriers and biodegradable alternatives. Digital printing technologies, allowing brands to create personalized and limited-edition packaging, are also giving added value through consumer engagement.
Existence of the DTC market for cider sales boosts the demand for protective and pleasing packaging solutions. Current growing trends for organic and natural ciders are propelling brands to start looking toward environmental-friendly and plastic-free alternatives for packaging. AI-integrated supply chain solutions are improving the availability of packaging material and minimizing wastage.
A part of this market in cider packaging is significantly led by Europe in terms of sales and innovations from countries like the UK, France, and Spain through the design of glass bottles with sustainable packaging solutions. However, this strict reputation for cider and environmental regulations in the region are encouraging manufacturers to use returnable glass bottles, FSC-certified paper labels, and biodegradable caps in their bottling operations.
Premiumization in cider is resulting in a very high demand for embossed bottles, luxurious packaging formats, and smart labels capable of verifying traceability and authentication. Lessening the carbon footprint as well as the cost of transporting cider has encouraged the use of lightweight alternatives.
Brands have also incorporated augmented reality (AR) labels that allow customers to experience the products interactively. The region is heading towards refillable and reusable packaging solutions, thus reinforcing the sustainability movement.
Sustainability concerns and material costs While sustainable packaging is gaining traction, the higher costs associated with biodegradable bottles and premium packaging materials pose a challenge for small and mid-sized cider producers. Additionally, maintaining packaging integrity for cider’s carbonation and freshness requires advanced barrier technologies, which can increase production costs.
Eco-friendly innovations, smart packaging, and digital branding Manufacturers are developing compostable and plant-based packaging materials to meet sustainability goals. The integration of smart packaging, including QR codes and NFC-enabled labels, is providing consumers with product information, promotions, and authenticity verification. Digital printing and AI-driven customization are enabling cider brands to create unique, consumer-focused packaging experiences.
From 2020 to 2024, the cider packaging industry began to lean more on lighter recyclable materials while embracing much more aluminum cans and glass alternatives on the one hand. The personalized branding and green requirements increased considerably, as did the packaging designs that catered to the needs of the convenience-focused consumers.
Smart packaging solutions continued to study the interest of the consumers, including temperature-sensitive labels and QR codes, for better product contact. Innovations pertaining to protective coatings further develop the resistance quality of glass and aluminum cans; therefore, long shelf life is maintained with such innovations.
Between 2025 and 2035, the market will go even further into an optimum world with AI-driven packaging optimization, sustainable raw materials, and smart tracking technologies. Progress in refillable packaging, the circular economy concept, and high-performance barrier coatings will further shape the trends in the markets.
In due time, bio-based polymers would become a mainstream option in carbon-neutral packaging solutions. Augmented reality-enabled features present in interactive digital packaging would revolutionize consumer engagement. Together with optimized supply, predictive analytics powered by AI would result in reduced material wastage.
Market Shift | 2020 to 2024 Trends |
---|---|
Regulatory Landscape | Early-stage sustainability guidelines, voluntary eco-friendly initiatives |
Material Innovation | Increased use of aluminum cans and lightweight glass |
Industry Adoption | Expansion of craft cider packaging, retail-focused designs |
Market Competition | Dominated by traditional cider packaging manufacturers |
Market Growth Drivers | Consumer demand for portability, sustainability trends |
Sustainability and Environmental Impact | Early adoption of recyclable packaging, limited compostable solutions |
Integration of AI and Process Optimization | Digital printing advancements, smart labels in niche markets |
Advancements in Packaging Technology | Standardized bottle and can designs, focus on brand differentiation |
Market Shift | 2025 to 2035 Projections |
---|---|
Regulatory Landscape | Stricter packaging waste policies, mandatory recycled content regulations |
Material Innovation | Advanced biodegradable bottles, plant-based polymers, and carbon-neutral packaging |
Industry Adoption | Growth in direct-to-consumer packaging, AI-driven predictive packaging models |
Market Competition | Entry of tech-driven sustainable packaging startups and digital printing specialists |
Market Growth Drivers | AI-powered packaging optimization, blockchain-enabled traceability, and next-gen refillable solutions |
Sustainability and Environmental Impact | Full-scale adoption of compostable, reusable, and circular economy-based cider packaging |
Integration of AI and Process Optimization | Widespread adoption of NFC-enabled authentication, AI-driven material selection, and smart supply chains |
Advancements in Packaging Technology | Interactive, customizable cider packaging with digital engagement features and AI-driven design trends |
The USA usually maintains a stronghold over the cider packaging market owing to the ever-increasing consumer preferences for craft and premium ciders. Manufacturers invest in innovative and eco-friendly packaging solutions like glass bottles, aluminum cans, and even some biodegradable cartons.
The pull of canned ciders has propelled the adoption of lightweight recyclable packagings with high-quality prints for brand identification. They incorporate smart labels that have QR codes to increase consumer interaction and traceability.
As an extension, companies also test alternatives to compostable packaging for their sustainability objectives and eco-minded customers. Optimizing the use of materials and enhancing branding possibilities are important features of design tools powered by AI. Demand for resealable aluminum cans is rising, thus offering greater convenience for consumers with less waste of the product.
Country | CAGR (2025 to 2035) |
---|---|
United States | 5.9% |
Cider is still the most preferred alcoholic drink in pubs, retail stores, and e-commerce within the expanding UK cider packaging market. As a result, there has been increased demand in recent years for glass bottles with custom embossing, aluminum cans with matte finishes, and recyclable paperboard cartons, among other eco-friendly and premium-packaging solutions.
UK manufacturers now adopted lightweight glass as well as biodegradable can-coating technologies aimed at addressing sustainability while ensuring product integrity. Besides, the increasing trend of alcohol sales through online channels necessitates more secured and protective packaging against damages during transit.
The exploration of perfect packaging options through tamper-evident and resealable features also paves the way for convenience and safety. Recent trends in AI-driven optimization of logistics, optimized packaging distribution without environment degenerations, remain booming to all manufacturing companies. The increasing trend in personalized and limited-edition cider packaging will continue to fuel the demand for digital printing and unique branding aspects.
Country | CAGR (2025 to 2035) |
---|---|
United Kingdom | 5.7% |
The cider packaging market in Japan is undergoing restructuring as both foreign and local brands introduce craft cider for consumer delectation. The manufacturers prefer high-quality material for packaging; UV-protected glass bottles and eco-friendly cans keep the cider really fresh and good-looking. Japanese cider brands follow a minimalist yet premium design, using digital print for customization.
Find increasingly popular the trend of single-serve format and on-the-go cider packages; hence the innovation of lightweight PET bottles and resealable aluminum cans. Also under assessment are biodegradable coatings which markedly improve sustainability with very little compromise in performance.
Smart labels integrated with QR codes further help consumers get product information and also verify authenticity. Innovations in high-barrier materials will provide better shelf life for cider by preventing oxidation and exposure to light.
Country | CAGR (2025 to 2035) |
---|---|
Japan | 5.5% |
Strong growth in South Korea's cider packaging market is being driven by younger consumers choosing cider as a beer and wine alternative instead. The companies have established investments in modern, sleek jars with interactive labels and an augmented reality experience, and temperature-sensing indicators.
The manufacturers also explore paper-based biodegradable and sugarcane-based packaging with the mention of "age," much as they would with eco-think consumers. Cider is increasingly becoming the drink of choice in nightclubs and restaurants, creating the need for fashionable limited-edition specialty packs to strengthen brand identity and exclusivity.
Country | CAGR (2025 to 2035) |
---|---|
South Korea | 5.6% |
Glass bottle, aluminum can, and eco-friendly carton segments fuel market growth as brands invest in durability, recyclability, and premium design features. Brands are adding cider packaging with protective coatings, embossing, and interactive brand technologies. Biodegradable and plant-based coatings are also gaining traction to support sustainability efforts.
AI-based quality control systems are streamlining material consumption and consistency in packaging production. The market for intelligent packaging with temperature indicator and tamper-proof properties is expanding to enhance product integrity and consumer trust.
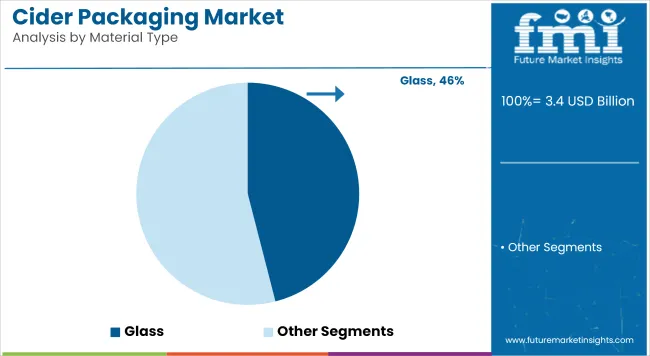
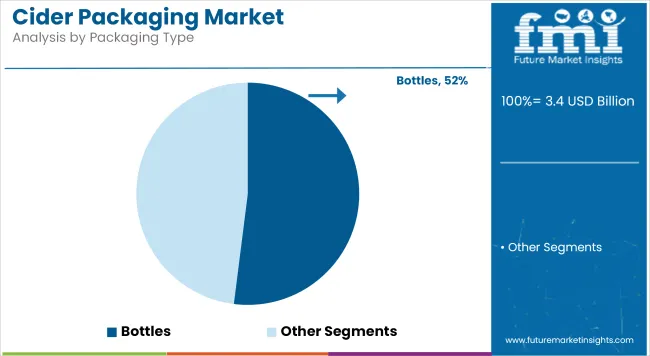
Glass Bottles Remain the Preferred Choice for Premium Cider Brands
Glass bottles still rule the premium cider market because of their ability to preserve product quality and strengthen brand image. The companies are investing in light-weight glass, embossed branding, and UV-coatings to make the product more sustainable and durable. Demand for resealable and twist-off cap shapes is also rising to enhance convenience.
Aluminum Cans Gain Popularity for Convenience and Sustainability
Aluminum cans are catching up in cider because they are light, recyclable, convenient, and easy to consume on the go. Brands come up with matte-finish cans with digital printing to feature bright, attention-grabbing brands. Furthermore, the development of resealable can tops and nitrogen-packed cider cans is also increasing customer experience and product distinction.
Sustainable Cartons and Flexible Pouches Expand Eco-Friendly Options
Brands are increasingly using paper-based cartons and flexible pouches for cider packaging to minimize the environmental footprint. Compostable and recyclable materials, and plant-based inks, are used by manufacturers to achieve sustainability objectives. Growing demand for refillable and reusable cider packaging forms is also stimulating the use of alternative packaging materials.
Companies are also creating high-barrier paper-based cartons to maximize shelf life and minimize leakage. Breakthroughs in moisture-resistant finishes are enhancing flexible pouch durability. AI-driven analysis of materials is assisting in achieving the best package strength with minimum compromise on sustainability. The minimalist, plastic-free cider packaging is becoming more in demand as manufacturers look to promote a cleaner and more natural visual identity.
Smart packaging innovations for cider include NFC technology-based smart labeling, AI-driven design personalization, and biodegradable packaging solutions. Tamper-proof and freshness-indicator packaging is investigated by companies to boost consumer confidence and product integrity.
Investigation of bio-based coatings and lightweight packaging solutions is enhancing sustainability without compromising on durability. The use of augmented reality (AR) packaging is delivering interactive brand experiences and engaging consumers in novel ways. Breakthroughs in 3D-printed eco-friendly package designs are picking up speed too, making products more customized with less waste involved.
As the cider business continues to evolve, packaging innovation will center around premium looks, sustainable materials, and intelligent technology to address consumers' needs for convenience, sustainability, and better brand experiences.
Cider Packaging Market Maintains Market Relevance as Branding, Sustainability, and Product Differentiation Drive Demand
Cider packaging continues to evolve as brands focus on aesthetics, sustainability, and consumer engagement. With the rise of craft and premium cider brands, packaging plays a crucial role in enhancing brand recognition, maintaining product freshness, and attracting consumers in competitive retail environments.
The growing demand for sustainable and visually appealing packaging is driving innovation in the cider packaging market. Research indicates that over 65% of cider producers are adopting eco-friendly materials, lightweight packaging, and premium branding to meet evolving consumer preferences.
Manufacturers are introducing recyclable aluminum cans, lightweight glass bottles, and biodegradable labels to align with sustainability goals. Innovations in resealable closures, UV-resistant coatings, and digital printing technology are reshaping the market.
Developments in sustainable secondary packaging, customized bottle designs, and smart labeling solutions are expanding applications across retail, e-commerce, and on-premise cider sales.
Premiumization and Sustainability Drive Market Growth as Brands Focus on Packaging Innovation
Cider brands are utilizing packaging to add product appeal, promote eco-friendly causes, and stand out in a competitive marketplace. Brands are spending money on high-end materials, simple design, and dynamic packaging solutions in order to create a powerful brand image.
A lot of brands are using textured glass and embossed logos in order to build shelf presence. Advances in digital printing enable economic customization of cider packaging. Innovative developments in biodegradable and compostable packaging are also aiding cider brands to achieve sustainability targets.
Cider Producers Expand Use of Sustainable and Premium Packaging to Enhance Consumer Appeal
Cider producers increasingly use recyclable glass bottles, aluminum cans, and compostable carton packaging to reduce environmental footprint. The materials provide durability, recyclability, and premium appearance that attract environmentally friendly consumers.
With demand for artisanal and craft ciders on the upswing, manufacturers are adding embossed labels, metallic finishes, and custom-molded containers to deliver a signature shelf presence. QR codes and augmented reality (AR) elements are becoming increasingly popular, allowing consumers to discover product origin and brand narratives.
While innovative packaging for cider increases product differentiation, challenges including cost, supply chain limitations, and regulatory requirements remain. Nonetheless, progress in lightweight packaging, bio-based inks, and refillable bottle programs is countering these challenges.
Retail and On-Premise Segments Boost Demand as Functional and Branded Packaging Becomes Essential
On-premise accounts and retailers are focusing on cider packaging that maximizes shelf presence, simplifies product handling, and is sustainable. The use of multi-pack formats, tamper-evident enclosures, and resealable closures is increasing across both accounts.
Kegged cider packaging is also rising in demand for bars and restaurants, as it minimizes waste and maintains product quality.
The market for cider packaging is growing as brands look for high-impact, sustainable, and consumer-friendly solutions. Top makers are launching recyclable, lightweight, and interactive packaging designs. Some of the prominent trends are compostable labels, premium embossed glass, and AR-enabled smart packaging.
The market growth is being fueled by partnerships between cider brands and sustainable packaging companies. The growth in digital printing technology is facilitating more affordable and customizable packaging solutions. Brands are testing holographic finishes and textured labels to create greater visual impact.
Shatter-resistant glass bottles are increasingly in demand as cider brands focus on safety and durability. Some brands are incorporating NFC-enabled smart labels to give consumers product authenticity information and interactive experiences. Eco-friendly adhesives and water-based inks are also becoming the norm in cider packaging manufacturing.
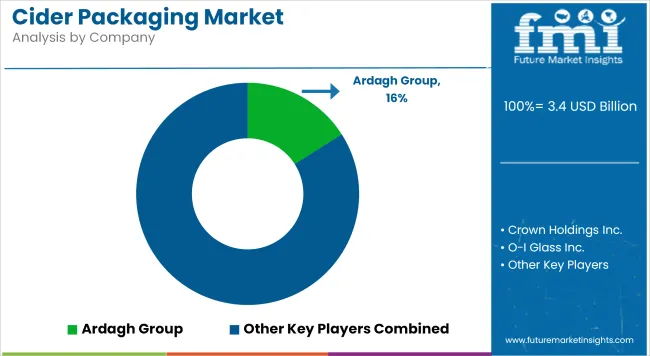
Market Share Analysis by Company
Company Name | Estimated Market Share (%) |
---|---|
Ardagh Group | 12-16% |
Crown Holdings Inc. | 9-13% |
O-I Glass Inc. | 7-11% |
Ball Corporation | 5-9% |
WestRock Company | 4-7% |
Other Companies | 51-61% |
Company Name | Key Offerings/Activities |
---|---|
Ardagh Group | Develops premium glass bottles with customized embossing and sustainable designs. |
Crown Holdings Inc. | Specializes in recyclable aluminum cans with advanced print finishes for cider branding. |
O-I Glass Inc. | Produces lightweight and durable glass packaging for cider and craft beverage markets. |
Ball Corporation | Innovates with resealable aluminum bottles and eco-friendly cider packaging. |
WestRock Company | Supplies recyclable carton packaging and secondary packaging solutions for cider brands. |
Key Company Insights
Other Key Players (51-61% Combined)
Table 1: Global Market Value (US$ Million) Forecast by Region, 2018 to 2033
Table 2: Global Market Volume (Units) Forecast by Region, 2018 to 2033
Table 3: Global Market Value (US$ Million) Forecast by Material Type, 2018 to 2033
Table 4: Global Market Volume (Units) Forecast by Material Type, 2018 to 2033
Table 5: Global Market Value (US$ Million) Forecast by Packaging Type, 2018 to 2033
Table 6: Global Market Volume (Units) Forecast by Packaging Type, 2018 to 2033
Table 7: Global Market Value (US$ Million) Forecast by End Use, 2018 to 2033
Table 8: Global Market Volume (Units) Forecast by End Use, 2018 to 2033
Table 9: North America Market Value (US$ Million) Forecast by Country, 2018 to 2033
Table 10: North America Market Volume (Units) Forecast by Country, 2018 to 2033
Table 11: North America Market Value (US$ Million) Forecast by Material Type, 2018 to 2033
Table 12: North America Market Volume (Units) Forecast by Material Type, 2018 to 2033
Table 13: North America Market Value (US$ Million) Forecast by Packaging Type, 2018 to 2033
Table 14: North America Market Volume (Units) Forecast by Packaging Type, 2018 to 2033
Table 15: North America Market Value (US$ Million) Forecast by End Use, 2018 to 2033
Table 16: North America Market Volume (Units) Forecast by End Use, 2018 to 2033
Table 17: Latin America Market Value (US$ Million) Forecast by Country, 2018 to 2033
Table 18: Latin America Market Volume (Units) Forecast by Country, 2018 to 2033
Table 19: Latin America Market Value (US$ Million) Forecast by Material Type, 2018 to 2033
Table 20: Latin America Market Volume (Units) Forecast by Material Type, 2018 to 2033
Table 21: Latin America Market Value (US$ Million) Forecast by Packaging Type, 2018 to 2033
Table 22: Latin America Market Volume (Units) Forecast by Packaging Type, 2018 to 2033
Table 23: Latin America Market Value (US$ Million) Forecast by End Use, 2018 to 2033
Table 24: Latin America Market Volume (Units) Forecast by End Use, 2018 to 2033
Table 25: Western Europe Market Value (US$ Million) Forecast by Country, 2018 to 2033
Table 26: Western Europe Market Volume (Units) Forecast by Country, 2018 to 2033
Table 27: Western Europe Market Value (US$ Million) Forecast by Material Type, 2018 to 2033
Table 28: Western Europe Market Volume (Units) Forecast by Material Type, 2018 to 2033
Table 29: Western Europe Market Value (US$ Million) Forecast by Packaging Type, 2018 to 2033
Table 30: Western Europe Market Volume (Units) Forecast by Packaging Type, 2018 to 2033
Table 31: Western Europe Market Value (US$ Million) Forecast by End Use, 2018 to 2033
Table 32: Western Europe Market Volume (Units) Forecast by End Use, 2018 to 2033
Table 33: Eastern Europe Market Value (US$ Million) Forecast by Country, 2018 to 2033
Table 34: Eastern Europe Market Volume (Units) Forecast by Country, 2018 to 2033
Table 35: Eastern Europe Market Value (US$ Million) Forecast by Material Type, 2018 to 2033
Table 36: Eastern Europe Market Volume (Units) Forecast by Material Type, 2018 to 2033
Table 37: Eastern Europe Market Value (US$ Million) Forecast by Packaging Type, 2018 to 2033
Table 38: Eastern Europe Market Volume (Units) Forecast by Packaging Type, 2018 to 2033
Table 39: Eastern Europe Market Value (US$ Million) Forecast by End Use, 2018 to 2033
Table 40: Eastern Europe Market Volume (Units) Forecast by End Use, 2018 to 2033
Table 41: South Asia and Pacific Market Value (US$ Million) Forecast by Country, 2018 to 2033
Table 42: South Asia and Pacific Market Volume (Units) Forecast by Country, 2018 to 2033
Table 43: South Asia and Pacific Market Value (US$ Million) Forecast by Material Type, 2018 to 2033
Table 44: South Asia and Pacific Market Volume (Units) Forecast by Material Type, 2018 to 2033
Table 45: South Asia and Pacific Market Value (US$ Million) Forecast by Packaging Type, 2018 to 2033
Table 46: South Asia and Pacific Market Volume (Units) Forecast by Packaging Type, 2018 to 2033
Table 47: South Asia and Pacific Market Value (US$ Million) Forecast by End Use, 2018 to 2033
Table 48: South Asia and Pacific Market Volume (Units) Forecast by End Use, 2018 to 2033
Table 49: East Asia Market Value (US$ Million) Forecast by Country, 2018 to 2033
Table 50: East Asia Market Volume (Units) Forecast by Country, 2018 to 2033
Table 51: East Asia Market Value (US$ Million) Forecast by Material Type, 2018 to 2033
Table 52: East Asia Market Volume (Units) Forecast by Material Type, 2018 to 2033
Table 53: East Asia Market Value (US$ Million) Forecast by Packaging Type, 2018 to 2033
Table 54: East Asia Market Volume (Units) Forecast by Packaging Type, 2018 to 2033
Table 55: East Asia Market Value (US$ Million) Forecast by End Use, 2018 to 2033
Table 56: East Asia Market Volume (Units) Forecast by End Use, 2018 to 2033
Table 57: Middle East and Africa Market Value (US$ Million) Forecast by Country, 2018 to 2033
Table 58: Middle East and Africa Market Volume (Units) Forecast by Country, 2018 to 2033
Table 59: Middle East and Africa Market Value (US$ Million) Forecast by Material Type, 2018 to 2033
Table 60: Middle East and Africa Market Volume (Units) Forecast by Material Type, 2018 to 2033
Table 61: Middle East and Africa Market Value (US$ Million) Forecast by Packaging Type, 2018 to 2033
Table 62: Middle East and Africa Market Volume (Units) Forecast by Packaging Type, 2018 to 2033
Table 63: Middle East and Africa Market Value (US$ Million) Forecast by End Use, 2018 to 2033
Table 64: Middle East and Africa Market Volume (Units) Forecast by End Use, 2018 to 2033
Figure 1: Global Market Value (US$ Million) by Material Type, 2023 to 2033
Figure 2: Global Market Value (US$ Million) by Packaging Type, 2023 to 2033
Figure 3: Global Market Value (US$ Million) by End Use, 2023 to 2033
Figure 4: Global Market Value (US$ Million) by Region, 2023 to 2033
Figure 5: Global Market Value (US$ Million) Analysis by Region, 2018 to 2033
Figure 6: Global Market Volume (Units) Analysis by Region, 2018 to 2033
Figure 7: Global Market Value Share (%) and BPS Analysis by Region, 2023 to 2033
Figure 8: Global Market Y-o-Y Growth (%) Projections by Region, 2023 to 2033
Figure 9: Global Market Value (US$ Million) Analysis by Material Type, 2018 to 2033
Figure 10: Global Market Volume (Units) Analysis by Material Type, 2018 to 2033
Figure 11: Global Market Value Share (%) and BPS Analysis by Material Type, 2023 to 2033
Figure 12: Global Market Y-o-Y Growth (%) Projections by Material Type, 2023 to 2033
Figure 13: Global Market Value (US$ Million) Analysis by Packaging Type, 2018 to 2033
Figure 14: Global Market Volume (Units) Analysis by Packaging Type, 2018 to 2033
Figure 15: Global Market Value Share (%) and BPS Analysis by Packaging Type, 2023 to 2033
Figure 16: Global Market Y-o-Y Growth (%) Projections by Packaging Type, 2023 to 2033
Figure 17: Global Market Value (US$ Million) Analysis by End Use, 2018 to 2033
Figure 18: Global Market Volume (Units) Analysis by End Use, 2018 to 2033
Figure 19: Global Market Value Share (%) and BPS Analysis by End Use, 2023 to 2033
Figure 20: Global Market Y-o-Y Growth (%) Projections by End Use, 2023 to 2033
Figure 21: Global Market Attractiveness by Material Type, 2023 to 2033
Figure 22: Global Market Attractiveness by Packaging Type, 2023 to 2033
Figure 23: Global Market Attractiveness by End Use, 2023 to 2033
Figure 24: Global Market Attractiveness by Region, 2023 to 2033
Figure 25: North America Market Value (US$ Million) by Material Type, 2023 to 2033
Figure 26: North America Market Value (US$ Million) by Packaging Type, 2023 to 2033
Figure 27: North America Market Value (US$ Million) by End Use, 2023 to 2033
Figure 28: North America Market Value (US$ Million) by Country, 2023 to 2033
Figure 29: North America Market Value (US$ Million) Analysis by Country, 2018 to 2033
Figure 30: North America Market Volume (Units) Analysis by Country, 2018 to 2033
Figure 31: North America Market Value Share (%) and BPS Analysis by Country, 2023 to 2033
Figure 32: North America Market Y-o-Y Growth (%) Projections by Country, 2023 to 2033
Figure 33: North America Market Value (US$ Million) Analysis by Material Type, 2018 to 2033
Figure 34: North America Market Volume (Units) Analysis by Material Type, 2018 to 2033
Figure 35: North America Market Value Share (%) and BPS Analysis by Material Type, 2023 to 2033
Figure 36: North America Market Y-o-Y Growth (%) Projections by Material Type, 2023 to 2033
Figure 37: North America Market Value (US$ Million) Analysis by Packaging Type, 2018 to 2033
Figure 38: North America Market Volume (Units) Analysis by Packaging Type, 2018 to 2033
Figure 39: North America Market Value Share (%) and BPS Analysis by Packaging Type, 2023 to 2033
Figure 40: North America Market Y-o-Y Growth (%) Projections by Packaging Type, 2023 to 2033
Figure 41: North America Market Value (US$ Million) Analysis by End Use, 2018 to 2033
Figure 42: North America Market Volume (Units) Analysis by End Use, 2018 to 2033
Figure 43: North America Market Value Share (%) and BPS Analysis by End Use, 2023 to 2033
Figure 44: North America Market Y-o-Y Growth (%) Projections by End Use, 2023 to 2033
Figure 45: North America Market Attractiveness by Material Type, 2023 to 2033
Figure 46: North America Market Attractiveness by Packaging Type, 2023 to 2033
Figure 47: North America Market Attractiveness by End Use, 2023 to 2033
Figure 48: North America Market Attractiveness by Country, 2023 to 2033
Figure 49: Latin America Market Value (US$ Million) by Material Type, 2023 to 2033
Figure 50: Latin America Market Value (US$ Million) by Packaging Type, 2023 to 2033
Figure 51: Latin America Market Value (US$ Million) by End Use, 2023 to 2033
Figure 52: Latin America Market Value (US$ Million) by Country, 2023 to 2033
Figure 53: Latin America Market Value (US$ Million) Analysis by Country, 2018 to 2033
Figure 54: Latin America Market Volume (Units) Analysis by Country, 2018 to 2033
Figure 55: Latin America Market Value Share (%) and BPS Analysis by Country, 2023 to 2033
Figure 56: Latin America Market Y-o-Y Growth (%) Projections by Country, 2023 to 2033
Figure 57: Latin America Market Value (US$ Million) Analysis by Material Type, 2018 to 2033
Figure 58: Latin America Market Volume (Units) Analysis by Material Type, 2018 to 2033
Figure 59: Latin America Market Value Share (%) and BPS Analysis by Material Type, 2023 to 2033
Figure 60: Latin America Market Y-o-Y Growth (%) Projections by Material Type, 2023 to 2033
Figure 61: Latin America Market Value (US$ Million) Analysis by Packaging Type, 2018 to 2033
Figure 62: Latin America Market Volume (Units) Analysis by Packaging Type, 2018 to 2033
Figure 63: Latin America Market Value Share (%) and BPS Analysis by Packaging Type, 2023 to 2033
Figure 64: Latin America Market Y-o-Y Growth (%) Projections by Packaging Type, 2023 to 2033
Figure 65: Latin America Market Value (US$ Million) Analysis by End Use, 2018 to 2033
Figure 66: Latin America Market Volume (Units) Analysis by End Use, 2018 to 2033
Figure 67: Latin America Market Value Share (%) and BPS Analysis by End Use, 2023 to 2033
Figure 68: Latin America Market Y-o-Y Growth (%) Projections by End Use, 2023 to 2033
Figure 69: Latin America Market Attractiveness by Material Type, 2023 to 2033
Figure 70: Latin America Market Attractiveness by Packaging Type, 2023 to 2033
Figure 71: Latin America Market Attractiveness by End Use, 2023 to 2033
Figure 72: Latin America Market Attractiveness by Country, 2023 to 2033
Figure 73: Western Europe Market Value (US$ Million) by Material Type, 2023 to 2033
Figure 74: Western Europe Market Value (US$ Million) by Packaging Type, 2023 to 2033
Figure 75: Western Europe Market Value (US$ Million) by End Use, 2023 to 2033
Figure 76: Western Europe Market Value (US$ Million) by Country, 2023 to 2033
Figure 77: Western Europe Market Value (US$ Million) Analysis by Country, 2018 to 2033
Figure 78: Western Europe Market Volume (Units) Analysis by Country, 2018 to 2033
Figure 79: Western Europe Market Value Share (%) and BPS Analysis by Country, 2023 to 2033
Figure 80: Western Europe Market Y-o-Y Growth (%) Projections by Country, 2023 to 2033
Figure 81: Western Europe Market Value (US$ Million) Analysis by Material Type, 2018 to 2033
Figure 82: Western Europe Market Volume (Units) Analysis by Material Type, 2018 to 2033
Figure 83: Western Europe Market Value Share (%) and BPS Analysis by Material Type, 2023 to 2033
Figure 84: Western Europe Market Y-o-Y Growth (%) Projections by Material Type, 2023 to 2033
Figure 85: Western Europe Market Value (US$ Million) Analysis by Packaging Type, 2018 to 2033
Figure 86: Western Europe Market Volume (Units) Analysis by Packaging Type, 2018 to 2033
Figure 87: Western Europe Market Value Share (%) and BPS Analysis by Packaging Type, 2023 to 2033
Figure 88: Western Europe Market Y-o-Y Growth (%) Projections by Packaging Type, 2023 to 2033
Figure 89: Western Europe Market Value (US$ Million) Analysis by End Use, 2018 to 2033
Figure 90: Western Europe Market Volume (Units) Analysis by End Use, 2018 to 2033
Figure 91: Western Europe Market Value Share (%) and BPS Analysis by End Use, 2023 to 2033
Figure 92: Western Europe Market Y-o-Y Growth (%) Projections by End Use, 2023 to 2033
Figure 93: Western Europe Market Attractiveness by Material Type, 2023 to 2033
Figure 94: Western Europe Market Attractiveness by Packaging Type, 2023 to 2033
Figure 95: Western Europe Market Attractiveness by End Use, 2023 to 2033
Figure 96: Western Europe Market Attractiveness by Country, 2023 to 2033
Figure 97: Eastern Europe Market Value (US$ Million) by Material Type, 2023 to 2033
Figure 98: Eastern Europe Market Value (US$ Million) by Packaging Type, 2023 to 2033
Figure 99: Eastern Europe Market Value (US$ Million) by End Use, 2023 to 2033
Figure 100: Eastern Europe Market Value (US$ Million) by Country, 2023 to 2033
Figure 101: Eastern Europe Market Value (US$ Million) Analysis by Country, 2018 to 2033
Figure 102: Eastern Europe Market Volume (Units) Analysis by Country, 2018 to 2033
Figure 103: Eastern Europe Market Value Share (%) and BPS Analysis by Country, 2023 to 2033
Figure 104: Eastern Europe Market Y-o-Y Growth (%) Projections by Country, 2023 to 2033
Figure 105: Eastern Europe Market Value (US$ Million) Analysis by Material Type, 2018 to 2033
Figure 106: Eastern Europe Market Volume (Units) Analysis by Material Type, 2018 to 2033
Figure 107: Eastern Europe Market Value Share (%) and BPS Analysis by Material Type, 2023 to 2033
Figure 108: Eastern Europe Market Y-o-Y Growth (%) Projections by Material Type, 2023 to 2033
Figure 109: Eastern Europe Market Value (US$ Million) Analysis by Packaging Type, 2018 to 2033
Figure 110: Eastern Europe Market Volume (Units) Analysis by Packaging Type, 2018 to 2033
Figure 111: Eastern Europe Market Value Share (%) and BPS Analysis by Packaging Type, 2023 to 2033
Figure 112: Eastern Europe Market Y-o-Y Growth (%) Projections by Packaging Type, 2023 to 2033
Figure 113: Eastern Europe Market Value (US$ Million) Analysis by End Use, 2018 to 2033
Figure 114: Eastern Europe Market Volume (Units) Analysis by End Use, 2018 to 2033
Figure 115: Eastern Europe Market Value Share (%) and BPS Analysis by End Use, 2023 to 2033
Figure 116: Eastern Europe Market Y-o-Y Growth (%) Projections by End Use, 2023 to 2033
Figure 117: Eastern Europe Market Attractiveness by Material Type, 2023 to 2033
Figure 118: Eastern Europe Market Attractiveness by Packaging Type, 2023 to 2033
Figure 119: Eastern Europe Market Attractiveness by End Use, 2023 to 2033
Figure 120: Eastern Europe Market Attractiveness by Country, 2023 to 2033
Figure 121: South Asia and Pacific Market Value (US$ Million) by Material Type, 2023 to 2033
Figure 122: South Asia and Pacific Market Value (US$ Million) by Packaging Type, 2023 to 2033
Figure 123: South Asia and Pacific Market Value (US$ Million) by End Use, 2023 to 2033
Figure 124: South Asia and Pacific Market Value (US$ Million) by Country, 2023 to 2033
Figure 125: South Asia and Pacific Market Value (US$ Million) Analysis by Country, 2018 to 2033
Figure 126: South Asia and Pacific Market Volume (Units) Analysis by Country, 2018 to 2033
Figure 127: South Asia and Pacific Market Value Share (%) and BPS Analysis by Country, 2023 to 2033
Figure 128: South Asia and Pacific Market Y-o-Y Growth (%) Projections by Country, 2023 to 2033
Figure 129: South Asia and Pacific Market Value (US$ Million) Analysis by Material Type, 2018 to 2033
Figure 130: South Asia and Pacific Market Volume (Units) Analysis by Material Type, 2018 to 2033
Figure 131: South Asia and Pacific Market Value Share (%) and BPS Analysis by Material Type, 2023 to 2033
Figure 132: South Asia and Pacific Market Y-o-Y Growth (%) Projections by Material Type, 2023 to 2033
Figure 133: South Asia and Pacific Market Value (US$ Million) Analysis by Packaging Type, 2018 to 2033
Figure 134: South Asia and Pacific Market Volume (Units) Analysis by Packaging Type, 2018 to 2033
Figure 135: South Asia and Pacific Market Value Share (%) and BPS Analysis by Packaging Type, 2023 to 2033
Figure 136: South Asia and Pacific Market Y-o-Y Growth (%) Projections by Packaging Type, 2023 to 2033
Figure 137: South Asia and Pacific Market Value (US$ Million) Analysis by End Use, 2018 to 2033
Figure 138: South Asia and Pacific Market Volume (Units) Analysis by End Use, 2018 to 2033
Figure 139: South Asia and Pacific Market Value Share (%) and BPS Analysis by End Use, 2023 to 2033
Figure 140: South Asia and Pacific Market Y-o-Y Growth (%) Projections by End Use, 2023 to 2033
Figure 141: South Asia and Pacific Market Attractiveness by Material Type, 2023 to 2033
Figure 142: South Asia and Pacific Market Attractiveness by Packaging Type, 2023 to 2033
Figure 143: South Asia and Pacific Market Attractiveness by End Use, 2023 to 2033
Figure 144: South Asia and Pacific Market Attractiveness by Country, 2023 to 2033
Figure 145: East Asia Market Value (US$ Million) by Material Type, 2023 to 2033
Figure 146: East Asia Market Value (US$ Million) by Packaging Type, 2023 to 2033
Figure 147: East Asia Market Value (US$ Million) by End Use, 2023 to 2033
Figure 148: East Asia Market Value (US$ Million) by Country, 2023 to 2033
Figure 149: East Asia Market Value (US$ Million) Analysis by Country, 2018 to 2033
Figure 150: East Asia Market Volume (Units) Analysis by Country, 2018 to 2033
Figure 151: East Asia Market Value Share (%) and BPS Analysis by Country, 2023 to 2033
Figure 152: East Asia Market Y-o-Y Growth (%) Projections by Country, 2023 to 2033
Figure 153: East Asia Market Value (US$ Million) Analysis by Material Type, 2018 to 2033
Figure 154: East Asia Market Volume (Units) Analysis by Material Type, 2018 to 2033
Figure 155: East Asia Market Value Share (%) and BPS Analysis by Material Type, 2023 to 2033
Figure 156: East Asia Market Y-o-Y Growth (%) Projections by Material Type, 2023 to 2033
Figure 157: East Asia Market Value (US$ Million) Analysis by Packaging Type, 2018 to 2033
Figure 158: East Asia Market Volume (Units) Analysis by Packaging Type, 2018 to 2033
Figure 159: East Asia Market Value Share (%) and BPS Analysis by Packaging Type, 2023 to 2033
Figure 160: East Asia Market Y-o-Y Growth (%) Projections by Packaging Type, 2023 to 2033
Figure 161: East Asia Market Value (US$ Million) Analysis by End Use, 2018 to 2033
Figure 162: East Asia Market Volume (Units) Analysis by End Use, 2018 to 2033
Figure 163: East Asia Market Value Share (%) and BPS Analysis by End Use, 2023 to 2033
Figure 164: East Asia Market Y-o-Y Growth (%) Projections by End Use, 2023 to 2033
Figure 165: East Asia Market Attractiveness by Material Type, 2023 to 2033
Figure 166: East Asia Market Attractiveness by Packaging Type, 2023 to 2033
Figure 167: East Asia Market Attractiveness by End Use, 2023 to 2033
Figure 168: East Asia Market Attractiveness by Country, 2023 to 2033
Figure 169: Middle East and Africa Market Value (US$ Million) by Material Type, 2023 to 2033
Figure 170: Middle East and Africa Market Value (US$ Million) by Packaging Type, 2023 to 2033
Figure 171: Middle East and Africa Market Value (US$ Million) by End Use, 2023 to 2033
Figure 172: Middle East and Africa Market Value (US$ Million) by Country, 2023 to 2033
Figure 173: Middle East and Africa Market Value (US$ Million) Analysis by Country, 2018 to 2033
Figure 174: Middle East and Africa Market Volume (Units) Analysis by Country, 2018 to 2033
Figure 175: Middle East and Africa Market Value Share (%) and BPS Analysis by Country, 2023 to 2033
Figure 176: Middle East and Africa Market Y-o-Y Growth (%) Projections by Country, 2023 to 2033
Figure 177: Middle East and Africa Market Value (US$ Million) Analysis by Material Type, 2018 to 2033
Figure 178: Middle East and Africa Market Volume (Units) Analysis by Material Type, 2018 to 2033
Figure 179: Middle East and Africa Market Value Share (%) and BPS Analysis by Material Type, 2023 to 2033
Figure 180: Middle East and Africa Market Y-o-Y Growth (%) Projections by Material Type, 2023 to 2033
Figure 181: Middle East and Africa Market Value (US$ Million) Analysis by Packaging Type, 2018 to 2033
Figure 182: Middle East and Africa Market Volume (Units) Analysis by Packaging Type, 2018 to 2033
Figure 183: Middle East and Africa Market Value Share (%) and BPS Analysis by Packaging Type, 2023 to 2033
Figure 184: Middle East and Africa Market Y-o-Y Growth (%) Projections by Packaging Type, 2023 to 2033
Figure 185: Middle East and Africa Market Value (US$ Million) Analysis by End Use, 2018 to 2033
Figure 186: Middle East and Africa Market Volume (Units) Analysis by End Use, 2018 to 2033
Figure 187: Middle East and Africa Market Value Share (%) and BPS Analysis by End Use, 2023 to 2033
Figure 188: Middle East and Africa Market Y-o-Y Growth (%) Projections by End Use, 2023 to 2033
Figure 189: Middle East and Africa Market Attractiveness by Material Type, 2023 to 2033
Figure 190: Middle East and Africa Market Attractiveness by Packaging Type, 2023 to 2033
Figure 191: Middle East and Africa Market Attractiveness by End Use, 2023 to 2033
Figure 192: Middle East and Africa Market Attractiveness by Country, 2023 to 2033
The overall market size for the Cider Packaging Market was USD 3.4 Billion in 2025.
The Cider Packaging Market is expected to reach USD 5.7 Billion in 2035.
The Cider Packaging Market will be driven by increasing demand for premium and sustainable packaging, innovations in lightweight materials, and digital engagement strategies such as AR and QR-enabled packaging.
The top 5 countries driving the development of the Cider Packaging Market are the USA, UK, Germany, France, and Australia.
Explore Similar Insights
Thank you!
You will receive an email from our Business Development Manager. Please be sure to check your SPAM/JUNK folder too.