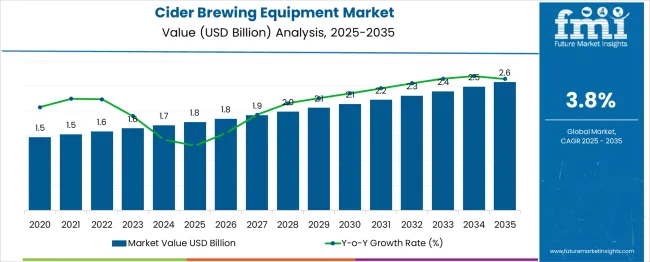
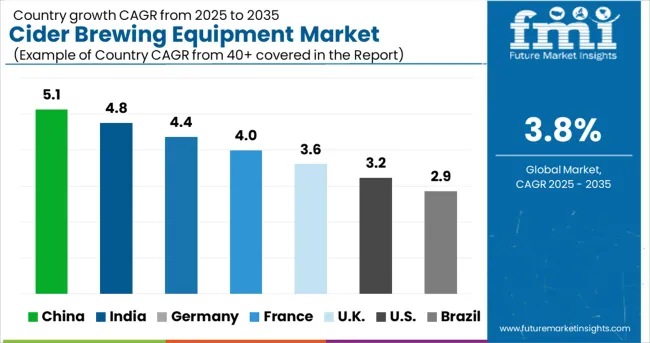
The Cider Brewing Equipment Market is estimated to be valued at USD 1.8 billion in 2025 and is projected to reach USD 2.6 billion by 2035, registering a compound annual growth rate (CAGR) of 3.8% over the forecast period.
The cider brewing equipment market is witnessing progressive growth as craft and industrial cider production continues to expand globally. Rising consumer interest in premium and artisanal ciders has encouraged breweries to upgrade and invest in advanced brewing systems.
Emphasis on quality control, production efficiency, and consistency has further accelerated demand for innovative equipment that meets both small scale craft and high volume industrial needs. Future growth is expected to be driven by technological advancements in automation, energy efficient systems, and modular designs that allow scalability and cost optimization.
Regulatory focus on hygiene, traceability, and sustainability in beverage production is also shaping equipment choices. Increasing collaborations between equipment manufacturers and cider producers are paving the way for more customized and efficient solutions to cater to diverse production requirements.
The market is segmented by Product Type, Category, Automation, and End-use Industry and region. By Product Type, the market is divided into Fermentation Unit, BrewHouse Unit, Filtration System, Maturation Unit, and Others (Milling unit, Malting, Tank pump, etc.). In terms of Category, the market is classified into Macro/ Industrial Brewery and Nano /Micro Brewery.
Based on Automation, the market is segmented into Automatic, Manual, and Semi-Automatic. By End-use Industry, the market is divided into Commercial and Industrial. Regionally, the market is classified into North America, Latin America, Western Europe, Eastern Europe, Balkan & Baltic Countries, Russia & Belarus, Central Asia, East Asia, South Asia & Pacific, and the Middle East & Africa.
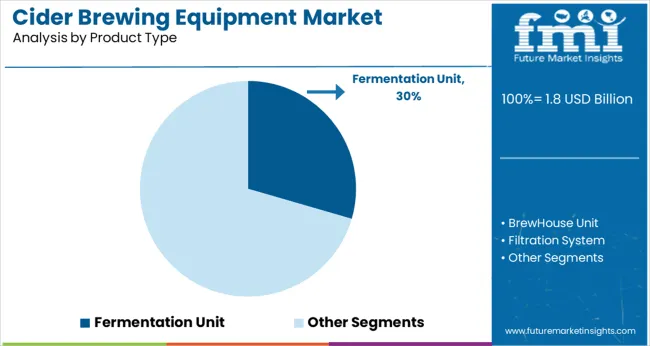
When segmented by product type the fermentation unit is anticipated to hold 29.5% of the total market revenue in 2025 positioning itself as the leading product type. This dominance has been supported by the critical role fermentation units play in determining the quality flavor profile and alcohol content of cider.
Breweries have increasingly prioritized investment in advanced fermentation systems that offer precise temperature control sanitation features and durability. The ability of modern fermentation units to maintain optimal conditions and reduce batch variability has significantly improved production efficiency and product consistency.
Modular designs allowing easy maintenance and scalability have also enhanced their appeal especially in facilities where flexibility is paramount. The prominence of this segment reflects its indispensable function in the cider brewing process and its direct impact on final product quality.
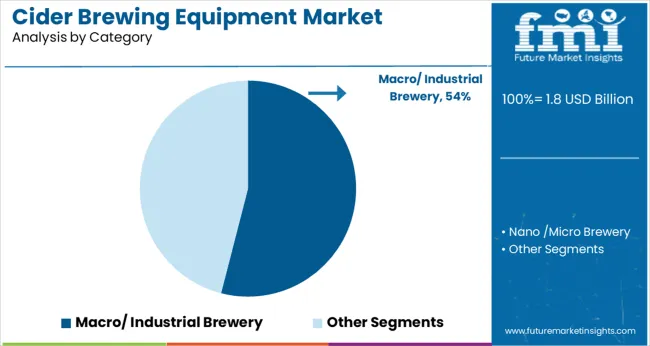
Segmented by category the macro industrial brewery segment is projected to account for 54.0% of the market revenue in 2025 maintaining its leading share. This has been attributed to the high production capacities and expansive distribution networks of industrial scale cider producers who require large scale equipment to meet global demand.
The ability to negotiate volume procurement of advanced brewing systems and integrate sophisticated automation and monitoring technologies has reinforced their leadership. These breweries have also been more responsive to regulatory and sustainability pressures adopting energy efficient and hygienic equipment to align with corporate and environmental goals.
Furthermore their financial capacity to invest in comprehensive brewing lines and optimize operational efficiency has strengthened their position as the primary adopters of cutting edge cider brewing equipment.
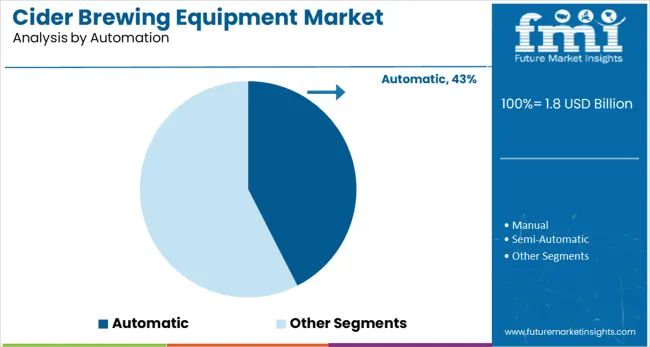
When segmented by automation the automatic segment is expected to capture 42.5% of the total market revenue in 2025 securing its position as the dominant automation mode. This leadership has been driven by the need for consistency productivity and reduced labor dependency in cider production processes.
Automatic brewing systems have enabled producers to streamline operations ensure uniformity across batches and enhance output with minimal human intervention. Integration of programmable controls sensors and real time monitoring capabilities has minimized errors and improved resource utilization.
Additionally the growing emphasis on hygiene and regulatory compliance has further propelled the adoption of fully automated systems that can deliver consistent high quality production while meeting stringent standards. The automatic segment’s growth reflects the industry’s shift toward efficiency precision and scalability in cider brewing operations.
The expert analysts at FMI have analyzed that there is a rising trend of beer culture, which is expected to revamp the landscape of cider brewing equipment in the long run. A surge in the number of brewpubs and microbreweries is estimated to positively influence the demand for cider brewing equipment.
Customers across the globe prefer artisanal and handcrafted beer instead of traditional brews or other distilled liquors, which is further fueling the demand for cider brewing equipment in these breweries. Furthermore, the growing popularity of the beer culture in the food and beverage industry is attracting investments from major manufacturers across the world and is estimated to fuel the growth of the market during the projection period.
| Attributes | Details |
|---|---|
| The market size value in 2025 | USD 1,648.4 million |
| Market forecast value in 2035 | USD 2,393.5 million |
| Forecast period | 2025 to 2035 |
| Global growth rate (CAGR) | 3.8% |
| Share of Germany in The Cider brewing equipment Market | 22.8% |
After analyzing the market in-depth, the experts of FMI have unveiled that the cider brewing machine market has been witnessing an unprecedented surge in the past few years. There is an approximate rise of USD 1.8 million surge in the total market value from 2025 to 2025. The market during the period 2020 to 2025 registered a CAGR of 3.3%.
A spike in the market share of cider brewing equipment has been witnessed in recent years, owing to the rising demand for cider consumption. The health-conscious population across developing economies, with their rising per-capita income, is increasingly spending on beverages that have a low-calorie count and the presence of a significant number of antioxidants, which is further propelling the need for adopting cider brewing equipment in the concerned end-use industry.
Furthermore, the urban population is showing interest in distinctive flavors of ciders and other beers, which is raising the market shares for craft breweries across the developing regions and is also expected to fuel the demand for cider brewing equipment through the forecast period.
Macro Brewery Equipment - By Type
It has been analyzed by Future Market Insights that the macro brewery equipment by product type category is likely to hold the maximum number of shares through the projection period. This segment accounted for a market share of 53.4% in the base year and is anticipated to continue its lead over the forecast period. The gaining prominence of this equipment across the industry can be attributed to:
The fermentation equipment is anticipated to expand at the highest CAGR of 5.9% over the forecast period. The availability of superior quality fermentation equipment, coupled with a frequent need to change this equipment owing to its constant usage, is anticipated to drive the product demand over the forecast period.
Automatic Cider Brewing Equipment - By Mode of Operation
The experts at FMI after an in-depth analysis of the market have revealed that automatic cider brewing equipment led the operation type category during the period 2020 to 2025. This segment accounted for a market share of 52.4% during 2025 over the semi-automatic and manual operation type cider brewing equipment. This segment is gaining adoption amongst pubs and other breweries owing to the factors like:
The macro brewery end-use segment led the market and accounted for 53.4% share of the global revenue in 2025, and is expected to upkeep its domineering shares in the foreseen years.
| Country | Germany |
|---|---|
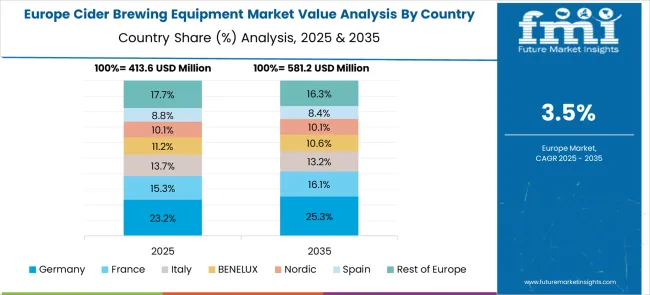
| Statistics | The European cider brewing equipment market is projected to hold the maximum shares during the period 2025 to 2035, with Germany as the leading country. Germany is currently accountable for a market share of 22.8% in 2025, with a total of 48.2% market share held by Europe. |
| Growth Propellants | The factors attributing to the growth of the cider brewing equipment market in Germany are:
|
| Country | United States |
|---|---|
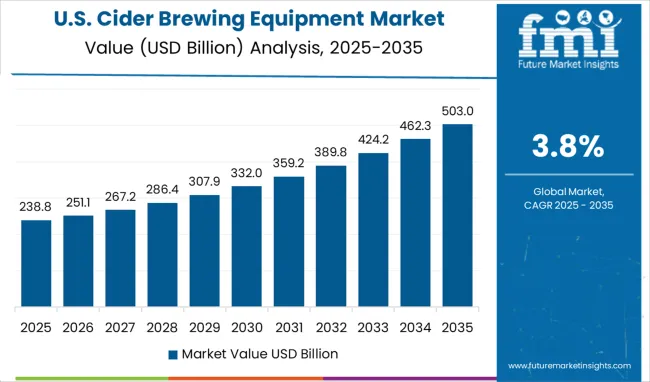
| Statistics | The North American region is expected to hold the second-largest share of the global cider brewing equipment market. The USA has emerged as the leading country for this region with a 4% surge in the volume of cider production in the current year from 2025. Craft production was responsible for 25.2% of the total product retail market in 2025, which has significantly aided the overall market growth for cider brewing equipment. |
| Growth Propellants | The key demand drivers identified in the USA cider brewing equipment market are:
|
| Country | Japan |
|---|---|
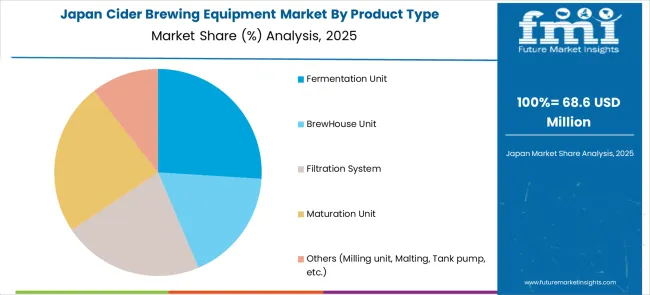
| Statistics | The Japanese cider market was valued at USD 1,633.6 Million in the year 2025, and the market is expected to propel at a substantial rate through the forecast period. |
| Growth Propellants | The factors fueling the growth of the market in Japan are:
|
| Country | Korea |
|---|---|
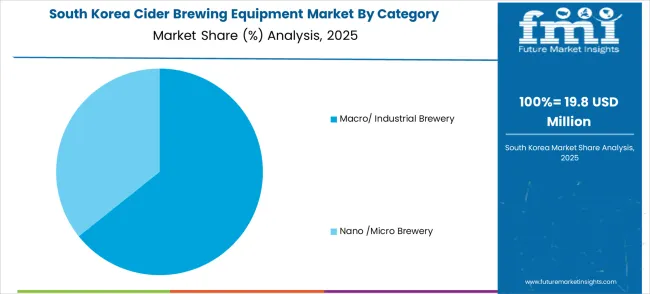
| Statistics | The Korean cider brewing equipment market is projected to have steady growth over the forecast period. The beer segment is expected to register a CAGR of 6% during the forecast period. |
| Growth Propellants | The market propellants identified are:
|
Initiatives by New Entrants Reshape the Landscape of the Cider Brewing Equipment Market
The new entrants in the cider brewing equipment market are leveraging advancements in technology to launch new products and gain a competitive advantage. These firms are continually investing in research and development activities to keep themselves in tandem with the changing consumer preferences and end-use industry demands. Efforts are being made to strengthen their foothold in the forum and aid the further progression of the cider brewing equipment market.
Top Start-ups to Watch For
Table Tap is the first company worldwide to market and sells self-service cider technology. Responsible for the launch and proliferation of the Pour Your Own Cider movement in the United States and its approval by alcohol authorities in almost all 50 states. Their goal is to continually innovate and automate hospitality operations to improve the bottom line while simultaneously providing the most interactive and engaging experiences to the consumer that bring them back time and time again.
Diageo launched its cider brand Tusker in Kenya to benefit from the surge in demand, particularly from affluent young consumers, who are expected to drink more compared to others, thereby fueling the demand for cider brewing equipment across the globe.
Key Players and their Attempts to Revolutionize the Market
This statistical study conducted by Future Market Insights of the concerned equipment market encompasses successful business strategies deployed by the key vendors for cider brewing. The cider brewing equipment market is fragmented and the vendors are deploying organic and inorganic growth strategies to compete in the market.
The manufacturers are heavily investing in research and development activities to make technological advances in the machinery for giving better quality ciders to the consumers that are loaded with antioxidants and vitamins that regulate the absorption of sugar, promote eyesight, and others. The key manufacturers of cider brewing equipment are entering into strategic collaborations and partnerships to further strengthen their foothold in the market.
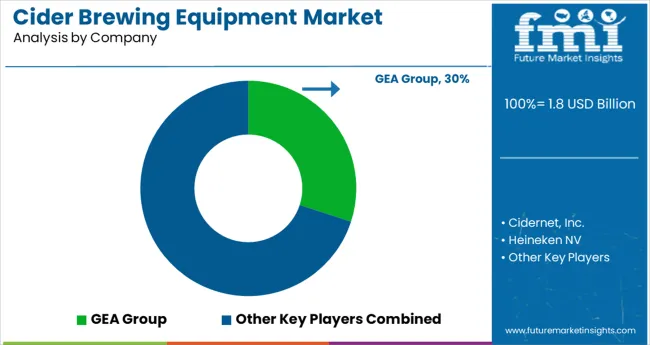
Cidernet, Inc. is the largest manufacturer of cider brewing equipment, with a market share of 40%. The company offers a wide range of products, including fermentation tanks, presses, and filtration systems. Heineken NV is the second largest manufacturer with a market share of 20%. The company offers a variety of cider brewing equipment, including fermentation tanks and presses. Anheuser-Busch InBev SA/NV is the third largest manufacturer with a market share of 10%.
Recent Developments
These are some of the major players in the market for cider brewing equipment:
The global cider brewing equipment market is estimated to be valued at USD 1.8 billion in 2025.
It is projected to reach USD 2.6 billion by 2035.
The market is expected to grow at a 3.8% CAGR between 2025 and 2035.
The key product types are fermentation unit, brewhouse unit, filtration system, maturation unit and others (milling unit, malting, tank pump, etc.).
macro/ industrial brewery segment is expected to dominate with a 54.0% industry share in 2025.


Full Research Suite comprises of:
Market outlook & trends analysis
Interviews & case studies
Strategic recommendations
Vendor profiles & capabilities analysis
5-year forecasts
8 regions and 60+ country-level data splits
Market segment data splits
12 months of continuous data updates
DELIVERED AS:
PDF EXCEL ONLINE
Cider Packaging Market Growth Trends Forecast 2025 to 2035
Cider Market Analysis by Product Type, Packaging Type, Distribution Channel and Region through 2035
Cider and Perry Market Analysis by Product Type, Trade Type, and Region through 2035
Market Share Distribution Among Cider Packaging Companies
Apple Cider Vinegar Market Analysis - Size, Share, and Forecast Outlook 2025 to 2035
Brewing Thermometer Market Size, Growth, and Forecast 2025 to 2035
Brewing Boiler Market Analysis by Material Type, Application, Automation, and Region 2025 to 2035
Brewing Supplies Market Analysis by Product Type, Application, Category, and Region Forecast Through 2035
Brewing Chiller Market Trend Analysis Based on Type, Application, End-User, and Region 2025 to 2035
Understanding Market Share Trends in Brewing Additives
Brewing Enzymes Market Growth - Fermentation Efficiency & Industry Expansion 2024 to 2034
Home Brewing Systems Market Size and Share Forecast Outlook 2025 to 2035
Beer Brewing Machine Market
Electric Brewing System Market Size and Share Forecast Outlook 2025 to 2035
Automated Brewing System Market Analysis & Forecast by Product Type, Capacity, Mechanism, and Region through 2035
Home Beer Brewing Machine Market Analysis & Forecast 2025-2035
Equipment Management Software Market Size and Share Forecast Outlook 2025 to 2035
Equipment cases market Size and Share Forecast Outlook 2025 to 2035
Farm Equipment Market Forecast and Outlook 2025 to 2035
Golf Equipment Market Size and Share Forecast Outlook 2025 to 2035

Thank you!
You will receive an email from our Business Development Manager. Please be sure to check your SPAM/JUNK folder too.
Chat With
MaRIA