Reports

- Global Locations -

Headquarters

Future Market Insights, Inc.

Christiana Corporate, 200
Continental Drive, Suite 401,
Newark, Delaware - 19713,
United States

T: +1-845-579-5705

Americas

Future Market Insights, Inc.

616 Corporate Way, Suite 2-9018,
Valley Cottage, NY 10989, United States

T: +1-347-918-3531

MEA

Future Market Insights

1602-6 Jumeirah Bay X2 Tower, Plot No: JLT-PH2-X2A,
Jumeirah Lakes Towers, Dubai,
United Arab Emirates

Europe

Future Market Insights

3rd Floor, 207 Regent Street,
W1B 3HH London
United Kingdom

T: + 44 (0) 20 8123 9659
D: +44 (0) 20 3287 4268

Asia Pacific

Future Market Insights

IndiaLand Global Tech Park, Unit UG-1, Behind Grand HighStreet, Phase 1, Hinjawadi, MH, Pune – 411057, India

Electric Brewing System Market Outlook (2023 to 2033)

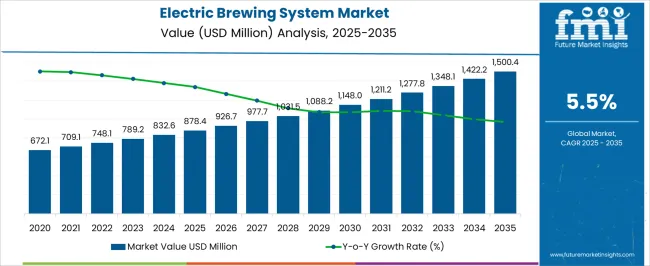
In 2023, the global electric brewing system market is poised to reach a US$ 789.2 million valuation. Over the next ten years, a considerable 5.5% CAGR is slated to surge the value of the global market to US$ 1,348.1 Million by 2033.

Electric brewing machines use electricity to heat water and create steam, which in turn, brews beer. Wattage is the most important thing to consider when choosing an electric brewing machine. The higher the wattage, the faster the machine will be able to heat water and create steam.

Electric brewing machines are devices that allow users to brew beer with electricity. There are different models and brands of electric brewing machines, but they all serve the same purpose.

Electric brewing machines are becoming increasingly popular due to their several benefits. They are much more energy-efficient than traditional brewing methods, and they also allow users to have more control over the entire brewing process. Electric brewing machines can also be used to brew both small batches and large batches of beer, making them the perfect choice for both home brewers and commercial brewers alike.

A growing shift towards craft and artisanal breweries, as well as the rising number of brewpubs and microbreweries across the globe, would bode well for the global market. The surging emphasis of beer companies on digitization and mechanization would also lead to numerous developments in automating the whole beer-making process. It is expected to push sales of electric brewing systems in the next ten years.

The increasing popularity of beer culture across the globe and growing investments by key companies are set to propel the beer brewing equipment industry in the forecast period. The emergence of new brewing systems designed to monitor the entire process in large, medium, and small-scale beer processing units is another crucial factor driving the market.

In November 2022, for instance, Abstrax, which is a leading producer of botanically-derived and cannabis terpenes, introduced its new Hop Profile Master Kit. The kit offers brewers access to around 12 of the most important hop varietals from around the globe.

They will be able to accelerate everything- right from beyond beer products such as spirits, seltzers, malt-based beverages, and wine to beer. Such new kit launches would help the global market to elevate in the forecast period.

Attributes Key Insights
Global Electric Brewing System Market Estimated Size (2023E) US$ 789.2 Million
Projected Market Valuation (2033F) US$ 1,348.1 Million
Value-based CAGR (2023 to 2033) 5.5%
Market Share of the U.S. 34.7%

Don't pay for what you don't need

Customize your report by selecting specific countries or regions and save 30%!

2018 to 2022 Electric Brewing System Market Outlook Compared to 2023 to 2033 Demand Forecast

The global market for electric brewing systems is primarily set to be fueled by the rising emphasis of beer manufacturers on equipment use and virtual installation to maintain & improve efficiency. Expansion of the brewery industry is also expected to increase demand for such products.

Severe growth forecasts are expected to limit industry opportunities for new entrants in the next ten years. High costs and initial design setup are also likely to be significant impediments to sales of brewery equipment such as electric brewing systems.

Comparative Analysis of Adjacent Electric Brewing System Markets

Electric Brewing System Market:

Differentiating Aspects Electric Brewing System Market
CAGR from 2023 to 2033 5.5%
Current Valuation in 2023 US$ 789.2 Million
Projected Valuation in 2033 US$ 1,348.1 Million
Demand Drivers
  •  The growing use of thermometers and hydrometers with the industrial revolution is set to surge the quality and efficiency of homemade beer, thereby propelling sales.
  • Rising inclination towards homemade beer from fruit juices for fun & leisure, especially in the Asia Pacific and the Middle East would push sales.

Wine Fermentation Equipment Market:

Differentiating Aspects Wine Fermentation Equipment Market
CAGR from 2023 to 2033 4.0%
Current Valuation in 2023 US$ 1,468.2 Million
Projected Valuation in 2033 US$ 2,173.3 Million
Demand Drivers
  • Surging adoption of robotics and automation such as temperature controls, automated packaging, and winery motion mechanical equipment would drive sales.
  • The rising availability of wines through food retailers and online portals, besides bars and restaurants, would aid demand.

Beer Glass Chillers Market:

Differentiating Aspects Beer Glass Chillers Market
CAGR in 2023-2033 5.5%
Current Valuation in 2023 US$ 1,462.2 Million
Projected Valuation in 2033 US$ 2,497.6 Million
Demand Drivers
  • An increasing number of recreational and leisure activities with an ongoing trend for wanderlust in developed countries is set to push demand.
  • The emergence of personalized and sophisticated beer chillers that provide promotive texts to the outer layer would create new growth opportunities in the market.
Nandini Roy Choudhury

Principal Consultant

Talk to Analyst

Find your sweet spots for generating winning opportunities in this market.

Top Trends Pushing Demand for Electric Brewing Systems Worldwide

  • “Need to Produce Small Batches of Beer to Bolster Sales of Electric Brewing Systems”

Increasing demand for home brewing kits for the purpose of brewing a small batch of beer, which would not be otherwise possible without these kits is likely to propel sales in the global market. Commercially available beer is extensively produced in large-scale factories that require sophisticated machinery and huge investments.

Thus, home brewing is gaining traction globally as it is considered a valid option to produce a small batch for limited consumption. However, difficulty in finding specific ingredients required for home brewing such as extracts, yeast, hops, and malts may hamper sales of electric brewing systems worldwide.
Country-wise Insights

Why Are Sales of Electric Brewing Systems Surging Exponentially in the US?

“Rising Popularity of Home Brewing in the US to Propel Sales of Electric Brewing Kits”

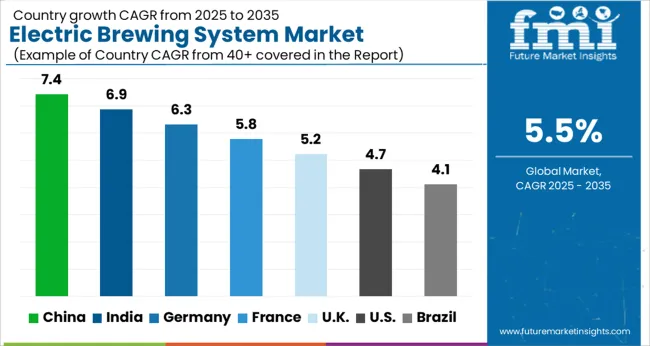
The US electric brewing system market is projected to overgrow at a share of over 34.7% in 2022, according to a new report by FMI. Major factors driving the market include rising demand for energy-efficient & eco-friendly brewing systems, the growing popularity of home brewing, and increasing disposable income.

However, the high cost of electric brewing systems is expected to restrain the market over the forecast period. Moreover, the availability of alternative products such as brewing systems running on propane and natural gas is likely to challenge the market in the next ten years.

The US electric brewing system market is highly competitive with several large- and small-scale players operating in the country. Some of the key players in the market are New Belgium Brewing Company, Inc., Stone Brewing Co., and Sierra Nevada Brewing Co. among others.

How Are Germany-based Electric Brewing System Producers Progressing?

“German Beer Brewing Kit Manufacturers Plan on Targeting Home Brewers and Commercial Breweries”

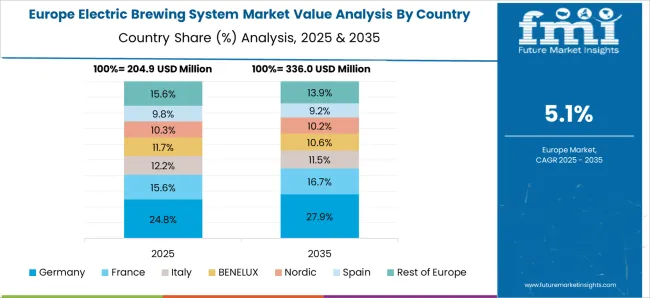
In recent years, Germany has been the driving force behind growth in the Europe electric brewing system market. German manufacturers have captured a large share of this market due to their ability to offer innovatively designed, superior-quality products.

As the dominant producer of electric brewing systems across Europe, Germany has been able to control the market in terms of both sales and production in the last few years. In 2016, German manufacturers accounted for over 50% of all electric brewing system sales in Europe.

This figure is expected to surge in the next ten years as more consumers switch to electric brewing systems due to their ease of use and high energy efficiency. German manufacturers have also been able to successfully promote their products through unique marketing campaigns through social media platforms. In the future, such movements are anticipated to target both home brewers and commercial breweries, thereby resulting in a significant increase in terms of sales.

Why is the Demand for Electric Brewing Systems Surging Rapidly across India?

“Indian Beverage Companies to Premiumize their Beers and Create High Demand for Electric Brewing Controllers”

In Asia Pacific, India is set to be the leading country in terms of growth in the electric brewing systems industry. High demand for beer among millennials and gen z with increasing disposable income and changing lifestyles is expected to drive sales in India.

Moreover, the country’s beer industry is extremely consolidated with a few key players. United Breweries Limited (UBL), for instance, is considered one of the prominent firms in the beer sector, with a leading brand named Kingfisher. Under its Kingfisher brand, UBL distributes around eight products appealing to multiple beverage preferences and price points- right from mild to strong.

The company also unveiled premium products such as Kingfisher Buzz and Ultra Max. Thus, the launch of such innovative products by leading Indian beer makers is anticipated to expand the premium category, thereby propelling sales of electric brewing systems.

Get the data you need at a Fraction of the cost

Personalize your report by choosing insights you need
and save 40%!

Category-wise Insights

Which is the Leading Application of Electric Brewing Systems Worldwide?

“Sales of Electric Home Brewing Systems to Skyrocket with Launch of Innovative Features”

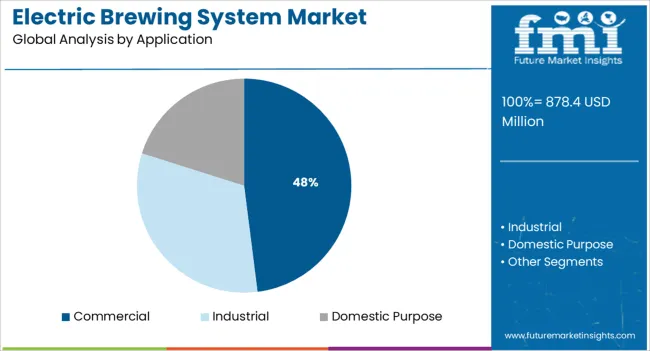
Based on application, the domestic purpose segment is estimated to generate the largest share of the market for electric brewing systems throughout the forecast period. Easy availability of various types of home brewing kits through e-commerce websites and retail shops is likely to drive the segment.

Need to experience the feeling of home brewing, freedom to adjust traditional recipes, unavailability of various types of beer in local markets, and the expensive nature of commercially available beer are some of the common factors pushing consumers towards home brewing practices.

In June 2022, for instance, Spinn, a hardware and electronics manufacturing company based in California, introduced the new cold brew feature for its existing brewing system. The new feature would allow coffee enthusiasts to develop innovative cold brews in less than 60 seconds. The novel feature can be used by users by updating their Spinn app. Therefore, similar product launches would enable key companies to expand their portfolios and increase sales of home brewing kits.
Competitive Landscape

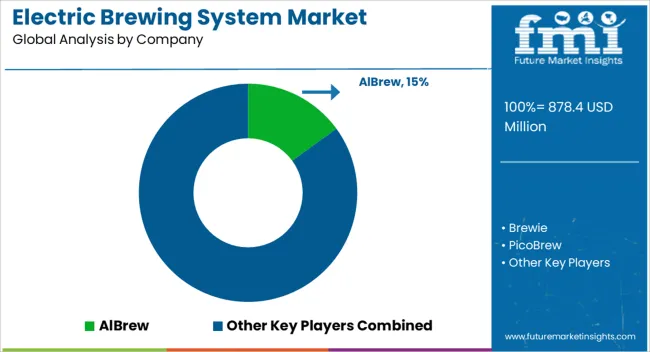
Some of the key players in the global electric brewing system market include AlBrew, Alfa Laval, Brewie, PicoBrew, Della Taffola, Krones, Paul Mueller, GEA Group, Meura, Shandong Eagle Machinery Co., Lehui, Ziemann, and XIMO among others.

Renowned companies in the market are focusing on expanding their positioning by investing huge sums in new product launches. They are also joining hands with local firms to co-develop new technologies or devices. A few other companies are aiming to engage in joint ventures to provide better after-sales service to their clients.

For instance,

  • In November 2022, SABCO BrewMagic, a provider of high-quality brewing systems, launched its innovative BrewMagic Presto brewing system. It is mainly designed for home brewing and complements the company’s existing brewing system line-up. It is considered to be the most flexible, lowest priced, most transportable, and most versatile system for home brewing.

Scope of the Report

Attribute Details
Estimated Market Size (2023) US$ 789.2 Million
Projected Market Valuation (2033) US$ 1,348.1 Million
Value-based CAGR (2023 to 2033) 5.5%
Forecast Period 2023 to 2033
Historical Data Available for 2018 to 2022
Market Analysis Value (US$ Million)
Key Regions Covered
  • North America
  • Latin America
  • Europe
  • Asia Pacific
  • Oceania
  • Middle East & Africa (MEA)
Key Countries Covered
  • The US
  • Canada
  • Mexico
  • Germany
  • The UK
  • France
  • Italy
  • Spain
  • China
  • Japan
  • India
  • South Korea
  • Australia
  • Brazil
  • Argentina
  • South Africa
  • UAE
Key Segments Covered
  • Operating Type
  • Application
  • Material Type
  • Region
Key Companies Profiled
  • AlBrew
  • Alfa Laval
  • Brewie
  • PicoBrew
  • Della Taffola
  • Krones
  • Paul Mueller
  • GEA Group
  • Meura
  • Shandong Eagle Machinery Co.
  • Lehui
  • Ziemann
  • XIMO
Report Coverage Market Forecast, Company Share Analysis, Competitive Landscape, DROT Analysis, Market Dynamics and Challenges, and Strategic Growth Initiatives

Electric Brewing System Market Outlook by Category

By Operating Type:

  • Semi-Automated
  • Automated

By Application:

  • Commercial
  • Industrial
  • Domestic Purpose

By Material Type:

  • Polycarbonate
  • Steel

By Region:

  • North America
  • Latin America
  • Europe
  • East Asia
  • South Asia
  • Oceania
  • Middle East & Africa (MEA)

Frequently Asked Questions

How big is the electric brewing system industry?

The electric brewing system industry is expected to be valued at US$ 789.2 Million by 2023.

At what rate is the electric brewing system industry expected to rise?

The electric brewing system industry is expected to rise at a CAGR of 5.5% during the forecast period.

What is the North America electric brewing system demand outlook?

The North America electric brewing system industry is expected to register a 38% CAGR between 2023 and 2033.

Which are the major countries driving demand for electric brewing systems?

The U.S., China, Canada, Germany, and Mexico are the major countries driving demand for electric brewing systems.

At what rate will the China electric brewing system industry grow?

The China electric brewing system industry is projected to grow at a CAGR of 5.7% during the evaluation period.

At what rate will the UK electric brewing system industry grow?

The UK electric brewing system industry is projected to grow at a CAGR of 6.1% in the forecast period.

At what rate will the India electric brewing system sector grow?

The Indian electric brewing system sector is projected to grow at a CAGR of 6.2% in the assessment period.

At what rate will the electric brewing system demand grow in Europe?

Demand for electric brewing systems in Europe is expected to grow at 34.7% by the end of 2023.

At what rate will the electric brewing system demand grow in Japan?

Demand for electric brewing systems in Japan is expected to grow at 6.7% CAGR by 2023.

At what rate will the electric brewing system demand grow in Australia?

Demand for electric brewing systems in Australia is expected to grow at a CAGR of 3.0% in 2023.

What is the demand outlook forecast for the electric brewing system industry?

The global electric brewing system industry is expected to surpass US$ 1,348.1 Million by the end of 2033.

Table of Content

1. Executive Summary | Electric Brewing System Market

    1.1. Global Market Outlook

    1.2. Demand-side Trends

    1.3. Supply-side Trends

    1.4. Technology Roadmap Analysis

    1.5. Analysis and Recommendations

2. Market Overview

    2.1. Market Coverage / Taxonomy

    2.2. Market Definition / Scope / Limitations

3. Market Background

    3.1. Market Dynamics

        3.1.1. Drivers

        3.1.2. Restraints

        3.1.3. Opportunity

        3.1.4. Trends

    3.2. Scenario Forecast

        3.2.1. Demand in Optimistic Scenario

        3.2.2. Demand in Likely Scenario

        3.2.3. Demand in Conservative Scenario

    3.3. Product launches & Recent Developments

    3.4. Product Life Cycle Analysis

    3.5. Value Chain Analysis

        3.5.1. Supply Side Participants and their Roles

            3.5.1.1. Producers

            3.5.1.2. Mid-Level Participants (Traders / Agents / Brokers)

            3.5.1.3. Wholesalers and Distributors

        3.5.2. % of Operating Margin Analysis

        3.5.3. List of Raw Material Suppliers

        3.5.4. List of Existing and Potential Buyers

    3.6. Global Market- Pricing Analysis

        3.6.1. Price Point Assessment by Region

        3.6.2. Price Point Assessment by Product Type

        3.6.3. Price Forecast till 2033

        3.6.4. Factors affecting pricing

    3.7. Forecast Factors - Relevance & Impact

    3.8. PESTLE and Porter’s Analysis

    3.9. Regulatory Landscape

        3.9.1. Packaging & Labelling Regulations

        3.9.2. Certifications and Certifying Agency Overview

        3.9.3. Import/Export Policies

    3.10. Regional Parent Market Outlook

    3.11. Production and Consumption Statistics

    3.12. Import and Export Statistics

    3.13. Consumers Survey Analysis

    3.14. Macro-Economic Factors

    3.15. Product Claims & Nutritional Information scanned by Buyers

4. Global Market Analysis 2018 to 2022 and Forecast, 2023 to 2033

    4.1. Historical Market Size Value (US$ Million) & Volume (MT) Analysis, 2018 to 2022

    4.2. Current and Future Market Size Value (US$ Million) & Volume (MT) Projections, 2023 to 2033

        4.2.1. Y-o-Y Growth Trend Analysis

        4.2.2. Absolute $ Opportunity Analysis

5. Global Market Analysis 2018 to 2022 and Forecast 2023 to 2033, By Material Type

    5.1. Introduction / Key Findings

    5.2. Historical Market Size Value (US$ Million) & Volume (MT) Analysis By Material Type, 2018 to 2022

    5.3. Current and Future Market Size Value (US$ Million) & Volume (MT) Analysis and Forecast By Material Type, 2023 to 2033

        5.3.1. Polycarbonate

        5.3.2. Steel

    5.4. Y-o-Y Growth Trend Analysis By Material Type, 2018 to 2022

    5.5. Absolute $ Opportunity Analysis By Material Type, 2023 to 2033

6. Global Market Analysis 2018 to 2022 and Forecast 2023 to 2033, By Application 

    6.1. Introduction / Key Findings

    6.2. Historical Market Size Value (US$ Million) & Volume (MT) Analysis By Application, 2018 to 2022

    6.3. Current and Future Market Size Value (US$ Million) & Volume (MT) Analysis and Forecast By Application, 2023 to 2033

        6.3.1. Commercial

        6.3.2. Industrial

        6.3.3. Domestic Purpose

    6.4. Y-o-Y Growth Trend Analysis By Application, 2018 to 2022

    6.5. Absolute $ Opportunity Analysis By Application, 2023 to 2033

7. Global Market Analysis 2018 to 2022 and Forecast 2023 to 2033, By Operating Type

    7.1. Introduction / Key Findings

    7.2. Historical Market Size Value (US$ Million) & Volume (MT) Analysis By Operating type, 2018 to 2022

    7.3. Current and Future Market Size Value (US$ Million) & Volume (MT) Analysis and Forecast By Operating type, 2023 to 2033

        7.3.1. Semi-automated

        7.3.2. Automated

    7.4. Y-o-Y Growth Trend Analysis By Operating type, 2018 to 2022

    7.5. Absolute $ Opportunity Analysis By Operating type, 2023 to 2033

8. Global Market Analysis 2018 to 2022 and Forecast 2023 to 2033, By Region

    8.1. Introduction

    8.2. Historical Market Size Value (US$ Million) & Volume (MT) Analysis By Region, 2018 to 2022

    8.3. Current Market Size Value (US$ Million) & Volume (MT) Analysis and Forecast By Region, 2023 to 2033

        8.3.1. North America

        8.3.2. Latin America

        8.3.3. Europe

        8.3.4. East Asia

        8.3.5. South Asia

        8.3.6. Oceania

        8.3.7. Middle East & Africa (MEA)

    8.4. Market Attractiveness Analysis By Region

9. North America Market Analysis 2018 to 2022 and Forecast 2023 to 2033, By Country

    9.1. Historical Market Size Value (US$ Million) & Volume (MT) Trend Analysis By Market Taxonomy, 2018 to 2022

    9.2. Market Size Value (US$ Million) & Volume (MT) Forecast By Market Taxonomy, 2023 to 2033

        9.2.1. By Country

            9.2.1.1. The US

            9.2.1.2. Canada

        9.2.2. By Material Type

        9.2.3. By Application

        9.2.4. By Operating type

    9.3. Market Attractiveness Analysis

        9.3.1. By Country

        9.3.2. By Material Type

        9.3.3. By Application

        9.3.4. By Operating type

    9.4. Key Takeaways

10. Latin America Market Analysis 2018 to 2022 and Forecast 2023 to 2033, By Country

    10.1. Historical Market Size Value (US$ Million) & Volume (MT) Trend Analysis By Market Taxonomy, 2018 to 2022

    10.2. Market Size Value (US$ Million) & Volume (MT) Forecast By Market Taxonomy, 2023 to 2033

        10.2.1. By Country

            10.2.1.1. Brazil

            10.2.1.2. Mexico

            10.2.1.3. Argentina

            10.2.1.4. Chile

            10.2.1.5. Peru

            10.2.1.6. Rest of Latin America

        10.2.2. By Material Type

        10.2.3. By Application

        10.2.4. By Operating type

    10.3. Market Attractiveness Analysis

        10.3.1. By Country

        10.3.2. By Material Type

        10.3.3. By Application

        10.3.4. By Operating type

    10.4. Key Takeaways

11. Europe Market Analysis 2018 to 2022 and Forecast 2023 to 2033, By Country

    11.1. Historical Market Size Value (US$ Million) & Volume (MT) Trend Analysis By Market Taxonomy, 2018 to 2022

    11.2. Market Size Value (US$ Million) & Volume (MT) Forecast By Market Taxonomy, 2023 to 2033

        11.2.1. By Country

            11.2.1.1. Germany

            11.2.1.2. Italy

            11.2.1.3. France

            11.2.1.4. The UK

            11.2.1.5. Spain

            11.2.1.6. Russia

            11.2.1.7. BENELUX

            11.2.1.8. Poland

            11.2.1.9. Nordic Countries

            11.2.1.10. Rest of Europe

        11.2.2. By Material Type

        11.2.3. By Application

        11.2.4. By Operating type

    11.3. Market Attractiveness Analysis

        11.3.1. By Country

        11.3.2. By Material Type

        11.3.3. By Application

        11.3.4. By Operating type

    11.4. Key Takeaways

12. East Asia Market Analysis 2018 to 2022 and Forecast 2023 to 2033, By Country

    12.1. Historical Market Size Value (US$ Million) & Volume (MT) Trend Analysis By Market Taxonomy, 2018 to 2022

    12.2. Market Size Value (US$ Million) & Volume (MT) Forecast By Market Taxonomy, 2023 to 2033

        12.2.1. By Country

            12.2.1.1. China

            12.2.1.2. Japan

            12.2.1.3. South Korea

        12.2.2. By Material Type

        12.2.3. By Application

        12.2.4. By Operating type

    12.3. Market Attractiveness Analysis

        12.3.1. By Country

        12.3.2. By Material Type

        12.3.3. By Application

        12.3.4. By Operating type

    12.4. Key Takeaways

13. South Asia Market Analysis 2018 to 2022 and Forecast 2023 to 2033, By Country

    13.1. Historical Market Size Value (US$ Million) & Volume (MT) Trend Analysis By Market Taxonomy, 2018 to 2022

    13.2. Market Size Value (US$ Million) & Volume (MT) Forecast By Market Taxonomy, 2023 to 2033

        13.2.1. By Country

            13.2.1.1. India

            13.2.1.2. Thailand

            13.2.1.3. Malaysia

            13.2.1.4. Indonesia

            13.2.1.5. Singapore

            13.2.1.6. Rest of South Asia

        13.2.2. By Material Type

        13.2.3. By Application

        13.2.4. By Operating type

    13.3. Market Attractiveness Analysis

        13.3.1. By Country

        13.3.2. By Material Type

        13.3.3. By Application

        13.3.4. By Operating type

    13.4. Key Takeaways

14. Oceania Market Analysis 2018 to 2022 and Forecast 2023 to 2033, By Country

    14.1. Historical Market Size Value (US$ Million) & Volume (MT) Trend Analysis By Market Taxonomy, 2018 to 2022

    14.2. Market Size Value (US$ Million) & Volume (MT) Forecast By Market Taxonomy, 2023 to 2033

        14.2.1. By Country

            14.2.1.1. Australia

            14.2.1.2. New Zealand

        14.2.2. By Material Type

        14.2.3. By Application

        14.2.4. By Operating type

    14.3. Market Attractiveness Analysis

        14.3.1. By Country

        14.3.2. By Material Type

        14.3.3. By Application

        14.3.4. By Operating type

    14.4. Key Takeaways

15. MEA Market Analysis 2018 to 2022 and Forecast 2023 to 2033, By Country

    15.1. Historical Market Size Value (US$ Million) & Volume (MT) Trend Analysis By Market Taxonomy, 2018 to 2022

    15.2. Market Size Value (US$ Million) & Volume (MT) Forecast By Market Taxonomy, 2023 to 2033

        15.2.1. By Country

            15.2.1.1. GCC Countries

            15.2.1.2. South Africa

            15.2.1.3. Central Africa

            15.2.1.4. North Africa

        15.2.2. By Material Type

        15.2.3. By Application

        15.2.4. By Operating type

    15.3. Market Attractiveness Analysis

        15.3.1. By Country

        15.3.2. By Material Type

        15.3.3. By Application

        15.3.4. By Operating type

    15.4. Key Takeaways

16. Key Countries Market Analysis

    16.1. The US

        16.1.1. Pricing Analysis

        16.1.2. Market Share Analysis, 2022

            16.1.2.1. By Material Type

            16.1.2.2. By Application

            16.1.2.3. By Operating type

    16.2. Canada

        16.2.1. Pricing Analysis

        16.2.2. Market Share Analysis, 2022

            16.2.2.1. By Material Type

            16.2.2.2. By Application

            16.2.2.3. By Operating type

    16.3. Brazil

        16.3.1. Pricing Analysis

        16.3.2. Market Share Analysis, 2022

            16.3.2.1. By Material Type

            16.3.2.2. By Application

            16.3.2.3. By Operating type

    16.4. Mexico

        16.4.1. Pricing Analysis

        16.4.2. Market Share Analysis, 2022

            16.4.2.1. By Material Type

            16.4.2.2. By Application

            16.4.2.3. By Operating type

    16.5. Argentina

        16.5.1. Pricing Analysis

        16.5.2. Market Share Analysis, 2022

            16.5.2.1. By Material Type

            16.5.2.2. By Application

            16.5.2.3. By Operating type

    16.6. Chile

        16.6.1. Pricing Analysis

        16.6.2. Market Share Analysis, 2022

            16.6.2.1. By Material Type

            16.6.2.2. By Application

            16.6.2.3. By Operating type

    16.7. Peru

        16.7.1. Pricing Analysis

        16.7.2. Market Share Analysis, 2022

            16.7.2.1. By Material Type

            16.7.2.2. By Application

            16.7.2.3. By Operating type

    16.8. Germany

        16.8.1. Pricing Analysis

        16.8.2. Market Share Analysis, 2022

            16.8.2.1. By Material Type

            16.8.2.2. By Application

            16.8.2.3. By Operating type

    16.9. Italy

        16.9.1. Pricing Analysis

        16.9.2. Market Share Analysis, 2022

            16.9.2.1. By Material Type

            16.9.2.2. By Application

            16.9.2.3. By Operating type

    16.10. France

        16.10.1. Pricing Analysis

        16.10.2. Market Share Analysis, 2022

            16.10.2.1. By Material Type

            16.10.2.2. By Application

            16.10.2.3. By Operating type

    16.11. Spain

        16.11.1. Pricing Analysis

        16.11.2. Market Share Analysis, 2022

            16.11.2.1. By Material Type

            16.11.2.2. By Application

            16.11.2.3. By Operating type

    16.12. U.K.

        16.12.1. Pricing Analysis

        16.12.2. Market Share Analysis, 2022

            16.12.2.1. By Material Type

            16.12.2.2. By Application

            16.12.2.3. By Operating type

    16.13. Russia

        16.13.1. Pricing Analysis

        16.13.2. Market Share Analysis, 2022

            16.13.2.1. By Material Type

            16.13.2.2. By Application

            16.13.2.3. By Operating type

    16.14. Poland

        16.14.1. Pricing Analysis

        16.14.2. Market Share Analysis, 2022

            16.14.2.1. By Material Type

            16.14.2.2. By Application

            16.14.2.3. By Operating type

    16.15. BENELUX

        16.15.1. Pricing Analysis

        16.15.2. Market Share Analysis, 2022

            16.15.2.1. By Material Type

            16.15.2.2. By Application

            16.15.2.3. By Operating type

    16.16. Nordic Countries

        16.16.1. Pricing Analysis

        16.16.2. Market Share Analysis, 2022

            16.16.2.1. By Material Type

            16.16.2.2. By Application

            16.16.2.3. By Operating type

    16.17. China

        16.17.1. Pricing Analysis

        16.17.2. Market Share Analysis, 2022

            16.17.2.1. By Material Type

            16.17.2.2. By Application

            16.17.2.3. By Operating type

    16.18. Japan

        16.18.1. Pricing Analysis

        16.18.2. Market Share Analysis, 2022

            16.18.2.1. By Material Type

            16.18.2.2. By Application

            16.18.2.3. By Operating type

    16.19. South Korea

        16.19.1. Pricing Analysis

        16.19.2. Market Share Analysis, 2022

            16.19.2.1. By Material Type

            16.19.2.2. By Application

            16.19.2.3. By Operating type

    16.20. India

        16.20.1. Pricing Analysis

        16.20.2. Market Share Analysis, 2022

            16.20.2.1. By Material Type

            16.20.2.2. By Application

            16.20.2.3. By Operating type

    16.21. Thailand

        16.21.1. Pricing Analysis

        16.21.2. Market Share Analysis, 2022

            16.21.2.1. By Material Type

            16.21.2.2. By Application

            16.21.2.3. By Operating type

    16.22. Indonesia

        16.22.1. Pricing Analysis

        16.22.2. Market Share Analysis, 2022

            16.22.2.1. By Material Type

            16.22.2.2. By Application

            16.22.2.3. By Operating type

    16.23. Malaysia

        16.23.1. Pricing Analysis

        16.23.2. Market Share Analysis, 2022

            16.23.2.1. By Material Type

            16.23.2.2. By Application

            16.23.2.3. By Operating type

    16.24. Singapore

        16.24.1. Pricing Analysis

        16.24.2. Market Share Analysis, 2022

            16.24.2.1. By Material Type

            16.24.2.2. By Application

            16.24.2.3. By Operating type

    16.25. Australia

        16.25.1. Pricing Analysis

        16.25.2. Market Share Analysis, 2022

            16.25.2.1. By Material Type

            16.25.2.2. By Application

            16.25.2.3. By Operating type

    16.26. New Zealand

        16.26.1. Pricing Analysis

        16.26.2. Market Share Analysis, 2022

            16.26.2.1. By Material Type

            16.26.2.2. By Application

            16.26.2.3. By Operating type

    16.27. GCC Countries

        16.27.1. Pricing Analysis

        16.27.2. Market Share Analysis, 2022

            16.27.2.1. By Material Type

            16.27.2.2. By Application

            16.27.2.3. By Operating type

    16.28. South Africa

        16.28.1. Pricing Analysis

        16.28.2. Market Share Analysis, 2022

            16.28.2.1. By Material Type

            16.28.2.2. By Application

            16.28.2.3. By Operating type

    16.29. North Africa

        16.29.1. Pricing Analysis

        16.29.2. Market Share Analysis, 2022

            16.29.2.1. By Material Type

            16.29.2.2. By Application

            16.29.2.3. By Operating type

    16.30. Central Africa

        16.30.1. Pricing Analysis

        16.30.2. Market Share Analysis, 2022

            16.30.2.1. By Material Type

            16.30.2.2. By Application

            16.30.2.3. By Operating type

17. Market  Structure Analysis

    17.1. Competition Dashboard

    17.2. Competition Benchmarking

    17.3. Market Share Analysis of Top Players

        17.3.1. By Regional

        17.3.2. By Material Type

        17.3.3. By Application

        17.3.4. By Operating type

18. Competition Analysis

    18.1. Competition Deep Dive

        18.1.1. AlBrew

            18.1.1.1. Overview

            18.1.1.2. Product Portfolio

            18.1.1.3. Profitability by Market Segments (Product/Age /Sales Channel/Region)

            18.1.1.4. Sales Footprint

            18.1.1.5. Strategy Overview

                18.1.1.5.1. Marketing Strategy

                18.1.1.5.2. Product Strategy

                18.1.1.5.3. Channel Strategy

        18.1.2. Alfa Laval

            18.1.2.1. Overview

            18.1.2.2. Product Portfolio

            18.1.2.3. Profitability by Market Segments (Product/Age /Sales Channel/Region)

            18.1.2.4. Sales Footprint

            18.1.2.5. Strategy Overview

                18.1.2.5.1. Marketing Strategy

                18.1.2.5.2. Product Strategy

                18.1.2.5.3. Channel Strategy

        18.1.3. Brewie

            18.1.3.1. Overview

            18.1.3.2. Product Portfolio

            18.1.3.3. Profitability by Market Segments (Product/Age /Sales Channel/Region)

            18.1.3.4. Sales Footprint

            18.1.3.5. Strategy Overview

                18.1.3.5.1. Marketing Strategy

                18.1.3.5.2. Product Strategy

                18.1.3.5.3. Channel Strategy

        18.1.4. PicoBrew

            18.1.4.1. Overview

            18.1.4.2. Product Portfolio

            18.1.4.3. Profitability by Market Segments (Product/Age /Sales Channel/Region)

            18.1.4.4. Sales Footprint

            18.1.4.5. Strategy Overview

                18.1.4.5.1. Marketing Strategy

                18.1.4.5.2. Product Strategy

                18.1.4.5.3. Channel Strategy

        18.1.5. Della Taffola

            18.1.5.1. Overview

            18.1.5.2. Product Portfolio

            18.1.5.3. Profitability by Market Segments (Product/Age /Sales Channel/Region)

            18.1.5.4. Sales Footprint

            18.1.5.5. Strategy Overview

                18.1.5.5.1. Marketing Strategy

                18.1.5.5.2. Product Strategy

                18.1.5.5.3. Channel Strategy

        18.1.6. Krones

            18.1.6.1. Overview

            18.1.6.2. Product Portfolio

            18.1.6.3. Profitability by Market Segments (Product/Age /Sales Channel/Region)

            18.1.6.4. Sales Footprint

            18.1.6.5. Strategy Overview

                18.1.6.5.1. Marketing Strategy

                18.1.6.5.2. Product Strategy

                18.1.6.5.3. Channel Strategy

        18.1.7. Paul Mueller

            18.1.7.1. Overview

            18.1.7.2. Product Portfolio

            18.1.7.3. Profitability by Market Segments (Product/Age /Sales Channel/Region)

            18.1.7.4. Sales Footprint

            18.1.7.5. Strategy Overview

                18.1.7.5.1. Marketing Strategy

                18.1.7.5.2. Product Strategy

                18.1.7.5.3. Channel Strategy

        18.1.8. GEA Group

            18.1.8.1. Overview

            18.1.8.2. Product Portfolio

            18.1.8.3. Profitability by Market Segments (Product/Age /Sales Channel/Region)

            18.1.8.4. Sales Footprint

            18.1.8.5. Strategy Overview

                18.1.8.5.1. Marketing Strategy

                18.1.8.5.2. Product Strategy

                18.1.8.5.3. Channel Strategy

        18.1.9. Meura

            18.1.9.1. Overview

            18.1.9.2. Product Portfolio

            18.1.9.3. Profitability by Market Segments (Product/Age /Sales Channel/Region)

            18.1.9.4. Sales Footprint

            18.1.9.5. Strategy Overview

                18.1.9.5.1. Marketing Strategy

                18.1.9.5.2. Product Strategy

                18.1.9.5.3. Channel Strategy

        18.1.10. Shandong Eagle Machinery Co.

            18.1.10.1. Overview

            18.1.10.2. Product Portfolio

            18.1.10.3. Profitability by Market Segments (Product/Age /Sales Channel/Region)

            18.1.10.4. Sales Footprint

            18.1.10.5. Strategy Overview

                18.1.10.5.1. Marketing Strategy

                18.1.10.5.2. Product Strategy

                18.1.10.5.3. Channel Strategy

        18.1.11. Lehui

            18.1.11.1. Overview

            18.1.11.2. Product Portfolio

            18.1.11.3. Profitability by Market Segments (Product/Age /Sales Channel/Region)

            18.1.11.4. Sales Footprint

            18.1.11.5. Strategy Overview

                18.1.11.5.1. Marketing Strategy

                18.1.11.5.2. Product Strategy

                18.1.11.5.3. Channel Strategy

        18.1.12. Ziemann

            18.1.12.1. Overview

            18.1.12.2. Product Portfolio

            18.1.12.3. Profitability by Market Segments (Product/Age /Sales Channel/Region)

            18.1.12.4. Sales Footprint

            18.1.12.5. Strategy Overview

                18.1.12.5.1. Marketing Strategy

                18.1.12.5.2. Product Strategy

                18.1.12.5.3. Channel Strategy

        18.1.13. XIMO

            18.1.13.1. Overview

            18.1.13.2. Product Portfolio

            18.1.13.3. Profitability by Market Segments (Product/Age /Sales Channel/Region)

            18.1.13.4. Sales Footprint

            18.1.13.5. Strategy Overview

                18.1.13.5.1. Marketing Strategy

                18.1.13.5.2. Product Strategy

                18.1.13.5.3. Channel Strategy

19. Assumptions & Acronyms Used

20. Research Methodology

List of Tables

Table 1: Global Market Value (US$ Million) Forecast by Region, 2018 to 2033

Table 2: Global Market Volume (MT) Forecast by Region, 2018 to 2033

Table 3: Global Market Value (US$ Million) Forecast by Product material Type, 2018 to 2033

Table 4: Global Market Volume (MT) Forecast by Product material Type, 2018 to 2033

Table 5: Global Market Value (US$ Million) Forecast by Application, 2018 to 2033

Table 6: Global Market Volume (MT) Forecast by Application, 2018 to 2033

Table 7: Global Market Value (US$ Million) Forecast by Operating type, 2018 to 2033

Table 8: Global Market Volume (MT) Forecast by Operating type, 2018 to 2033

Table 9: North America Market Value (US$ Million) Forecast by Country, 2018 to 2033

Table 10: North America Market Volume (MT) Forecast by Country, 2018 to 2033

Table 11: North America Market Value (US$ Million) Forecast by Product material Type, 2018 to 2033

Table 12: North America Market Volume (MT) Forecast by Product material Type, 2018 to 2033

Table 13: North America Market Value (US$ Million) Forecast by Application, 2018 to 2033

Table 14: North America Market Volume (MT) Forecast by Application, 2018 to 2033

Table 15: North America Market Value (US$ Million) Forecast by Operating type, 2018 to 2033

Table 16: North America Market Volume (MT) Forecast by Operating type, 2018 to 2033

Table 17: Latin America Market Value (US$ Million) Forecast by Country, 2018 to 2033

Table 18: Latin America Market Volume (MT) Forecast by Country, 2018 to 2033

Table 19: Latin America Market Value (US$ Million) Forecast by Product material Type, 2018 to 2033

Table 20: Latin America Market Volume (MT) Forecast by Product material Type, 2018 to 2033

Table 21: Latin America Market Value (US$ Million) Forecast by Application, 2018 to 2033

Table 22: Latin America Market Volume (MT) Forecast by Application, 2018 to 2033

Table 23: Latin America Market Value (US$ Million) Forecast by Operating type, 2018 to 2033

Table 24: Latin America Market Volume (MT) Forecast by Operating type, 2018 to 2033

Table 25: Europe Market Value (US$ Million) Forecast by Country, 2018 to 2033

Table 26: Europe Market Volume (MT) Forecast by Country, 2018 to 2033

Table 27: Europe Market Value (US$ Million) Forecast by Product material Type, 2018 to 2033

Table 28: Europe Market Volume (MT) Forecast by Product material Type, 2018 to 2033

Table 29: Europe Market Value (US$ Million) Forecast by Application, 2018 to 2033

Table 30: Europe Market Volume (MT) Forecast by Application, 2018 to 2033

Table 31: Europe Market Value (US$ Million) Forecast by Operating type, 2018 to 2033

Table 32: Europe Market Volume (MT) Forecast by Operating type, 2018 to 2033

Table 33: East Asia Market Value (US$ Million) Forecast by Country, 2018 to 2033

Table 34: East Asia Market Volume (MT) Forecast by Country, 2018 to 2033

Table 35: East Asia Market Value (US$ Million) Forecast by Product material Type, 2018 to 2033

Table 36: East Asia Market Volume (MT) Forecast by Product material Type, 2018 to 2033

Table 37: East Asia Market Value (US$ Million) Forecast by Application, 2018 to 2033

Table 38: East Asia Market Volume (MT) Forecast by Application, 2018 to 2033

Table 39: East Asia Market Value (US$ Million) Forecast by Operating type, 2018 to 2033

Table 40: East Asia Market Volume (MT) Forecast by Operating type, 2018 to 2033

Table 41: South Asia Market Value (US$ Million) Forecast by Country, 2018 to 2033

Table 42: South Asia Market Volume (MT) Forecast by Country, 2018 to 2033

Table 43: South Asia Market Value (US$ Million) Forecast by Product material Type, 2018 to 2033

Table 44: South Asia Market Volume (MT) Forecast by Product material Type, 2018 to 2033

Table 45: South Asia Market Value (US$ Million) Forecast by Application, 2018 to 2033

Table 46: South Asia Market Volume (MT) Forecast by Application, 2018 to 2033

Table 47: South Asia Market Value (US$ Million) Forecast by Operating type, 2018 to 2033

Table 48: South Asia Market Volume (MT) Forecast by Operating type, 2018 to 2033

Table 49: Oceania Market Value (US$ Million) Forecast by Country, 2018 to 2033

Table 50: Oceania Market Volume (MT) Forecast by Country, 2018 to 2033

Table 51: Oceania Market Value (US$ Million) Forecast by Product material Type, 2018 to 2033

Table 52: Oceania Market Volume (MT) Forecast by Product material Type, 2018 to 2033

Table 53: Oceania Market Value (US$ Million) Forecast by Application, 2018 to 2033

Table 54: Oceania Market Volume (MT) Forecast by Application, 2018 to 2033

Table 55: Oceania Market Value (US$ Million) Forecast by Operating type, 2018 to 2033

Table 56: Oceania Market Volume (MT) Forecast by Operating type, 2018 to 2033

Table 57: MEA Market Value (US$ Million) Forecast by Country, 2018 to 2033

Table 58: MEA Market Volume (MT) Forecast by Country, 2018 to 2033

Table 59: MEA Market Value (US$ Million) Forecast by Product material Type, 2018 to 2033

Table 60: MEA Market Volume (MT) Forecast by Product material Type, 2018 to 2033

Table 61: MEA Market Value (US$ Million) Forecast by Application, 2018 to 2033

Table 62: MEA Market Volume (MT) Forecast by Application, 2018 to 2033

Table 63: MEA Market Value (US$ Million) Forecast by Operating type, 2018 to 2033

Table 64: MEA Market Volume (MT) Forecast by Operating type, 2018 to 2033

List of Charts

Figure 1: Global Market Value (US$ Million) by Product material Type, 2023 to 2033

Figure 2: Global Market Value (US$ Million) by Application, 2023 to 2033

Figure 3: Global Market Value (US$ Million) by Operating type, 2023 to 2033

Figure 4: Global Market Value (US$ Million) by Region, 2023 to 2033

Figure 5: Global Market Value (US$ Million) Analysis by Region, 2018 to 2033

Figure 6: Global Market Volume (MT) Analysis by Region, 2018 to 2033

Figure 7: Global Market Value Share (%) and BPS Analysis by Region, 2023 to 2033

Figure 8: Global Market Y-o-Y Growth (%) Projections by Region, 2023 to 2033

Figure 9: Global Market Value (US$ Million) Analysis by Product material Type, 2018 to 2033

Figure 10: Global Market Volume (MT) Analysis by Product material Type, 2018 to 2033

Figure 11: Global Market Value Share (%) and BPS Analysis by Product material Type, 2023 to 2033

Figure 12: Global Market Y-o-Y Growth (%) Projections by Product material Type, 2023 to 2033

Figure 13: Global Market Value (US$ Million) Analysis by Application, 2018 to 2033

Figure 14: Global Market Volume (MT) Analysis by Application, 2018 to 2033

Figure 15: Global Market Value Share (%) and BPS Analysis by Application, 2023 to 2033

Figure 16: Global Market Y-o-Y Growth (%) Projections by Application, 2023 to 2033

Figure 17: Global Market Value (US$ Million) Analysis by Operating type, 2018 to 2033

Figure 18: Global Market Volume (MT) Analysis by Operating type, 2018 to 2033

Figure 19: Global Market Value Share (%) and BPS Analysis by Operating type, 2023 to 2033

Figure 20: Global Market Y-o-Y Growth (%) Projections by Operating type, 2023 to 2033

Figure 21: Global Market Attractiveness by Product material Type, 2023 to 2033

Figure 22: Global Market Attractiveness by Application, 2023 to 2033

Figure 23: Global Market Attractiveness by Operating type, 2023 to 2033

Figure 24: Global Market Attractiveness by Region, 2023 to 2033

Figure 25: North America Market Value (US$ Million) by Product material Type, 2023 to 2033

Figure 26: North America Market Value (US$ Million) by Application, 2023 to 2033

Figure 27: North America Market Value (US$ Million) by Operating type, 2023 to 2033

Figure 28: North America Market Value (US$ Million) by Country, 2023 to 2033

Figure 29: North America Market Value (US$ Million) Analysis by Country, 2018 to 2033

Figure 30: North America Market Volume (MT) Analysis by Country, 2018 to 2033

Figure 31: North America Market Value Share (%) and BPS Analysis by Country, 2023 to 2033

Figure 32: North America Market Y-o-Y Growth (%) Projections by Country, 2023 to 2033

Figure 33: North America Market Value (US$ Million) Analysis by Product material Type, 2018 to 2033

Figure 34: North America Market Volume (MT) Analysis by Product material Type, 2018 to 2033

Figure 35: North America Market Value Share (%) and BPS Analysis by Product material Type, 2023 to 2033

Figure 36: North America Market Y-o-Y Growth (%) Projections by Product material Type, 2023 to 2033

Figure 37: North America Market Value (US$ Million) Analysis by Application, 2018 to 2033

Figure 38: North America Market Volume (MT) Analysis by Application, 2018 to 2033

Figure 39: North America Market Value Share (%) and BPS Analysis by Application, 2023 to 2033

Figure 40: North America Market Y-o-Y Growth (%) Projections by Application, 2023 to 2033

Figure 41: North America Market Value (US$ Million) Analysis by Operating type, 2018 to 2033

Figure 42: North America Market Volume (MT) Analysis by Operating type, 2018 to 2033

Figure 43: North America Market Value Share (%) and BPS Analysis by Operating type, 2023 to 2033

Figure 44: North America Market Y-o-Y Growth (%) Projections by Operating type, 2023 to 2033

Figure 45: North America Market Attractiveness by Product material Type, 2023 to 2033

Figure 46: North America Market Attractiveness by Application, 2023 to 2033

Figure 47: North America Market Attractiveness by Operating type, 2023 to 2033

Figure 48: North America Market Attractiveness by Country, 2023 to 2033

Figure 49: Latin America Market Value (US$ Million) by Product material Type, 2023 to 2033

Figure 50: Latin America Market Value (US$ Million) by Application, 2023 to 2033

Figure 51: Latin America Market Value (US$ Million) by Operating type, 2023 to 2033

Figure 52: Latin America Market Value (US$ Million) by Country, 2023 to 2033

Figure 53: Latin America Market Value (US$ Million) Analysis by Country, 2018 to 2033

Figure 54: Latin America Market Volume (MT) Analysis by Country, 2018 to 2033

Figure 55: Latin America Market Value Share (%) and BPS Analysis by Country, 2023 to 2033

Figure 56: Latin America Market Y-o-Y Growth (%) Projections by Country, 2023 to 2033

Figure 57: Latin America Market Value (US$ Million) Analysis by Product material Type, 2018 to 2033

Figure 58: Latin America Market Volume (MT) Analysis by Product material Type, 2018 to 2033

Figure 59: Latin America Market Value Share (%) and BPS Analysis by Product material Type, 2023 to 2033

Figure 60: Latin America Market Y-o-Y Growth (%) Projections by Product material Type, 2023 to 2033

Figure 61: Latin America Market Value (US$ Million) Analysis by Application, 2018 to 2033

Figure 62: Latin America Market Volume (MT) Analysis by Application, 2018 to 2033

Figure 63: Latin America Market Value Share (%) and BPS Analysis by Application, 2023 to 2033

Figure 64: Latin America Market Y-o-Y Growth (%) Projections by Application, 2023 to 2033

Figure 65: Latin America Market Value (US$ Million) Analysis by Operating type, 2018 to 2033

Figure 66: Latin America Market Volume (MT) Analysis by Operating type, 2018 to 2033

Figure 67: Latin America Market Value Share (%) and BPS Analysis by Operating type, 2023 to 2033

Figure 68: Latin America Market Y-o-Y Growth (%) Projections by Operating type, 2023 to 2033

Figure 69: Latin America Market Attractiveness by Product material Type, 2023 to 2033

Figure 70: Latin America Market Attractiveness by Application, 2023 to 2033

Figure 71: Latin America Market Attractiveness by Operating type, 2023 to 2033

Figure 72: Latin America Market Attractiveness by Country, 2023 to 2033

Figure 73: Europe Market Value (US$ Million) by Product material Type, 2023 to 2033

Figure 74: Europe Market Value (US$ Million) by Application, 2023 to 2033

Figure 75: Europe Market Value (US$ Million) by Operating type, 2023 to 2033

Figure 76: Europe Market Value (US$ Million) by Country, 2023 to 2033

Figure 77: Europe Market Value (US$ Million) Analysis by Country, 2018 to 2033

Figure 78: Europe Market Volume (MT) Analysis by Country, 2018 to 2033

Figure 79: Europe Market Value Share (%) and BPS Analysis by Country, 2023 to 2033

Figure 80: Europe Market Y-o-Y Growth (%) Projections by Country, 2023 to 2033

Figure 81: Europe Market Value (US$ Million) Analysis by Product material Type, 2018 to 2033

Figure 82: Europe Market Volume (MT) Analysis by Product material Type, 2018 to 2033

Figure 83: Europe Market Value Share (%) and BPS Analysis by Product material Type, 2023 to 2033

Figure 84: Europe Market Y-o-Y Growth (%) Projections by Product material Type, 2023 to 2033

Figure 85: Europe Market Value (US$ Million) Analysis by Application, 2018 to 2033

Figure 86: Europe Market Volume (MT) Analysis by Application, 2018 to 2033

Figure 87: Europe Market Value Share (%) and BPS Analysis by Application, 2023 to 2033

Figure 88: Europe Market Y-o-Y Growth (%) Projections by Application, 2023 to 2033

Figure 89: Europe Market Value (US$ Million) Analysis by Operating type, 2018 to 2033

Figure 90: Europe Market Volume (MT) Analysis by Operating type, 2018 to 2033

Figure 91: Europe Market Value Share (%) and BPS Analysis by Operating type, 2023 to 2033

Figure 92: Europe Market Y-o-Y Growth (%) Projections by Operating type, 2023 to 2033

Figure 93: Europe Market Attractiveness by Product material Type, 2023 to 2033

Figure 94: Europe Market Attractiveness by Application, 2023 to 2033

Figure 95: Europe Market Attractiveness by Operating type, 2023 to 2033

Figure 96: Europe Market Attractiveness by Country, 2023 to 2033

Figure 97: East Asia Market Value (US$ Million) by Product material Type, 2023 to 2033

Figure 98: East Asia Market Value (US$ Million) by Application, 2023 to 2033

Figure 99: East Asia Market Value (US$ Million) by Operating type, 2023 to 2033

Figure 100: East Asia Market Value (US$ Million) by Country, 2023 to 2033

Figure 101: East Asia Market Value (US$ Million) Analysis by Country, 2018 to 2033

Figure 102: East Asia Market Volume (MT) Analysis by Country, 2018 to 2033

Figure 103: East Asia Market Value Share (%) and BPS Analysis by Country, 2023 to 2033

Figure 104: East Asia Market Y-o-Y Growth (%) Projections by Country, 2023 to 2033

Figure 105: East Asia Market Value (US$ Million) Analysis by Product material Type, 2018 to 2033

Figure 106: East Asia Market Volume (MT) Analysis by Product material Type, 2018 to 2033

Figure 107: East Asia Market Value Share (%) and BPS Analysis by Product material Type, 2023 to 2033

Figure 108: East Asia Market Y-o-Y Growth (%) Projections by Product material Type, 2023 to 2033

Figure 109: East Asia Market Value (US$ Million) Analysis by Application, 2018 to 2033

Figure 110: East Asia Market Volume (MT) Analysis by Application, 2018 to 2033

Figure 111: East Asia Market Value Share (%) and BPS Analysis by Application, 2023 to 2033

Figure 112: East Asia Market Y-o-Y Growth (%) Projections by Application, 2023 to 2033

Figure 113: East Asia Market Value (US$ Million) Analysis by Operating type, 2018 to 2033

Figure 114: East Asia Market Volume (MT) Analysis by Operating type, 2018 to 2033

Figure 115: East Asia Market Value Share (%) and BPS Analysis by Operating type, 2023 to 2033

Figure 116: East Asia Market Y-o-Y Growth (%) Projections by Operating type, 2023 to 2033

Figure 117: East Asia Market Attractiveness by Product material Type, 2023 to 2033

Figure 118: East Asia Market Attractiveness by Application, 2023 to 2033

Figure 119: East Asia Market Attractiveness by Operating type, 2023 to 2033

Figure 120: East Asia Market Attractiveness by Country, 2023 to 2033

Figure 121: South Asia Market Value (US$ Million) by Product material Type, 2023 to 2033

Figure 122: South Asia Market Value (US$ Million) by Application, 2023 to 2033

Figure 123: South Asia Market Value (US$ Million) by Operating type, 2023 to 2033

Figure 124: South Asia Market Value (US$ Million) by Country, 2023 to 2033

Figure 125: South Asia Market Value (US$ Million) Analysis by Country, 2018 to 2033

Figure 126: South Asia Market Volume (MT) Analysis by Country, 2018 to 2033

Figure 127: South Asia Market Value Share (%) and BPS Analysis by Country, 2023 to 2033

Figure 128: South Asia Market Y-o-Y Growth (%) Projections by Country, 2023 to 2033

Figure 129: South Asia Market Value (US$ Million) Analysis by Product material Type, 2018 to 2033

Figure 130: South Asia Market Volume (MT) Analysis by Product material Type, 2018 to 2033

Figure 131: South Asia Market Value Share (%) and BPS Analysis by Product material Type, 2023 to 2033

Figure 132: South Asia Market Y-o-Y Growth (%) Projections by Product material Type, 2023 to 2033

Figure 133: South Asia Market Value (US$ Million) Analysis by Application, 2018 to 2033

Figure 134: South Asia Market Volume (MT) Analysis by Application, 2018 to 2033

Figure 135: South Asia Market Value Share (%) and BPS Analysis by Application, 2023 to 2033

Figure 136: South Asia Market Y-o-Y Growth (%) Projections by Application, 2023 to 2033

Figure 137: South Asia Market Value (US$ Million) Analysis by Operating type, 2018 to 2033

Figure 138: South Asia Market Volume (MT) Analysis by Operating type, 2018 to 2033

Figure 139: South Asia Market Value Share (%) and BPS Analysis by Operating type, 2023 to 2033

Figure 140: South Asia Market Y-o-Y Growth (%) Projections by Operating type, 2023 to 2033

Figure 141: South Asia Market Attractiveness by Product material Type, 2023 to 2033

Figure 142: South Asia Market Attractiveness by Application, 2023 to 2033

Figure 143: South Asia Market Attractiveness by Operating type, 2023 to 2033

Figure 144: South Asia Market Attractiveness by Country, 2023 to 2033

Figure 145: Oceania Market Value (US$ Million) by Product material Type, 2023 to 2033

Figure 146: Oceania Market Value (US$ Million) by Application, 2023 to 2033

Figure 147: Oceania Market Value (US$ Million) by Operating type, 2023 to 2033

Figure 148: Oceania Market Value (US$ Million) by Country, 2023 to 2033

Figure 149: Oceania Market Value (US$ Million) Analysis by Country, 2018 to 2033

Figure 150: Oceania Market Volume (MT) Analysis by Country, 2018 to 2033

Figure 151: Oceania Market Value Share (%) and BPS Analysis by Country, 2023 to 2033

Figure 152: Oceania Market Y-o-Y Growth (%) Projections by Country, 2023 to 2033

Figure 153: Oceania Market Value (US$ Million) Analysis by Product material Type, 2018 to 2033

Figure 154: Oceania Market Volume (MT) Analysis by Product material Type, 2018 to 2033

Figure 155: Oceania Market Value Share (%) and BPS Analysis by Product material Type, 2023 to 2033

Figure 156: Oceania Market Y-o-Y Growth (%) Projections by Product material Type, 2023 to 2033

Figure 157: Oceania Market Value (US$ Million) Analysis by Application, 2018 to 2033

Figure 158: Oceania Market Volume (MT) Analysis by Application, 2018 to 2033

Figure 159: Oceania Market Value Share (%) and BPS Analysis by Application, 2023 to 2033

Figure 160: Oceania Market Y-o-Y Growth (%) Projections by Application, 2023 to 2033

Figure 161: Oceania Market Value (US$ Million) Analysis by Operating type, 2018 to 2033

Figure 162: Oceania Market Volume (MT) Analysis by Operating type, 2018 to 2033

Figure 163: Oceania Market Value Share (%) and BPS Analysis by Operating type, 2023 to 2033

Figure 164: Oceania Market Y-o-Y Growth (%) Projections by Operating type, 2023 to 2033

Figure 165: Oceania Market Attractiveness by Product material Type, 2023 to 2033

Figure 166: Oceania Market Attractiveness by Application, 2023 to 2033

Figure 167: Oceania Market Attractiveness by Operating type, 2023 to 2033

Figure 168: Oceania Market Attractiveness by Country, 2023 to 2033

Figure 169: MEA Market Value (US$ Million) by Product material Type, 2023 to 2033

Figure 170: MEA Market Value (US$ Million) by Application, 2023 to 2033

Figure 171: MEA Market Value (US$ Million) by Operating type, 2023 to 2033

Figure 172: MEA Market Value (US$ Million) by Country, 2023 to 2033

Figure 173: MEA Market Value (US$ Million) Analysis by Country, 2018 to 2033

Figure 174: MEA Market Volume (MT) Analysis by Country, 2018 to 2033

Figure 175: MEA Market Value Share (%) and BPS Analysis by Country, 2023 to 2033

Figure 176: MEA Market Y-o-Y Growth (%) Projections by Country, 2023 to 2033

Figure 177: MEA Market Value (US$ Million) Analysis by Product material Type, 2018 to 2033

Figure 178: MEA Market Volume (MT) Analysis by Product material Type, 2018 to 2033

Figure 179: MEA Market Value Share (%) and BPS Analysis by Product material Type, 2023 to 2033

Figure 180: MEA Market Y-o-Y Growth (%) Projections by Product material Type, 2023 to 2033

Figure 181: MEA Market Value (US$ Million) Analysis by Application, 2018 to 2033

Figure 182: MEA Market Volume (MT) Analysis by Application, 2018 to 2033

Figure 183: MEA Market Value Share (%) and BPS Analysis by Application, 2023 to 2033

Figure 184: MEA Market Y-o-Y Growth (%) Projections by Application, 2023 to 2033

Figure 185: MEA Market Value (US$ Million) Analysis by Operating type, 2018 to 2033

Figure 186: MEA Market Volume (MT) Analysis by Operating type, 2018 to 2033

Figure 187: MEA Market Value Share (%) and BPS Analysis by Operating type, 2023 to 2033

Figure 188: MEA Market Y-o-Y Growth (%) Projections by Operating type, 2023 to 2033

Figure 189: MEA Market Attractiveness by Product material Type, 2023 to 2033

Figure 190: MEA Market Attractiveness by Application, 2023 to 2033

Figure 191: MEA Market Attractiveness by Operating type, 2023 to 2033

Figure 192: MEA Market Attractiveness by Country, 2023 to 2033

Recommendations

Process Automation

Wine Bottle Sterilizer Market

Published : December 2022

Process Automation

Beer Glass Chillers Market

Published : December 2022

Consumer Product

Beer Brewing Machine Market

Published : October 2022

Food and Beverage

Wine Extract Market

Published : July 2022

Explore Food and Beverage Insights

View Reports

Electric Brewing System Market