Electric Pizza Oven Market Analysis – Size, Share, and Forecast 2023 to 2033

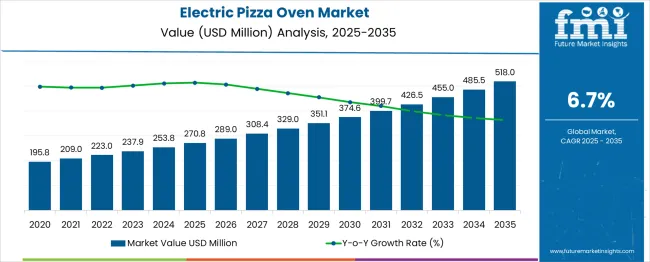
It is predicted that over the forecast period, the global electric pizza oven market will expand at a moderate CAGR of 6.7%. This market will be worth USD 237.9 million in 2023 based on its current valuation. Market analysts forecast that the electric pizza oven would generate USD 455.1 million by 2033. In the base year, when the market was growing at a CAGR of 5.8%, analysts from Future Market Insights found that the historical market valuation for the subject market was USD 222.6 million.

The advantages of an electric pizza go beyond its portability and quick cooking periods. The market is driven by the following additional advantages of electric pizza ovens:

  • Pizza ovens are a crucial component of many commercial food chains, including restaurants, fast food chains, motels, cafés, coffee shops, catering operations, resorts, pizza outlets, inns, and others.
  • Electric pizza makers tend to give each pizza a consistent, identical flavour.
  • It uses less energy than a wood-burning oven since it bakes with the door closed the majority of the time, preventing heat loss.
  • The major benefit of an electric oven is that owing to automated temperature regulation, it essentially takes care of itself.
  • To achieve the ideal balance of heat and humidity emanating from the top and bottom, most modern electric pizza ovens allow controlling the vault and floor temperatures individually.
  • It is incredibly practical and easy to store because it is small and takes up minimal space.
  • Pizza is extremely well-liked in practically every restaurant due to client demand and desire, which has made it so.
  • Due to its convenience, commercial establishments are increasingly seeking electric pizza ovens as pizza demand rises.
  • The enormous market for electric pizza ovens globally has been established by the diversity of pizzas that are readily available to satisfy the cravings of people in every region of the world.
  • Sales are driven by a product specifically designed for making pizza, its convenience of use, and the size of the pizza ovens.
  • Pizza is a highly popular food item, and its popularity has increased as a result of the rise in online food ordering.
  • A scrub brush is all that is required for users to quickly clean an electric oven.
  • The design of the electric oven is intended to make maintenance as simple as possible.
  • Other than the installation of a ventilation system, there are no limitations on how electric ovens can be installed in commercial kitchens.

The electric pizza oven market is growing quickly, but according to experts at Future Market Insights, there are several reasons that will restrain this growth throughout the projected period. The following are the restraining elements:

  • Electric pizza ovens are way too expensive than traditional gas ovens.
  • Electric pizza ovens fail to provide the authentic Smokey flavors of wood-fired pizza along with the crispier crust with a satisfying crunch.
  • An electric pizza oven call for an extended time to preheat.
Report Attribute Details
Electric Pizza Oven Market Value (2023) USD 237.9 Million
Electric Pizza Oven Market Anticipated Value (2033) USD 455.1 Million
Electric Pizza Oven Market Projected Growth Rate (2023 to 2033) 6.7%
Electric Pizza Oven Market Historical Growth Rate (2017 to 2022) 5.8%

Millennial Dining Trends Fuel Expansion of Electric Pizza Oven Installations

Pizza outlets have grown to be a highly popular area for individuals, especially millennials, to spend their extra money as a result of urbanization and a rise in consumer purchasing power. As a result, there is a huge possibility even in emerging nations where brand-new hospitality facilities are being established.

As each commercial kitchens have distinct demands concerning size, fuel utilized, ease of cleaning, size of the grill, number of burners, simplicity of regulating temperature, cost-effective pricing, custom heat settings, timer, etc., providing customized solutions is one of the current industry trends. Electric pizza ovens provide them with all. The market players are attempting to meet these customer demands with these characteristics, which are current market trends. Brands are gaining a competitive advantage owing to such personalized products and a thoughtful combination of crucial elements.

Additionally, since this sector is already established and pizza ovens are practically ubiquitous in commercial kitchens in developed nations, it is simpler to enter. Offering pioneering styles and designs can provide players with new opportunities. When it comes to electric pizza ovens commercial, producers may create profitable market prospects by including popular features based on consumer demand.

Investing in renewable energy sources like solar panels, which are subsidized in many nations, might lower the cost of electricity. Electric ovens are more expensive initially but take less time and work to run in general, making them ideal for a busy restaurant.

2018 to 2022 Global Electric Pizza Oven Sales Outlook Compared to Forecast from 2023 to 2033

Following a thorough market analysis, FMI experts found that the electric pizza oven market has shown remarkable growth in recent years. FMI researchers discovered after conducting a thorough market analysis that the electric pizza oven market has shown remarkable growth recently. Since pizza ovens are one of the most popular products in the culinary and hospitality industries, the CAGR has increased in proportion. The CAGR of the market ascended from 5.8% from 2018 to 2022 to 6.7% from 2023 to 2033. The overall market value increased by about USD 15.3 million from 2022 to 2023.

A device that uses electricity to make pizzas is an electric pizza oven. These electric ovens are commonly used today. These electric ovens come in a few different varieties. The flames within the gas and electric pizza ovens are produced by venting hot air from the cooking chamber. A heating element or a fan serves as the heat source. Since they utilize less electricity, the electrical systems are far more effective. To produce a high temperature, an electric pizza cooker uses electricity to spark ignition. Given the constant high temperature used throughout the cooking, food is prepared evenly. The dough will get crispy on the outside without drying out if it is cooked at high heat for a shorter period of time. Hence, these are typically preferred by chefs.

The popularity of electric pizza ovens is growing as more people choose to eat healthily. A benefit of having this small appliance in a home kitchen is the ability to make homemade pizza in an outdoor electric pizza oven that produces restaurant-style pizza. All people need to bake the best pizza ever is a fantastic pizza recipe in their possession because these ovens are simple to operate and do not require any baking experience. Customers value their energy efficiency, portability, convenience, ease of use, and ease of maintenance.

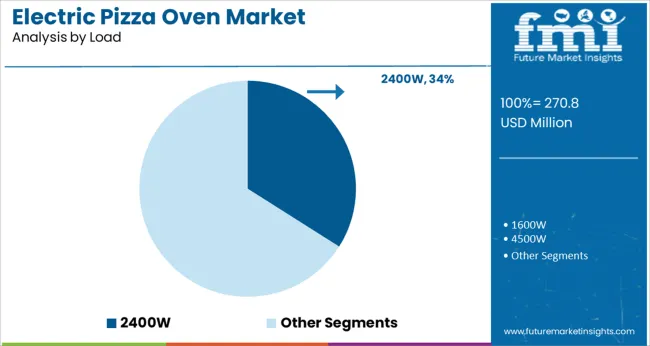
An idle electric pizza oven needs to be suited for a kitchen at home and run on home voltage. As a result, a number of manufacturers are presently creating electric pizza ovens for use in both residential and commercial settings. Additionally, they now provide electric pizza ovens with various electrical loads. Customers can now review the parameters of these ovens to confirm that the power supply of their kitchen can support the energy load of the electric pizza oven, and they can make their purchasing decision based on this information. Furthermore, several manufacturers are now producing portable electric pizza ovens for small parties and get together. Wherever there is an electricity connection, these ovens can be used as countertop electric pizza ovens.

Electric Pizza Oven Industry Analysis by Product Type, Power Rating, and End Use

Dominating Sectors Developing Legacy Considering Individual Predilection

Deck Ovens - By Type

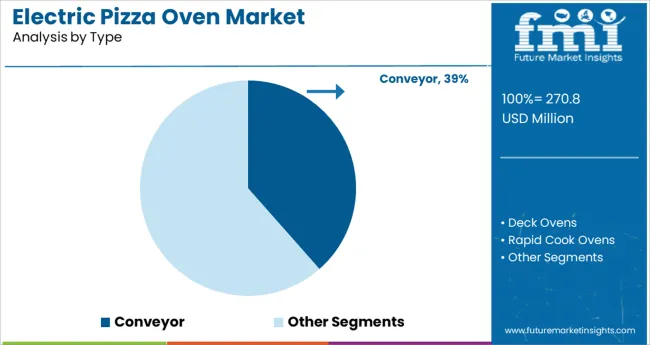
On the basis of type, the electric pizza oven market is categorized into the conveyor, deck ovens, and rapid cook ovens. Among these sub-segments, the deck ovens segment holds the most significant market share by obtaining almost 58.3% global market share during the forecast period.

The following elements are fueling the market expansion:

  • Compared to conventional industrial ovens, deck ovens can reduce fuel usage by up to 75%. The use of vapour tube heat, which enables optimal heat distribution inside the oven, is responsible for this energy efficiency.
  • With fewer moving parts and no spinning trays, deck ovens have a simpler design. The deck ovens also feature one fewer motor, which suggests that less emphasis is placed on the quantity of electricity consumed.
  • In terms of water usage, deck ovens are quite effective. In comparison to other types of ovens that are based on the remote boiler system, deck ovens have the ability to retain the majority of the steam thanks to their self-contained steam system.
  • The deck ovens have a fantastic feature called vapour tube technology. Using sealed vapour tubes, it is utilized in the conversion of water to steam.
  • Deck ovens might be expensive to purchase, but they are sturdy. They will thus provide bang for the buck. Since the remarkable characteristics of deck ovens guarantee a high degree of efficiency in fuel and water usage, such ovens are extremely sustainable.

Automatic - By Automation Type

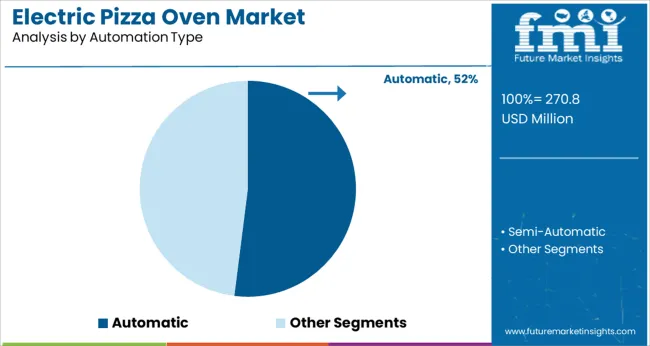
Depending on the automation type, the electric pizza oven market is bifurcated into automatic and semi-automatic. The automatic segment dominates the market acquiring almost 73.4% global market share.

The expansion of the market is being influenced by the following variables:
  • Interchangeable automatic oven components, such as baking stones and steamers, provide people access to a larger range of cooking styles and techniques, whether they want to make a handmade pizza that is baked uniformly.
  • Many automatic ovens enable smartphone app control. In order to keep a closer check on the recipes while they cook and increase the flexibility of the cooking experience overall, it might be helpful to explore the many features of the mobile app, if it offers one.
  • Individuals could be able to use remote monitoring features through their smart oven app in addition to on-the-go operation, which may help them to keep a check on their pizzas even while they are not in the kitchen. Additionally, they automatically turn off when the pizza is baked.

Top Countries Advancing Electric Pizza Oven Usage and Distribution

Exposition of the Approaches Used by Different Nations to Unwind Promising Revenue Sources

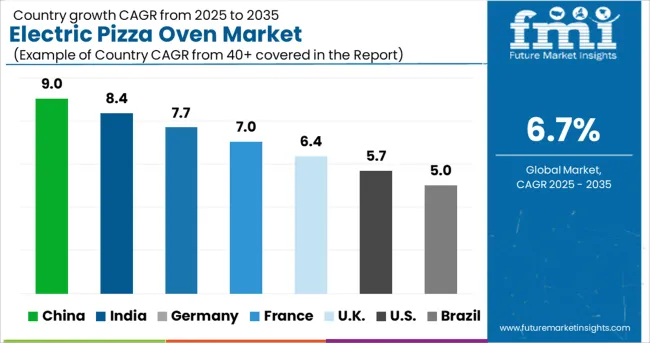
The expansion of the region has been assisted by the greater penetration of the food service sector in North American and European nations. Since there are so many different types of cuisine in the food sector, other regions including East Asia, South Asia, and the Middle East are expected to witness expansion in the pizza oven market. Pizza is one of the most often ordered foods online. The business appears to be flourishing overall as a result of rising demand and popularity in the food sector.
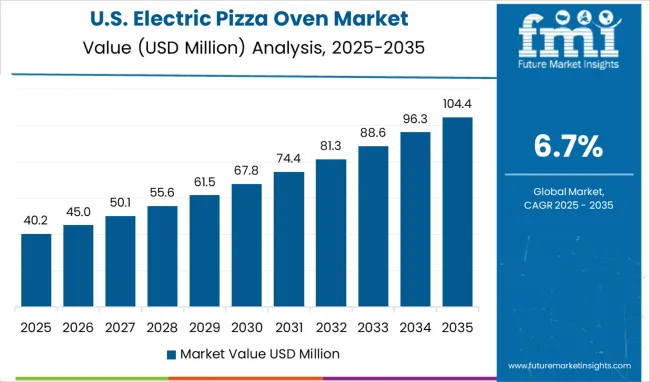
There are more Pizzerias than ever before in the USA

The USA continues to lead the North American electric pizza oven market. The American restaurant market has a significant portion devoted to pizza restaurants. Pizza restaurant sales totaled over USD 46 billion in 2020 owing to diners who ate in, ordered takeaway, and requested delivery. In the USA, the sales of pizza restaurants have increased practically continuously over the historical period. As a result, the USA electric pizza oven market now maintains a share of roughly 32.6%. The expanding market shares can be attributed to:

  • The country is embracing the fast-food culture as the country has the largest food and beverage industry in the world.
  • Rising disposable income of the population coupled with changing lifestyle of the people.
  • Given the enormous number of Italian immigrants, pizza attained its current level of popularity.
  • Consumers are increasingly focusing on purchasing front-line and novel equipment, such as mobile electric pizza ovens that come with a variety of cutting-edge capabilities.
  • The rising inclination of consumers to spend on tools that help them with culinary tasks
  • The Pizza Restaurants business, which consists of full-service and quick-service restaurants that cook and serve pizza and other similar foods, is growing reasonably in the USA.

Europe is thought to hold significant influence over the electric pizza oven market. In the United Kingdom, pizza and Italian restaurants were among the most common. Another significant element of the UK takeout market is pizza eateries. The largest global franchise Domino's Pizza - Domino's Pizza Group, is based in this country. As a result, the adoption of commercial electric pizza ovens is fairly clear in this nation. Over the course of the forecast period, the CAGR for the United Kingdom electric pizza oven market is anticipated to be 4.1%. Elements contributing to the growth of the market in the European region are:

  • Massive urbanization, better construction of modern facilities for integrated homes, the rise of smart appliances with smaller alternatives, and other factors
  • Kitchen appliances are popular choices for consumers in this nation searching for highly innovative equipment.
  • Luxurious electric pizza ovens for home are being introduced by manufacturers in this region to appeal to millennial consumers and meet their aesthetic and dynamic tastes.
  • Simple user interface and evolving food consumption habits of individuals
  • Electric pizza ovens are especially popular due to the surge in one-person households and concerns about space saving.

China, nationally recognized for producing an enormous amount of electronics and smart devices, has made its fortunes in the electronics sector. During the forecast period, it is expected that the Chinese electric pizza oven market will expand at a CAGR of 5.4%. These elements contribute to the market expansion in China:

  • China has a thriving restaurant and hospitality business as well as a quickly expanding food service sector.
  • Increasing customer enthusiasm for large-scale electrical appliances.
  • Pizza is the Absolute Obsession of Chinese Consumers.
  • It is anticipated that the opening of several renowned pizza restaurant chains in China would increase demand for continuous-line electric pizza ovens within this country.

Start-ups Driving Innovation in Compact and Smart Pizza Oven Solutions

Growing Companies to Improve the Electric Pizza Oven Market Subtleties

New competitors in the electric pizza oven market are offering innovative products and obtaining a competitive edge by utilizing technical breakthroughs. These companies continuously spend money on Research and Development in order to stay on top of changing customer tastes and expectations from the end-use industry. The industry for electric pizza ovens is being helped by initiatives to improve its standing in the forum.

Leading Start-ups to Concentrate on

Arise Equipments India - Indian Start-up

Since its establishment in 2017, Arise Equipments India has built a solid name for itself as a manufacturer, wholesaler, trader, and retailer of a wide selection of bakery equipment, including ovens and waffle makers. This is why a wide range of industries/applications, including those in the food and beverage industry, quality control, research and development, and educational institutions, use its Product Line on a daily basis. Its highly trained employees exclusively use the newest equipment to make these goods with extreme precision. The business is able to provide its products to different regions of the country thanks to the development of a substantial distribution network.

MPM Food Equipment Group - United States of America

The MPM Food Equipment Group was established with the straightforward goal of offering the greatest customer service in the business together with the highest-quality food equipment and design services. Due to its modest size, MPM is able to give each of its clients, from family-run restaurants to major national grocery chains, unparalleled individual attention. Every step of the way, from the planning phases to grand openings, it works closely with each client.

Leading Competitors in the Global Electric Pizza Oven Market

This statistical analysis of the associated industry by Future Market Insights reveals the effective marketing techniques used by the major producers of electric pizza ovens. The suppliers are using both organic and inorganic expansion approaches to engage in the competitive marketplace for electric pizza ovens. To advance technology in the equipment that produces the perfect piece of pizza for consumers and increase their market share, manufacturers are substantially spending on research and development.

Pointing towards the Perfect Slice of Pizza with an Electric Pizza Oven, ft. Avantco Equipment, Garland, and Nemco Food Equipment

Garland has spent the last 140 years working closely with our clients to develop workable, long-lasting solutions that let them express their passion every day. The company put a lot of effort into gaining their trust while always innovating and adapting to stay up with our rapidly evolving sector. To address the various demands of our customers, the company has collaborated on a number of advancements, ranging from ranges and clamshell grills to whole island suites. To solve the actual problems the organization encounters, they were all built with the same fundamental objective of practical application in mind.

  • In August 2021, Garland's dependable and industry-leading Cuisine Series® heavy-duty oven and burner system now includes extra time-saving features. Built on a 36" chassis, the Cuisine Series has long combined strength and meticulous design to meet the demands of high-performance kitchens. Garland has just added many new features to provide quicker results and even better usability.

Ovens from Avantco are perfect for busy establishments with constrained space. With the ease and effectiveness you want, you can quickly prepare chicken, burgers, steaks, and vegetable dishes owing to the durable stainless steel construction and powerful burners. For precise heat distribution and even cooking, Avantco ovens employ a radiant heat source. Business is conducted via Avantco Equipment's Unified division. Among the several easy-to-use griddles offered by the firm are a removable oil pan and a sturdy stainless steel frame with 3" high sides and backsplashes. Among the griddles in this category are the Avantco AG36MG 36" Countertop oven with Manual Controls - 90,000 BTU and Avantco EG16N 16" Electric Countertop Griddle - 120V.

  • In April 2022, The Chef Series CAG-36-RC 36" Countertop Radiant Oven from Avantco has 90,000 BTU. Burgers, prawns, or vegetable skewers cook well on this stove since each burner can be set to a different temperature. In order to reflect heat onto the cooking surface, this oven uses radiants, which ensures quick recovery and practical heat retention.

Nemco Food Equipment is well recognized for being an inventor of novel equipment solutions that speed up and reduce the cost of preparing special menu items, which would normally need a lot of manpower. Along with its portfolio of ovens, toasters, boiling units, waffle and cone bakers, industrial food-waste disposers, and other countertop solutions, Nemco continues to develop, produce, and sell further countertop solutions for hot-dog cooking, food retailing, and food holding.

  • In January 2019, Nemco Food Equipment, with its four-decade-long reputation as a pioneer in manual countertop food-prep equipment, turned on a line of electric food processing machines, offering operators the high-capacity choice they need to maintain fresh-food appeal despite rising labour concerns.

Additional Key Companies Expanding in the Electric Pizza Oven Sector

  • Bakers Pride
  • Benchmark USA
  • Blodgett
  • Turbochef
  • Vollrath
  • Waring
  • Akasa International
  • Omcan Inc.
  • APW Wyott
  • Doyon

Top Investment Segments in the Electric Pizza Oven Market

By Type:

  • Conveyor
  • Deck Ovens
  • Rapid Cook Ovens

By Automation Type:

  • Automatic
  • Semi-automatic

By Load:

  • 1600W
  • 2400W
  • 4500W
  • Others

By Maximum Temperature:

  • 350°F
  • 400°F
  • 600°F
  • 800°F
  • 1000°F
  • Others

By Application:

  • Residential
  • Commercial

By Sales Channel:

  • Wholesalers/Distributors
  • Direct Sales
  • Online Retailers
  • Specialty Stores
  • Others

By Region:

  • North America
  • Latin America
  • Europe
  • South Asia Pacific
  • East Asia
  • Middle East and Africa

Table of Content

  • 1. Executive Summary | Electric Pizza Oven Market
  • 2. Market Overview
  • 3. Key Market Trends
  • 4. Key Success Factors
  • 5. Global Market Demand Analysis 2018 to 2022 and Forecast, 2023 to 2033
  • 6. Global Market - Pricing Analysis
  • 7. Global Market Demand (in Value - USD Million) Analysis 2018 to 2022 and Forecast, 2023 to 2033
  • 8. Market Background
  • 9. Global Market Analysis 2018 to 2022 and Forecast 2022 to 2033, by Type
    • 9.1. Conveyor
    • 9.2. Deck Ovens
    • 9.3. Rapid Cook Ovens
  • 10. Global Market Analysis 2018 to 2022 and Forecast 2023 to 2033, by Automation Type
    • 10.1. Semi-Automatic
    • 10.2. Automatic
  • 11. Global Market Analysis 2018 to 2022 and Forecast 2023 to 2033, by Load
    • 11.1. 1600W
    • 11.2. 2400W
    • 11.3. 4500W
    • 11.4. Others
  • 12. Global Market Analysis 2018 to 2022 and Forecast 2023 to 2033, by Max. Temperature
    • 12.1. 350 ⁰F
    • 12.2. 400 ⁰F
    • 12.3. 600 ⁰F
    • 12.4. 800 ⁰F
    • 12.5. 1000 ⁰F
    • 12.6. Others
  • 13. Global Market Analysis 2018 to 2022 and Forecast 2023 to 2033, by Application
    • 13.1. Residential
    • 13.2. Commercial
      • 13.2.1. Restaurants
      • 13.2.2. Hotels
      • 13.2.3. Fast Food Chains
      • 13.2.4. Others
  • 14. Global Market Analysis 2018 to 2022 and Forecast 2023 to 2033, by Sales Channel
    • 14.1. Wholesalers/Distributors
    • 14.2. Direct Sales
    • 14.3. Online Retailers
    • 14.4. Specialty Stores
    • 14.5. Others
  • 15. Global Market Analysis 2018 to 2022 and Forecast 2023 to 2033, by Region
    • 15.1. North America
    • 15.2. Latin America
    • 15.3. Europe
    • 15.4. South Asia Pacific
    • 15.5. East Asia
    • 15.6. Middle East & Africa
  • 16. North America Market Analysis 2018 to 2022 and Forecast 2023 to 2033
  • 17. Latin America Market Analysis 2018 to 2022 and Forecast 2022 to 2033
  • 18. Europe Market Analysis 2018 to 2022 and Forecast 2023 to 2033
  • 19. South Asia and Pacific Market Analysis 2018 to 2022 and Forecast 2023 to 2033
  • 20. East Asia Market Analysis 2018 to 2022 and Forecast 2023 to 2033
  • 21. Middle East and Africa Market Analysis 2018 to 2022 and Forecast 2023 to 2033
  • 22. Country-wise Market Analysis
  • 23. Market Structure Analysis
  • 24. Competition Analysis
    • 24.1. Avantco Equipment
    • 24.2. Bakers Pride
    • 24.3. Benchmark USA
    • 24.4. Blodgett
    • 24.5. Turbochef
    • 24.6. Vollrath
    • 24.7. Waring
    • 24.8. Nemco Foodservice Equipment
    • 24.9. Akasa International
    • 24.10. Omcan Inc.
    • 24.11. APW Wyott
    • 24.12. Doyon
    • 24.13. Garland Group
  • 25. Assumptions and Acronyms Used
  • 26. Research Methodology

List of Tables

Table 01: Global Market Size Volume (Units) and Value (US$ Million) Forecast by Type, 2018 to 2033

Table 02: Global Market Size Volume (Units) and Value (US$ Million) Forecast by Automation Type, 2018 to 2033

Table 03: Global Market Size Volume (Units) and Value (US$ Million) Forecast by Load, 2018 to 2033

Table 04: Global Market Size Volume (Units) and Value (US$ Million) Forecast by Max. Temperature, 2018 to 2033

Table 05: Global Market Size Volume (Units) and Value (US$ Million) Forecast by Application, 2018 to 2033

Table 06: Global Market Size Volume (Units) and Value (US$ Million) Forecast by Sales Channel, 2018 to 2033

Table 07: Global Market Size Volume (Units) and Value (US$ Million) Forecast by Region, 2018 to 2033

Table 08: North America Market Size Volume (Units) and Value (US$ Million) Forecast by Type, 2018 to 2033

Table 09: North America Market Size Volume (Units) and Value (US$ Million) Forecast by Automation Type, 2018 to 2033

Table 10: North America Market Size Volume (Units) and Value (US$ Million) Forecast by Load, 2018 to 2033

Table 11: North America Market Size Volume (Units) and Value (US$ Million) Forecast by Max. Temperature, 2018 to 2033

Table 12: North America Market Size Volume (Units) and Value (US$ Million) Forecast by Application, 2018 to 2033

Table 13: North America Market Size Volume (Units) and Value (US$ Million) Forecast by Sales Channel, 2018 to 2033

Table 14: North America Market Size Volume (Units) and Value (US$ Million) Forecast by Country, 2018 to 2033

Table 15: Latin America Market Size Volume (Units) and Value (US$ Million) Forecast by Type, 2018 to 2033

Table 16: Latin America Market Size Volume (Units) and Value (US$ Million) Forecast by Automation Type, 2018 to 2033

Table 17: Latin America Market Size Volume (Units) and Value (US$ Million) Forecast by Load, 2018 to 2033

Table 18: Latin America Market Size Volume (Units) and Value (US$ Million) Forecast by Max. Temperature, 2018 to 2033

Table 19: Latin America Market Size Volume (Units) and Value (US$ Million) Forecast by Application, 2018 to 2033

Table 20: Latin America Market Size Volume (Units) and Value (US$ Million) Forecast by Sales Channel, 2018 to 2033

Table 21: Latin America Market Size Volume (Units) and Value (US$ Million) Forecast by Country, 2018 to 2033

Table 22: Europe Market Size Volume (Units) and Value (US$ Million) Forecast by Type, 2018 to 2033

Table 23: Europe Market Size Volume (Units) and Value (US$ Million) Forecast by Automation Type, 2018 to 2033

Table 24: Europe Market Size Volume (Units) and Value (US$ Million) Forecast by Load, 2018 to 2033

Table 25: Europe Market Size Volume (Units) and Value (US$ Million) Forecast by Max. Temperature, 2018 to 2033

Table 26: Europe Market Size Volume (Units) and Value (US$ Million) Forecast by Application, 2018 to 2033

Table 27: Europe Market Size Volume (Units) and Value (US$ Million) Forecast by Sales Channel, 2018 to 2033

Table 28: Europe Market Size Volume (Units) and Value (US$ Million) Forecast by Country, 2018 to 2033

Table 29: East Asia Market Size Volume (Units) and Value (US$ Million) Forecast by Type, 2018 to 2033

Table 30: East Asia Market Size Volume (Units) and Value (US$ Million) Forecast by Automation Type, 2018 to 2033

Table 31: East Asia Market Size Volume (Units) and Value (US$ Million) Forecast by Load, 2018 to 2033

Table 32: East Asia Market Size Volume (Units) and Value (US$ Million) Forecast by Max. Temperature, 2018 to 2033

Table 33: East Asia Market Size Volume (Units) and Value (US$ Million) Forecast by Application, 2018 to 2033

Table 34: East Asia Market Size Volume (Units) and Value (US$ Million) Forecast by Sales Channel, 2018 to 2033

Table 35: East Asia Market Size Volume (Units) and Value (US$ Million) Forecast by Country, 2018 to 2033

Table 36: South Asia Pacific Market Size Volume (Units) and Value (US$ Million) Forecast by Type, 2018 to 2033

Table 37: South Asia Pacific Market Size Volume (Units) and Value (US$ Million) Forecast by Automation Type, 2018 to 2033

Table 38: South Asia Pacific Market Size Volume (Units) and Value (US$ Million) Forecast by Load, 2018 to 2033

Table 39: South Asia Pacific Market Size Volume (Units) and Value (US$ Million) Forecast by Max. Temperature, 2018 to 2033

Table 40: South Asia Pacific Market Size Volume (Units) and Value (US$ Million) Forecast by Application, 2018 to 2033

Table 41: South Asia Pacific Market Size Volume (Units) and Value (US$ Million) Forecast by Sales Channel, 2018 to 2033

Table 42: South Asia Pacific Market Size Volume (Units) and Value (US$ Million) Forecast by Country, 2018 to 2033

Table 43: MEA Market Size Volume (Units) and Value (US$ Million) Forecast by Type, 2018 to 2033

Table 44: MEA Market Size Volume (Units) and Value (US$ Million) Forecast by Automation Type, 2018 to 2033

Table 45: MEA Market Size Volume (Units) and Value (US$ Million) Forecast by Load, 2018 to 2033

Table 46: MEA Market Size Volume (Units) and Value (US$ Million) Forecast by Max. Temperature, 2018 to 2033

Table 47: MEA Market Size Volume (Units) and Value (US$ Million) Forecast by Application, 2018 to 2033

Table 48: MEA Market Size Volume (Units) and Value (US$ Million) Forecast by Sales Channel, 2018 to 2033

Table 49: MEA Market Size Volume (Units) and Value (US$ Million) Forecast by Country, 2018 to 2033

List of Figures

Figure 01: Global Market Historical Volume (Units), 2018 to 2023

Figure 02: Global Market Volume (Units) Forecast, 2023 to 2033

Figure 03: Global Market Historical Value (US$ Million), 2018 to 2023

Figure 04: Global Market Absolute $ Opportunity, 2023 to 2033

Figure 05: Global Market Value (US$ Million) Forecast, 2023 to 2033

Figure 06: Global Market Share and BPS Analysis by Type- 2023 to 2033

Figure 07: Global Market Y-o-Y Growth Projections by Type, 2023 to 2033

Figure 08: Global Market Attractiveness Analysis by Type, 2023 to 2033

Figure 09: Global Market Share and BPS Analysis by Automation Type- 2023 to 2033

Figure 10: Global Market Y-o-Y Growth Projections by Automation Type, 2023 to 2033

Figure 11: Global Market Attractiveness Analysis by Automation Type, 2023 to 2033

Figure 12: Global Market Share and BPS Analysis by Load- 2023 to 2033

Figure 13: Global Market Y-o-Y Growth Projections by Load, 2023 to 2033

Figure 14: Global Market Attractiveness Analysis by Load, 2023 to 2033

Figure 15: Global Market Share and BPS Analysis by Max. Temperature- 2023 to 2033

Figure 16: Global Market Y-o-Y Growth Projections by Max. Temperature, 2023 to 2033

Figure 17: Global Market Attractiveness Analysis by Max. Temperature, 2023 to 2033

Figure 18: Global Market Share and BPS Analysis by Application- 2023 to 2033

Figure 19: Global Market Y-o-Y Growth Projections by Application, 2023 to 2033

Figure 20: Global Market Attractiveness Analysis by Application, 2023 to 2033

Figure 21: Global Market Share and BPS Analysis by Sales Channel- 2023 to 2033

Figure 22: Global Market Y-o-Y Growth Projections by Sales Channel, 2023 to 2033

Figure 23: Global Market Attractiveness Analysis by Sales Channel, 2023 to 2033

Figure 24: Global Market Share and BPS Analysis by Region- 2023 to 2033

Figure 25: Global Market Y-o-Y Growth Projections by Region, 2023 to 2033

Figure 26: Global Market Attractiveness Analysis by Region, 2023 to 2033

Figure 27: North America Market Share and BPS Analysis by Country- 2023 to 2033

Figure 28: North America Market Y-o-Y Growth Projections by Country, 2023 to 2033

Figure 29: North America Market Attractiveness Analysis by Country, 2023 to 2033

Figure 30: North America Market Share and BPS Analysis by Type- 2023 to 2033

Figure 31: North America Market Y-o-Y Growth Projections by Type, 2023 to 2033

Figure 32: North America Market Attractiveness Analysis by Type, 2023 to 2033

Figure 33: North America Market Share and BPS Analysis by Automation Type- 2023 to 2033

Figure 34: North America Market Y-o-Y Growth Projections by Automation Type, 2023 to 2033

Figure 35: North America Market Attractiveness Analysis by Automation Type, 2023 to 2033

Figure 36: North America Market Share and BPS Analysis by Load- 2023 to 2033

Figure 37: North America Market Y-o-Y Growth Projections by Load, 2023 to 2033

Figure 38: North America Market Attractiveness Analysis by Load, 2023 to 2033

Figure 39: North America Market Share and BPS Analysis by Max. Temperature- 2023 to 2033

Figure 40: North America Market Y-o-Y Growth Projections by Max. Temperature, 2023 to 2033

Figure 41: North America Market Attractiveness Analysis by Max. Temperature, 2023 to 2033

Figure 42: North America Market Share and BPS Analysis by Application- 2023 to 2033

Figure 43: North America Market Y-o-Y Growth Projections by Application, 2023 to 2033

Figure 44: North America Market Attractiveness Analysis by Application, 2023 to 2033

Figure 45: North America Market Share and BPS Analysis by Sales Channel- 2023 to 2033

Figure 46: North America Market Y-o-Y Growth Projections by Sales Channel, 2023 to 2033

Figure 47: North America Market Attractiveness Analysis by Sales Channel, 2023 to 2033

Figure 48: North America Market Share and BPS Analysis by Region- 2023 to 2033

Figure 49: North America Market Y-o-Y Growth Projections by Region, 2023 to 2033

Figure 50: North America Market Attractiveness Analysis by Region, 2023 to 2033

Figure 51: Latin America Market Share and BPS Analysis by Country- 2023 to 2033

Figure 52: Latin America Market Y-o-Y Growth Projections by Country, 2023 to 2033

Figure 53: Latin America Market Attractiveness Analysis by Country, 2023 to 2033

Figure 54: Latin America Market Share and BPS Analysis by Type- 2023 to 2033

Figure 55: Latin America Market Y-o-Y Growth Projections by Type, 2023 to 2033

Figure 56: Latin America Market Attractiveness Analysis by Type, 2023 to 2033

Figure 57: Latin America Market Share and BPS Analysis by Automation Type- 2023 to 2033

Figure 58: Latin America Market Y-o-Y Growth Projections by Automation Type, 2023 to 2033

Figure 59: Latin America Market Attractiveness Analysis by Automation Type, 2023 to 2033

Figure 60: Latin America Market Share and BPS Analysis by Load- 2023 to 2033

Figure 61: Latin America Market Y-o-Y Growth Projections by Load, 2023 to 2033

Figure 62: Latin America Market Attractiveness Analysis by Load, 2023 to 2033

Figure 63: Latin America Market Share and BPS Analysis by Max. Temperature- 2023 to 2033

Figure 64: Latin America Market Y-o-Y Growth Projections by Max. Temperature, 2023 to 2033

Figure 65: Latin America Market Attractiveness Analysis by Max. Temperature, 2023 to 2033

Figure 66: Latin America Market Share and BPS Analysis by Application- 2023 to 2033

Figure 67: Latin America Market Y-o-Y Growth Projections by Application, 2023 to 2033

Figure 68: Latin America Market Attractiveness Analysis by Application, 2023 to 2033

Figure 69: Latin America Market Share and BPS Analysis by Sales Channel- 2023 to 2033

Figure 70: Latin America Market Y-o-Y Growth Projections by Sales Channel, 2023 to 2033

Figure 71: Latin America Market Attractiveness Analysis by Sales Channel, 2023 to 2033

Figure 72: Latin America Market Share and BPS Analysis by Region- 2023 to 2033

Figure 73: Latin America Market Y-o-Y Growth Projections by Region, 2023 to 2033

Figure 74: Latin America Market Attractiveness Analysis by Region, 2023 to 2033

Figure 75: Europe Market Share and BPS Analysis by Country- 2023 to 2033

Figure 76: Europe Market Y-o-Y Growth Projections by Country, 2023 to 2033

Figure 77: Europe Market Attractiveness Analysis by Country, 2023 to 2033

Figure 78: Europe Market Share and BPS Analysis by Type- 2023 to 2033

Figure 79: Europe Market Y-o-Y Growth Projections by Type, 2023 to 2033

Figure 80: Europe Market Attractiveness Analysis by Type, 2023 to 2033

Figure 81: Europe Market Share and BPS Analysis by Automation Type- 2023 to 2033

Figure 82: Europe Market Y-o-Y Growth Projections by Automation Type, 2023 to 2033

Figure 83: Europe Market Attractiveness Analysis by Automation Type, 2023 to 2033

Figure 84: Europe Market Share and BPS Analysis by Load- 2023 to 2033

Figure 85: Europe Market Y-o-Y Growth Projections by Load, 2023 to 2033

Figure 86: Europe Market Attractiveness Analysis by Load, 2023 to 2033

Figure 87: Europe Market Share and BPS Analysis by Max. Temperature- 2023 to 2033

Figure 88: Europe Market Y-o-Y Growth Projections by Max. Temperature, 2023 to 2033

Figure 89: Europe Market Attractiveness Analysis by Max. Temperature, 2023 to 2033

Figure 90: Europe Market Share and BPS Analysis by Application- 2023 to 2033

Figure 91: Europe Market Y-o-Y Growth Projections by Application, 2023 to 2033

Figure 92: Europe Market Attractiveness Analysis by Application, 2023 to 2033

Figure 93: Europe Market Share and BPS Analysis by Sales Channel- 2023 to 2033

Figure 94: Europe Market Y-o-Y Growth Projections by Sales Channel, 2023 to 2033

Figure 95: Europe Market Attractiveness Analysis by Sales Channel, 2023 to 2033

Figure 96: Europe Market Share and BPS Analysis by Region- 2023 to 2033

Figure 97: Europe Market Y-o-Y Growth Projections by Region, 2023 to 2033

Figure 98: Europe Market Attractiveness Analysis by Region, 2023 to 2033

Figure 99: East Asia Market Share and BPS Analysis by Country- 2023 to 2033

Figure 100: East Asia Market Y-o-Y Growth Projections by Country, 2023 to 2033

Figure 101: East Asia Market Attractiveness Analysis by Country, 2023 to 2033

Figure 102: East Asia Market Share and BPS Analysis by Type- 2023 to 2033

Figure 103: East Asia Market Y-o-Y Growth Projections by Type, 2023 to 2033

Figure 104: East Asia Market Attractiveness Analysis by Type, 2023 to 2033

Figure 105: East Asia Market Share and BPS Analysis by Automation Type- 2023 to 2033

Figure 106: East Asia Market Y-o-Y Growth Projections by Automation Type, 2023 to 2033

Figure 107: East Asia Market Attractiveness Analysis by Automation Type, 2023 to 2033

Figure 108: East Asia Market Share and BPS Analysis by Load- 2023 to 2033

Figure 109: East Asia Market Y-o-Y Growth Projections by Load, 2023 to 2033

Figure 110: East Asia Market Attractiveness Analysis by Load, 2023 to 2033

Figure 111: East Asia Market Share and BPS Analysis by Max. Temperature- 2023 to 2033

Figure 112: East Asia Market Y-o-Y Growth Projections by Max. Temperature, 2023 to 2033

Figure 113: East Asia Market Attractiveness Analysis by Max. Temperature, 2023 to 2033

Figure 114: East Asia Market Share and BPS Analysis by Application- 2023 to 2033

Figure 115: East Asia Market Y-o-Y Growth Projections by Application, 2023 to 2033

Figure 116: East Asia Market Attractiveness Analysis by Application, 2023 to 2033

Figure 117: East Asia Market Share and BPS Analysis by Sales Channel- 2023 to 2033

Figure 118: East Asia Market Y-o-Y Growth Projections by Sales Channel, 2023 to 2033

Figure 119: East Asia Market Attractiveness Analysis by Sales Channel, 2023 to 2033

Figure 120: East Asia Market Share and BPS Analysis by Region- 2023 to 2033

Figure 121: East Asia Market Y-o-Y Growth Projections by Region, 2023 to 2033

Figure 122: East Asia Market Attractiveness Analysis by Region, 2023 to 2033

Figure 123: South Asia Pacific Market Share and BPS Analysis by Country- 2023 to 2033

Figure 124: South Asia Pacific Market Y-o-Y Growth Projections by Country, 2023 to 2033

Figure 125: South Asia Pacific Market Attractiveness Analysis by Country, 2023 to 2033

Figure 126: South Asia Pacific Market Share and BPS Analysis by Type- 2023 to 2033

Figure 127: South Asia Pacific Market Y-o-Y Growth Projections by Type, 2023 to 2033

Figure 128: South Asia Pacific Market Attractiveness Analysis by Type, 2023 to 2033

Figure 129: South Asia Pacific Market Share and BPS Analysis by Automation Type- 2023 to 2033

Figure 130: South Asia Pacific Market Y-o-Y Growth Projections by Automation Type, 2023 to 2033

Figure 131: South Asia Pacific Market Attractiveness Analysis by Automation Type, 2023 to 2033

Figure 132: South Asia Pacific Market Share and BPS Analysis by Load- 2023 to 2033

Figure 133: South Asia Pacific Market Y-o-Y Growth Projections by Load, 2023 to 2033

Figure 134: South Asia Pacific Market Attractiveness Analysis by Load, 2023 to 2033

Figure 135: South Asia Pacific Market Share and BPS Analysis by Max. Temperature- 2023 to 2033

Figure 136: South Asia Pacific Market Y-o-Y Growth Projections by Max. Temperature, 2023 to 2033

Figure 137: South Asia Pacific Market Attractiveness Analysis by Max. Temperature, 2023 to 2033

Figure 138: South Asia Pacific Market Share and BPS Analysis by Application- 2023 to 2033

Figure 139: South Asia Pacific Market Y-o-Y Growth Projections by Application, 2023 to 2033

Figure 140: South Asia Pacific Market Attractiveness Analysis by Application, 2023 to 2033

Figure 141: South Asia Pacific Market Share and BPS Analysis by Sales Channel- 2023 to 2033

Figure 142: South Asia Pacific Market Y-o-Y Growth Projections by Sales Channel, 2023 to 2033

Figure 143: South Asia Pacific Market Attractiveness Analysis by Sales Channel, 2023 to 2033

Figure 144: South Asia Pacific Market Share and BPS Analysis by Region- 2023 to 2033

Figure 145: South Asia Pacific Market Y-o-Y Growth Projections by Region, 2023 to 2033

Figure 146: South Asia Pacific Market Attractiveness Analysis by Region, 2023 to 2033

Figure 147: MEA Market Share and BPS Analysis by Country- 2023 to 2033

Figure 148: MEA Market Y-o-Y Growth Projections by Country, 2023 to 2033

Figure 149: MEA Market Attractiveness Analysis by Country, 2023 to 2033

Figure 150: MEA Market Share and BPS Analysis by Type- 2023 to 2033

Figure 151: MEA Market Y-o-Y Growth Projections by Type, 2023 to 2033

Figure 152: MEA Market Attractiveness Analysis by Type, 2023 to 2033

Figure 153: MEA Market Share and BPS Analysis by Automation Type- 2023 to 2033

Figure 154: MEA Market Y-o-Y Growth Projections by Automation Type, 2023 to 2033

Figure 155: MEA Market Attractiveness Analysis by Automation Type, 2023 to 2033

Figure 156: MEA Market Share and BPS Analysis by Load- 2023 to 2033

Figure 157: MEA Market Y-o-Y Growth Projections by Load, 2023 to 2033

Figure 158: MEA Market Attractiveness Analysis by Load, 2023 to 2033

Figure 159: MEA Market Share and BPS Analysis by Max. Temperature- 2023 to 2033

Figure 160: MEA Market Y-o-Y Growth Projections by Max. Temperature, 2023 to 2033

Figure 161: MEA Market Attractiveness Analysis by Max. Temperature, 2023 to 2033

Figure 162: MEA Market Share and BPS Analysis by Application- 2023 to 2033

Figure 163: MEA Market Y-o-Y Growth Projections by Application, 2023 to 2033

Figure 164: MEA Market Attractiveness Analysis by Application, 2023 to 2033

Figure 165: MEA Market Share and BPS Analysis by Sales Channel- 2023 to 2033

Figure 166: MEA Market Y-o-Y Growth Projections by Sales Channel, 2023 to 2033

Figure 167: MEA Market Attractiveness Analysis by Sales Channel, 2023 to 2033

Figure 168: MEA Market Share and BPS Analysis by Region- 2023 to 2033

Figure 169: MEA Market Y-o-Y Growth Projections by Region, 2023 to 2033

Figure 170: MEA Market Attractiveness Analysis by Region, 2023 to 2033

Frequently Asked Questions

What is the Growth Outlook for the Electric Pizza Oven Market?

The growth outlook for the electric pizza oven market is predicted to advance at a CAGR of 6.7% from 2023 to 2033.

Which Country Leads the Electric Pizza Oven Market?

The United States is anticipated to lead the electric pizza oven market during the forecast period.

What is the market valuation of Electric Pizza Oven in 2023?

The market valuation of the electric pizza oven market stands at USD 237.9 million in 2023.

How much Growth Potential does the Electric Pizza Oven hold?

The electric pizza oven market is likely to hold a valuation of USD 455.1 million by 2033.

Which segments are the key driver in the Electric Pizza Oven Market?

The deck ovens and automatic are the key segments in the electric pizza oven market.

Explore Commercial Cooking Equipment & Appliances Insights

Future Market Insights

Electric Pizza Oven Market