Methodology

Electric Glider Market Size and Share Forecast Outlook 2025 to 2035

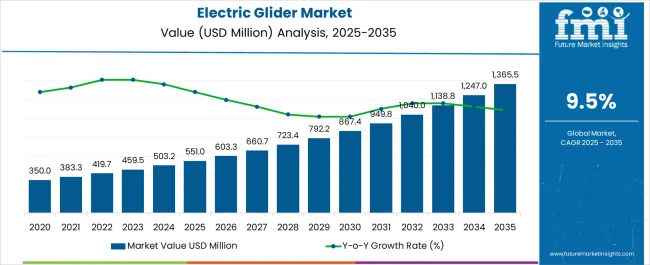
The Electric Glider Market is estimated to be valued at USD 551.0 million in 2025 and is projected to reach USD 1365.5 million by 2035, registering a compound annual growth rate (CAGR) of 9.5% over the forecast period.
Quick Stats for Electric Glider Market

  • Electric Glider Market Value (2025): USD 551.0 million
  • Electric Glider Market Forecast Value (2035): USD 1365.5 million
  • Electric Glider Market Forecast CAGR: 9.5%
  • Leading Segment in Electric Glider Market in 2025: Rotary Wing Electric Glider (55.0%)
  • Key Growth Regions in Electric Glider Market: North America, Asia-Pacific, Europe
  • Top Key Players in Electric Glider Market: Pipistrel, Bye Aerospace, e-Genius, eFlyer 2, LZ Design, Yuneec International, Pipistrel Vertical Solutions
Electric Glider Market Market Value Analysis

Electric Glider Market Key Takeaways

Metric Value
Electric Glider Market Estimated Value in (2025 E) USD 551.0 million
Electric Glider Market Forecast Value in (2035 F) USD 1365.5 million
Forecast CAGR (2025 to 2035) 9.5%

Why is the Electric Glider Market Growing?

The Electric Glider market is experiencing significant growth driven by the increasing demand for sustainable and efficient aerial mobility solutions. The future outlook for this market is shaped by advancements in electric propulsion technology, lightweight materials, and battery efficiency, which collectively enhance flight performance and operational range. Growing environmental awareness and stringent emission regulations are encouraging the adoption of electric gliders across commercial and recreational aviation sectors.

Investments in research and development are facilitating innovations that improve safety, reliability, and energy efficiency, making electric gliders a more viable alternative to conventional aircraft. Additionally, the expanding use of unmanned aerial vehicles and urban air mobility initiatives is creating new applications and revenue streams for electric gliders.

Rising demand for cost-effective and low-maintenance flight solutions, coupled with supportive government policies for green aviation, further strengthens market expansion As industries increasingly focus on reducing carbon footprints and optimizing operational efficiency, electric gliders are positioned for sustained adoption in both established and emerging markets.

Segmental Analysis

The electric glider market is segmented by platform, source, end-use industry, type, and geographic regions. By platform, electric glider market is divided into Rotary Wing Electric Glider and Fixed Wing Electric Glider. In terms of source, electric glider market is classified into Battery, Solar Cells, Fuel Cells, Ultra Capacitors, and Others. Based on end-use industry, electric glider market is segmented into Commercial and Military. By type, electric glider market is segmented into Manned and Unmanned. Regionally, the electric glider industry is classified into North America, Latin America, Western Europe, Eastern Europe, Balkan & Baltic Countries, Russia & Belarus, Central Asia, East Asia, South Asia & Pacific, and the Middle East & Africa.
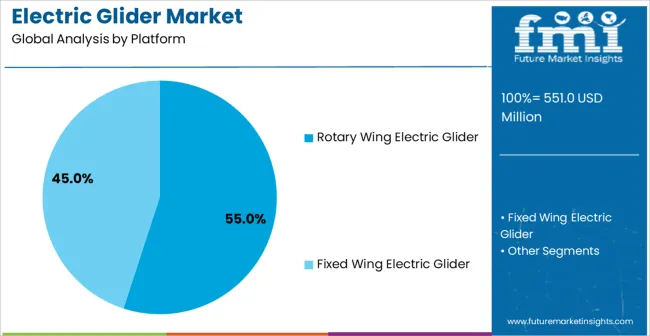
Insights into the Rotary Wing Electric Glider Platform Segment

Electric Glider Market Analysis By Platform

The rotary wing electric glider platform segment is projected to hold 55.0% of the market revenue share in 2025, establishing it as the leading platform. This growth is driven by the versatility and maneuverability of rotary wing designs, which enable vertical takeoff and landing as well as operation in constrained urban and remote environments.

The segment has benefited from advancements in lightweight materials and electric propulsion systems, which increase flight efficiency and payload capacity. Additionally, the capability to integrate modular systems and advanced control software enhances operational flexibility, making rotary wing electric gliders highly adaptable for various commercial and industrial applications.

Growing investments in urban air mobility and logistics solutions have further reinforced the adoption of rotary wing platforms Their ability to provide reliable, short-range flight solutions for commercial operations and specialized applications continues to support the segment’s leading position in the market.
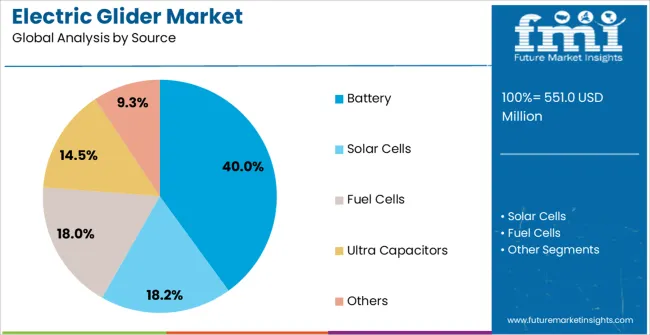
Insights into the Battery Source Segment

Electric Glider Market Analysis By Source

The battery source segment is expected to account for 40.0% of the Electric Glider market revenue in 2025, positioning it as the leading energy source. This growth is influenced by improvements in energy density, charging efficiency, and lifecycle performance of batteries, which enable longer flight durations and reduced operational costs.

The increasing focus on sustainability and the reduction of carbon emissions has accelerated the adoption of battery-powered propulsion in gliders. Technological advancements in battery management systems and modular battery design allow for safer, more reliable, and scalable energy solutions.

Additionally, regulatory support for green aviation initiatives and growing investments in electric propulsion research further drive the preference for battery-powered electric gliders The segment benefits from the rising demand for efficient and environmentally friendly aviation solutions across commercial and urban mobility applications.
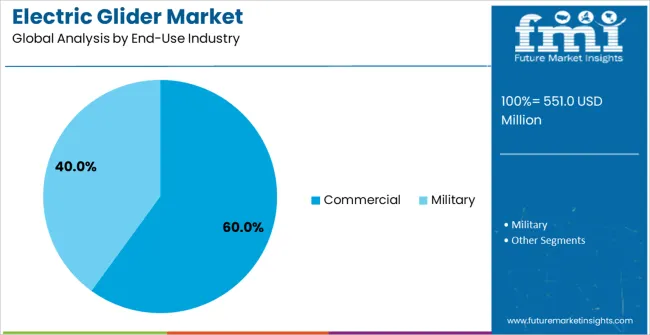
Insights into the Commercial End-Use Industry Segment

Electric Glider Market Analysis By End Use Industry

The commercial end-use industry segment is anticipated to account for 60.0% of the Electric Glider market revenue in 2025, making it the leading industry segment. This growth is propelled by the increasing demand for aerial solutions in commercial applications such as logistics, surveillance, urban air mobility, and passenger transport.

Electric gliders offer scalable and cost-effective flight solutions that can be tailored to the specific operational needs of commercial enterprises. The integration of advanced navigation systems and real-time monitoring enhances operational efficiency and safety, making them highly suitable for commercial deployments.

Furthermore, the growing emphasis on sustainable transportation and regulatory incentives for electric aviation solutions has accelerated the adoption of electric gliders in commercial sectors The ability to optimize operational costs while reducing environmental impact continues to drive the dominance of the commercial segment in the market.

Market Overview

Electric Glider Market: Introduction

An electric glider is basically an electric motor powered glider. In an electric glider, the source of electricity can be ultra-capacitors, solar cells, batteries, fuel cells and others. Electric Gliders are highly innovative products with respect to technology and functioning.

Generally, electric gliders are equipped with a propeller, which may be feathered (e.g. AMS-Flight Carat), fixed or retractable. Electric gliders are expected to find applications in many new electrical components, such as traction systems, structural components and light body composites.

This will provide economies of scale for the manufacturers of these components, which will decrease the manufacturing cost to some extent. This decrease in price is further anticipated to substantially boost the growth of the global electric glider market.

The global electric glider market growth is propelled by increasing usage of autonomous systems. Electric gliders have various advantages, such as low operational & maintenance cost, reduction in gas emissions and airport noise and others.

These advantages coupled with a tremendous increase in aircraft orders, bookings and deliveries are some of the other key factors supporting the growth of the global electric glider market demand over the forecast period.
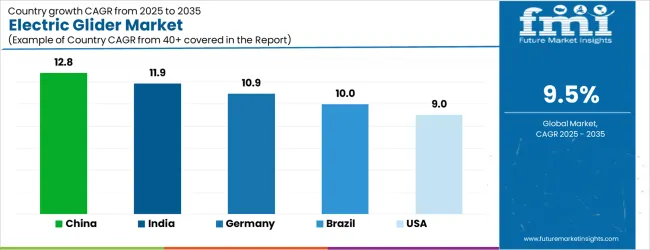
Analysis of Electric Glider Market By Key Countries

Electric Glider Market Cagr Analysis By Country
Country CAGR
China 12.8%
India 11.9%
Germany 10.9%
Brazil 10.0%
USA 9.0%
UK 8.1%
Japan 7.1%

Country-wise Analysis

The Electric Glider Market is expected to register a CAGR of 9.5% during the forecast period, exhibiting varied country level momentum. China leads with the highest CAGR of 12.8%, followed by India at 11.9%. Developed markets such as Germany, France, and the UK continue to expand steadily, while the USA is likely to grow at consistent rates. Japan posts the lowest CAGR at 7.1%, yet still underscores a broadly positive trajectory for the global Electric Glider Market. In 2024, Germany held a dominant revenue in the Western Europe market and is expected to grow with a CAGR of 10.9%. The USA Electric Glider Market is estimated to be valued at USD 190.8 million in 2025 and is anticipated to reach a valuation of USD 190.8 million by 2035. Sales are projected to rise at a CAGR of 0.0% over the forecast period between 2025 and 2035. While Japan and South Korea markets are estimated to be valued at USD 28.6 million and USD 13.8 million respectively in 2025.
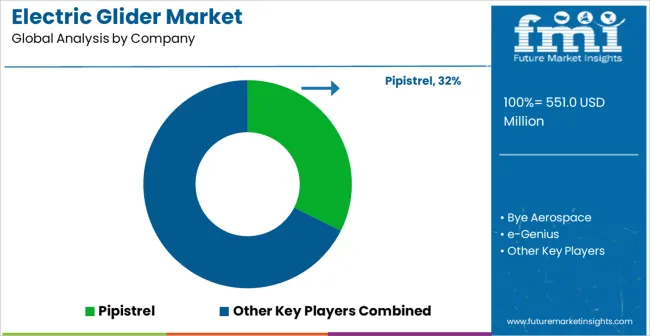
Key Players in the Electric Glider Market

Electric Glider Market Analysis By Company
  • Pipistrel
  • Bye Aerospace
  • e-Genius
  • eFlyer 2
  • LZ Design
  • Yuneec International
  • Pipistrel Vertical Solutions

Scope of the Report

Item Value
Quantitative Units USD 551.0 Million
Platform Rotary Wing Electric Glider and Fixed Wing Electric Glider
Source Battery, Solar Cells, Fuel Cells, Ultra Capacitors, and Others
End-Use Industry Commercial and Military
Type Manned and Unmanned
Regions Covered North America, Europe, Asia-Pacific, Latin America, Middle East & Africa
Country Covered United States, Canada, Germany, France, United Kingdom, China, Japan, India, Brazil, South Africa
Key Companies Profiled Pipistrel, Bye Aerospace, e-Genius, eFlyer 2, LZ Design, Yuneec International, and Pipistrel Vertical Solutions

Electric Glider Market by Segments

Platform:

  • Rotary Wing Electric Glider
  • Fixed Wing Electric Glider

Source:

  • Battery
  • Solar Cells
  • Fuel Cells
  • Ultra Capacitors
  • Others

End-Use Industry:

  • Commercial
  • Military

Type:

  • Manned
  • Unmanned

Region:

  • North America
    • USA
    • Canada
    • Mexico
  • Latin America
    • Brazil
    • Chile
    • Rest of Latin America
  • Western Europe
    • Germany
    • UK
    • Italy
    • Spain
    • France
    • Nordic
    • BENELUX
    • Rest of Western Europe
  • Eastern Europe
    • Russia
    • Poland
    • Hungary
    • Balkan & Baltic
    • Rest of Eastern Europe
  • East Asia
    • China
    • Japan
    • South Korea
  • South Asia and Pacific
    • India
    • ASEAN
    • Australia & New Zealand
    • Rest of South Asia and Pacific
  • Middle East & Africa
    • Kingdom of Saudi Arabia
    • Other GCC Countries
    • Turkiye
    • South Africa
    • Other African Union
    • Rest of Middle East & Africa

Frequently Asked Questions

How big is the electric glider market in 2025?

The global electric glider market is estimated to be valued at USD 551.0 million in 2025.

What will be the size of electric glider market in 2035?

The market size for the electric glider market is projected to reach USD 1,365.5 million by 2035.

How much will be the electric glider market growth between 2025 and 2035?

The electric glider market is expected to grow at a 9.5% CAGR between 2025 and 2035.

What are the key product types in the electric glider market?

The key product types in electric glider market are rotary wing electric glider and fixed wing electric glider.

Which source segment to contribute significant share in the electric glider market in 2025?

In terms of source, battery segment to command 40.0% share in the electric glider market in 2025.

Table of Content

  1. Executive Summary
    • Global Market Outlook
    • Demand-side Trends
    • Supply-side Trends
    • Technology Roadmap Analysis
    • Analysis and Recommendations
  2. Market Overview
    • Market Coverage / Taxonomy
    • Market Definition / Scope / Limitations
  3. Market Background
    • Market Dynamics
      • Drivers
      • Restraints
      • Opportunity
      • Trends
    • Scenario Forecast
      • Demand in Optimistic Scenario
      • Demand in Likely Scenario
      • Demand in Conservative Scenario
    • Opportunity Map Analysis
    • Product Life Cycle Analysis
    • Supply Chain Analysis
    • Investment Feasibility Matrix
    • Value Chain Analysis
    • PESTLE and Porter’s Analysis
    • Regulatory Landscape
    • Regional Parent Market Outlook
    • Production and Consumption Statistics
    • Import and Export Statistics
  4. Global Market Analysis 2020 to 2024 and Forecast, 2025 to 2035
    • Historical Market Size Value (USD Million) Analysis, 2020 to 2024
    • Current and Future Market Size Value (USD Million) Projections, 2025 to 2035
      • Y-o-Y Growth Trend Analysis
      • Absolute $ Opportunity Analysis
  5. Global Market Pricing Analysis 2020 to 2024 and Forecast 2025 to 2035
  6. Global Market Analysis 2020 to 2024 and Forecast 2025 to 2035, By Platform
    • Introduction / Key Findings
    • Historical Market Size Value (USD Million) Analysis By Platform , 2020 to 2024
    • Current and Future Market Size Value (USD Million) Analysis and Forecast By Platform , 2025 to 2035
      • Rotary Wing Electric Glider
      • Fixed Wing Electric Glider
    • Y-o-Y Growth Trend Analysis By Platform , 2020 to 2024
    • Absolute $ Opportunity Analysis By Platform , 2025 to 2035
  7. Global Market Analysis 2020 to 2024 and Forecast 2025 to 2035, By Source
    • Introduction / Key Findings
    • Historical Market Size Value (USD Million) Analysis By Source, 2020 to 2024
    • Current and Future Market Size Value (USD Million) Analysis and Forecast By Source, 2025 to 2035
      • Battery
      • Solar Cells
      • Fuel Cells
      • Ultra Capacitors
      • Others
    • Y-o-Y Growth Trend Analysis By Source, 2020 to 2024
    • Absolute $ Opportunity Analysis By Source, 2025 to 2035
  8. Global Market Analysis 2020 to 2024 and Forecast 2025 to 2035, By End-Use Industry
    • Introduction / Key Findings
    • Historical Market Size Value (USD Million) Analysis By End-Use Industry, 2020 to 2024
    • Current and Future Market Size Value (USD Million) Analysis and Forecast By End-Use Industry, 2025 to 2035
      • Commercial
      • Military
    • Y-o-Y Growth Trend Analysis By End-Use Industry, 2020 to 2024
    • Absolute $ Opportunity Analysis By End-Use Industry, 2025 to 2035
  9. Global Market Analysis 2020 to 2024 and Forecast 2025 to 2035, By Type
    • Introduction / Key Findings
    • Historical Market Size Value (USD Million) Analysis By Type, 2020 to 2024
    • Current and Future Market Size Value (USD Million) Analysis and Forecast By Type, 2025 to 2035
      • Manned
      • Unmanned
    • Y-o-Y Growth Trend Analysis By Type, 2020 to 2024
    • Absolute $ Opportunity Analysis By Type, 2025 to 2035
  10. Global Market Analysis 2020 to 2024 and Forecast 2025 to 2035, By Region
    • Introduction
    • Historical Market Size Value (USD Million) Analysis By Region, 2020 to 2024
    • Current Market Size Value (USD Million) Analysis and Forecast By Region, 2025 to 2035
      • North America
      • Latin America
      • Western Europe
      • Eastern Europe
      • East Asia
      • South Asia and Pacific
      • Middle East & Africa
    • Market Attractiveness Analysis By Region
  11. North America Market Analysis 2020 to 2024 and Forecast 2025 to 2035, By Country
    • Historical Market Size Value (USD Million) Trend Analysis By Market Taxonomy, 2020 to 2024
    • Market Size Value (USD Million) Forecast By Market Taxonomy, 2025 to 2035
      • By Country
        • USA
        • Canada
        • Mexico
      • By Platform
      • By Source
      • By End-Use Industry
      • By Type
    • Market Attractiveness Analysis
      • By Country
      • By Platform
      • By Source
      • By End-Use Industry
      • By Type
    • Key Takeaways
  12. Latin America Market Analysis 2020 to 2024 and Forecast 2025 to 2035, By Country
    • Historical Market Size Value (USD Million) Trend Analysis By Market Taxonomy, 2020 to 2024
    • Market Size Value (USD Million) Forecast By Market Taxonomy, 2025 to 2035
      • By Country
        • Brazil
        • Chile
        • Rest of Latin America
      • By Platform
      • By Source
      • By End-Use Industry
      • By Type
    • Market Attractiveness Analysis
      • By Country
      • By Platform
      • By Source
      • By End-Use Industry
      • By Type
    • Key Takeaways
  13. Western Europe Market Analysis 2020 to 2024 and Forecast 2025 to 2035, By Country
    • Historical Market Size Value (USD Million) Trend Analysis By Market Taxonomy, 2020 to 2024
    • Market Size Value (USD Million) Forecast By Market Taxonomy, 2025 to 2035
      • By Country
        • Germany
        • UK
        • Italy
        • Spain
        • France
        • Nordic
        • BENELUX
        • Rest of Western Europe
      • By Platform
      • By Source
      • By End-Use Industry
      • By Type
    • Market Attractiveness Analysis
      • By Country
      • By Platform
      • By Source
      • By End-Use Industry
      • By Type
    • Key Takeaways
  14. Eastern Europe Market Analysis 2020 to 2024 and Forecast 2025 to 2035, By Country
    • Historical Market Size Value (USD Million) Trend Analysis By Market Taxonomy, 2020 to 2024
    • Market Size Value (USD Million) Forecast By Market Taxonomy, 2025 to 2035
      • By Country
        • Russia
        • Poland
        • Hungary
        • Balkan & Baltic
        • Rest of Eastern Europe
      • By Platform
      • By Source
      • By End-Use Industry
      • By Type
    • Market Attractiveness Analysis
      • By Country
      • By Platform
      • By Source
      • By End-Use Industry
      • By Type
    • Key Takeaways
  15. East Asia Market Analysis 2020 to 2024 and Forecast 2025 to 2035, By Country
    • Historical Market Size Value (USD Million) Trend Analysis By Market Taxonomy, 2020 to 2024
    • Market Size Value (USD Million) Forecast By Market Taxonomy, 2025 to 2035
      • By Country
        • China
        • Japan
        • South Korea
      • By Platform
      • By Source
      • By End-Use Industry
      • By Type
    • Market Attractiveness Analysis
      • By Country
      • By Platform
      • By Source
      • By End-Use Industry
      • By Type
    • Key Takeaways
  16. South Asia and Pacific Market Analysis 2020 to 2024 and Forecast 2025 to 2035, By Country
    • Historical Market Size Value (USD Million) Trend Analysis By Market Taxonomy, 2020 to 2024
    • Market Size Value (USD Million) Forecast By Market Taxonomy, 2025 to 2035
      • By Country
        • India
        • ASEAN
        • Australia & New Zealand
        • Rest of South Asia and Pacific
      • By Platform
      • By Source
      • By End-Use Industry
      • By Type
    • Market Attractiveness Analysis
      • By Country
      • By Platform
      • By Source
      • By End-Use Industry
      • By Type
    • Key Takeaways
  17. Middle East & Africa Market Analysis 2020 to 2024 and Forecast 2025 to 2035, By Country
    • Historical Market Size Value (USD Million) Trend Analysis By Market Taxonomy, 2020 to 2024
    • Market Size Value (USD Million) Forecast By Market Taxonomy, 2025 to 2035
      • By Country
        • Kingdom of Saudi Arabia
        • Other GCC Countries
        • Turkiye
        • South Africa
        • Other African Union
        • Rest of Middle East & Africa
      • By Platform
      • By Source
      • By End-Use Industry
      • By Type
    • Market Attractiveness Analysis
      • By Country
      • By Platform
      • By Source
      • By End-Use Industry
      • By Type
    • Key Takeaways
  18. Key Countries Market Analysis
    • USA
      • Pricing Analysis
      • Market Share Analysis, 2024
        • By Platform
        • By Source
        • By End-Use Industry
        • By Type
    • Canada
      • Pricing Analysis
      • Market Share Analysis, 2024
        • By Platform
        • By Source
        • By End-Use Industry
        • By Type
    • Mexico
      • Pricing Analysis
      • Market Share Analysis, 2024
        • By Platform
        • By Source
        • By End-Use Industry
        • By Type
    • Brazil
      • Pricing Analysis
      • Market Share Analysis, 2024
        • By Platform
        • By Source
        • By End-Use Industry
        • By Type
    • Chile
      • Pricing Analysis
      • Market Share Analysis, 2024
        • By Platform
        • By Source
        • By End-Use Industry
        • By Type
    • Germany
      • Pricing Analysis
      • Market Share Analysis, 2024
        • By Platform
        • By Source
        • By End-Use Industry
        • By Type
    • UK
      • Pricing Analysis
      • Market Share Analysis, 2024
        • By Platform
        • By Source
        • By End-Use Industry
        • By Type
    • Italy
      • Pricing Analysis
      • Market Share Analysis, 2024
        • By Platform
        • By Source
        • By End-Use Industry
        • By Type
    • Spain
      • Pricing Analysis
      • Market Share Analysis, 2024
        • By Platform
        • By Source
        • By End-Use Industry
        • By Type
    • France
      • Pricing Analysis
      • Market Share Analysis, 2024
        • By Platform
        • By Source
        • By End-Use Industry
        • By Type
    • India
      • Pricing Analysis
      • Market Share Analysis, 2024
        • By Platform
        • By Source
        • By End-Use Industry
        • By Type
    • ASEAN
      • Pricing Analysis
      • Market Share Analysis, 2024
        • By Platform
        • By Source
        • By End-Use Industry
        • By Type
    • Australia & New Zealand
      • Pricing Analysis
      • Market Share Analysis, 2024
        • By Platform
        • By Source
        • By End-Use Industry
        • By Type
    • China
      • Pricing Analysis
      • Market Share Analysis, 2024
        • By Platform
        • By Source
        • By End-Use Industry
        • By Type
    • Japan
      • Pricing Analysis
      • Market Share Analysis, 2024
        • By Platform
        • By Source
        • By End-Use Industry
        • By Type
    • South Korea
      • Pricing Analysis
      • Market Share Analysis, 2024
        • By Platform
        • By Source
        • By End-Use Industry
        • By Type
    • Russia
      • Pricing Analysis
      • Market Share Analysis, 2024
        • By Platform
        • By Source
        • By End-Use Industry
        • By Type
    • Poland
      • Pricing Analysis
      • Market Share Analysis, 2024
        • By Platform
        • By Source
        • By End-Use Industry
        • By Type
    • Hungary
      • Pricing Analysis
      • Market Share Analysis, 2024
        • By Platform
        • By Source
        • By End-Use Industry
        • By Type
    • Kingdom of Saudi Arabia
      • Pricing Analysis
      • Market Share Analysis, 2024
        • By Platform
        • By Source
        • By End-Use Industry
        • By Type
    • Turkiye
      • Pricing Analysis
      • Market Share Analysis, 2024
        • By Platform
        • By Source
        • By End-Use Industry
        • By Type
    • South Africa
      • Pricing Analysis
      • Market Share Analysis, 2024
        • By Platform
        • By Source
        • By End-Use Industry
        • By Type
  19. Market Structure Analysis
    • Competition Dashboard
    • Competition Benchmarking
    • Market Share Analysis of Top Players
      • By Regional
      • By Platform
      • By Source
      • By End-Use Industry
      • By Type
  20. Competition Analysis
    • Competition Deep Dive
      • Pipistrel
        • Overview
        • Product Portfolio
        • Profitability by Market Segments (Product/Age /Sales Channel/Region)
        • Sales Footprint
        • Strategy Overview
          • Marketing Strategy
          • Product Strategy
          • Channel Strategy
      • Bye Aerospace
      • e-Genius
      • eFlyer 2
      • LZ Design
      • Yuneec International
      • Pipistrel Vertical Solutions
  21. Assumptions & Acronyms Used
  22. Research Methodology

List of Tables

  • Table 1: Global Market Value (USD Million) Forecast by Region, 2020-2035
  • Table 2: Global Market Value (USD Million) Forecast by Platform , 2020-2035
  • Table 3: Global Market Value (USD Million) Forecast by Source, 2020-2035
  • Table 4: Global Market Value (USD Million) Forecast by End-Use Industry, 2020-2035
  • Table 5: Global Market Value (USD Million) Forecast by Type, 2020-2035
  • Table 6: North America Market Value (USD Million) Forecast by Country, 2020-2035
  • Table 7: North America Market Value (USD Million) Forecast by Platform , 2020-2035
  • Table 8: North America Market Value (USD Million) Forecast by Source, 2020-2035
  • Table 9: North America Market Value (USD Million) Forecast by End-Use Industry, 2020-2035
  • Table 10: North America Market Value (USD Million) Forecast by Type, 2020-2035
  • Table 11: Latin America Market Value (USD Million) Forecast by Country, 2020-2035
  • Table 12: Latin America Market Value (USD Million) Forecast by Platform , 2020-2035
  • Table 13: Latin America Market Value (USD Million) Forecast by Source, 2020-2035
  • Table 14: Latin America Market Value (USD Million) Forecast by End-Use Industry, 2020-2035
  • Table 15: Latin America Market Value (USD Million) Forecast by Type, 2020-2035
  • Table 16: Western Europe Market Value (USD Million) Forecast by Country, 2020-2035
  • Table 17: Western Europe Market Value (USD Million) Forecast by Platform , 2020-2035
  • Table 18: Western Europe Market Value (USD Million) Forecast by Source, 2020-2035
  • Table 19: Western Europe Market Value (USD Million) Forecast by End-Use Industry, 2020-2035
  • Table 20: Western Europe Market Value (USD Million) Forecast by Type, 2020-2035
  • Table 21: Eastern Europe Market Value (USD Million) Forecast by Country, 2020-2035
  • Table 22: Eastern Europe Market Value (USD Million) Forecast by Platform , 2020-2035
  • Table 23: Eastern Europe Market Value (USD Million) Forecast by Source, 2020-2035
  • Table 24: Eastern Europe Market Value (USD Million) Forecast by End-Use Industry, 2020-2035
  • Table 25: Eastern Europe Market Value (USD Million) Forecast by Type, 2020-2035
  • Table 26: East Asia Market Value (USD Million) Forecast by Country, 2020-2035
  • Table 27: East Asia Market Value (USD Million) Forecast by Platform , 2020-2035
  • Table 28: East Asia Market Value (USD Million) Forecast by Source, 2020-2035
  • Table 29: East Asia Market Value (USD Million) Forecast by End-Use Industry, 2020-2035
  • Table 30: East Asia Market Value (USD Million) Forecast by Type, 2020-2035
  • Table 31: South Asia and Pacific Market Value (USD Million) Forecast by Country, 2020-2035
  • Table 32: South Asia and Pacific Market Value (USD Million) Forecast by Platform , 2020-2035
  • Table 33: South Asia and Pacific Market Value (USD Million) Forecast by Source, 2020-2035
  • Table 34: South Asia and Pacific Market Value (USD Million) Forecast by End-Use Industry, 2020-2035
  • Table 35: South Asia and Pacific Market Value (USD Million) Forecast by Type, 2020-2035
  • Table 36: Middle East & Africa Market Value (USD Million) Forecast by Country, 2020-2035
  • Table 37: Middle East & Africa Market Value (USD Million) Forecast by Platform , 2020-2035
  • Table 38: Middle East & Africa Market Value (USD Million) Forecast by Source, 2020-2035
  • Table 39: Middle East & Africa Market Value (USD Million) Forecast by End-Use Industry, 2020-2035
  • Table 40: Middle East & Africa Market Value (USD Million) Forecast by Type, 2020-2035

List of Figures

  • Figure 1: Global Market Pricing Analysis
  • Figure 2: Global Market Value (USD Million) Forecast 2020-2035
  • Figure 3: Global Market Value Share and BPS Analysis by Platform , 2025 and 2035
  • Figure 4: Global Market Y-o-Y Growth Comparison by Platform , 2025-2035
  • Figure 5: Global Market Attractiveness Analysis by Platform
  • Figure 6: Global Market Value Share and BPS Analysis by Source, 2025 and 2035
  • Figure 7: Global Market Y-o-Y Growth Comparison by Source, 2025-2035
  • Figure 8: Global Market Attractiveness Analysis by Source
  • Figure 9: Global Market Value Share and BPS Analysis by End-Use Industry, 2025 and 2035
  • Figure 10: Global Market Y-o-Y Growth Comparison by End-Use Industry, 2025-2035
  • Figure 11: Global Market Attractiveness Analysis by End-Use Industry
  • Figure 12: Global Market Value Share and BPS Analysis by Type, 2025 and 2035
  • Figure 13: Global Market Y-o-Y Growth Comparison by Type, 2025-2035
  • Figure 14: Global Market Attractiveness Analysis by Type
  • Figure 15: Global Market Value (USD Million) Share and BPS Analysis by Region, 2025 and 2035
  • Figure 16: Global Market Y-o-Y Growth Comparison by Region, 2025-2035
  • Figure 17: Global Market Attractiveness Analysis by Region
  • Figure 18: North America Market Incremental Dollar Opportunity, 2025-2035
  • Figure 19: Latin America Market Incremental Dollar Opportunity, 2025-2035
  • Figure 20: Western Europe Market Incremental Dollar Opportunity, 2025-2035
  • Figure 21: Eastern Europe Market Incremental Dollar Opportunity, 2025-2035
  • Figure 22: East Asia Market Incremental Dollar Opportunity, 2025-2035
  • Figure 23: South Asia and Pacific Market Incremental Dollar Opportunity, 2025-2035
  • Figure 24: Middle East & Africa Market Incremental Dollar Opportunity, 2025-2035
  • Figure 25: North America Market Value Share and BPS Analysis by Country, 2025 and 2035
  • Figure 26: North America Market Value Share and BPS Analysis by Platform , 2025 and 2035
  • Figure 27: North America Market Y-o-Y Growth Comparison by Platform , 2025-2035
  • Figure 28: North America Market Attractiveness Analysis by Platform
  • Figure 29: North America Market Value Share and BPS Analysis by Source, 2025 and 2035
  • Figure 30: North America Market Y-o-Y Growth Comparison by Source, 2025-2035
  • Figure 31: North America Market Attractiveness Analysis by Source
  • Figure 32: North America Market Value Share and BPS Analysis by End-Use Industry, 2025 and 2035
  • Figure 33: North America Market Y-o-Y Growth Comparison by End-Use Industry, 2025-2035
  • Figure 34: North America Market Attractiveness Analysis by End-Use Industry
  • Figure 35: North America Market Value Share and BPS Analysis by Type, 2025 and 2035
  • Figure 36: North America Market Y-o-Y Growth Comparison by Type, 2025-2035
  • Figure 37: North America Market Attractiveness Analysis by Type
  • Figure 38: Latin America Market Value Share and BPS Analysis by Country, 2025 and 2035
  • Figure 39: Latin America Market Value Share and BPS Analysis by Platform , 2025 and 2035
  • Figure 40: Latin America Market Y-o-Y Growth Comparison by Platform , 2025-2035
  • Figure 41: Latin America Market Attractiveness Analysis by Platform
  • Figure 42: Latin America Market Value Share and BPS Analysis by Source, 2025 and 2035
  • Figure 43: Latin America Market Y-o-Y Growth Comparison by Source, 2025-2035
  • Figure 44: Latin America Market Attractiveness Analysis by Source
  • Figure 45: Latin America Market Value Share and BPS Analysis by End-Use Industry, 2025 and 2035
  • Figure 46: Latin America Market Y-o-Y Growth Comparison by End-Use Industry, 2025-2035
  • Figure 47: Latin America Market Attractiveness Analysis by End-Use Industry
  • Figure 48: Latin America Market Value Share and BPS Analysis by Type, 2025 and 2035
  • Figure 49: Latin America Market Y-o-Y Growth Comparison by Type, 2025-2035
  • Figure 50: Latin America Market Attractiveness Analysis by Type
  • Figure 51: Western Europe Market Value Share and BPS Analysis by Country, 2025 and 2035
  • Figure 52: Western Europe Market Value Share and BPS Analysis by Platform , 2025 and 2035
  • Figure 53: Western Europe Market Y-o-Y Growth Comparison by Platform , 2025-2035
  • Figure 54: Western Europe Market Attractiveness Analysis by Platform
  • Figure 55: Western Europe Market Value Share and BPS Analysis by Source, 2025 and 2035
  • Figure 56: Western Europe Market Y-o-Y Growth Comparison by Source, 2025-2035
  • Figure 57: Western Europe Market Attractiveness Analysis by Source
  • Figure 58: Western Europe Market Value Share and BPS Analysis by End-Use Industry, 2025 and 2035
  • Figure 59: Western Europe Market Y-o-Y Growth Comparison by End-Use Industry, 2025-2035
  • Figure 60: Western Europe Market Attractiveness Analysis by End-Use Industry
  • Figure 61: Western Europe Market Value Share and BPS Analysis by Type, 2025 and 2035
  • Figure 62: Western Europe Market Y-o-Y Growth Comparison by Type, 2025-2035
  • Figure 63: Western Europe Market Attractiveness Analysis by Type
  • Figure 64: Eastern Europe Market Value Share and BPS Analysis by Country, 2025 and 2035
  • Figure 65: Eastern Europe Market Value Share and BPS Analysis by Platform , 2025 and 2035
  • Figure 66: Eastern Europe Market Y-o-Y Growth Comparison by Platform , 2025-2035
  • Figure 67: Eastern Europe Market Attractiveness Analysis by Platform
  • Figure 68: Eastern Europe Market Value Share and BPS Analysis by Source, 2025 and 2035
  • Figure 69: Eastern Europe Market Y-o-Y Growth Comparison by Source, 2025-2035
  • Figure 70: Eastern Europe Market Attractiveness Analysis by Source
  • Figure 71: Eastern Europe Market Value Share and BPS Analysis by End-Use Industry, 2025 and 2035
  • Figure 72: Eastern Europe Market Y-o-Y Growth Comparison by End-Use Industry, 2025-2035
  • Figure 73: Eastern Europe Market Attractiveness Analysis by End-Use Industry
  • Figure 74: Eastern Europe Market Value Share and BPS Analysis by Type, 2025 and 2035
  • Figure 75: Eastern Europe Market Y-o-Y Growth Comparison by Type, 2025-2035
  • Figure 76: Eastern Europe Market Attractiveness Analysis by Type
  • Figure 77: East Asia Market Value Share and BPS Analysis by Country, 2025 and 2035
  • Figure 78: East Asia Market Value Share and BPS Analysis by Platform , 2025 and 2035
  • Figure 79: East Asia Market Y-o-Y Growth Comparison by Platform , 2025-2035
  • Figure 80: East Asia Market Attractiveness Analysis by Platform
  • Figure 81: East Asia Market Value Share and BPS Analysis by Source, 2025 and 2035
  • Figure 82: East Asia Market Y-o-Y Growth Comparison by Source, 2025-2035
  • Figure 83: East Asia Market Attractiveness Analysis by Source
  • Figure 84: East Asia Market Value Share and BPS Analysis by End-Use Industry, 2025 and 2035
  • Figure 85: East Asia Market Y-o-Y Growth Comparison by End-Use Industry, 2025-2035
  • Figure 86: East Asia Market Attractiveness Analysis by End-Use Industry
  • Figure 87: East Asia Market Value Share and BPS Analysis by Type, 2025 and 2035
  • Figure 88: East Asia Market Y-o-Y Growth Comparison by Type, 2025-2035
  • Figure 89: East Asia Market Attractiveness Analysis by Type
  • Figure 90: South Asia and Pacific Market Value Share and BPS Analysis by Country, 2025 and 2035
  • Figure 91: South Asia and Pacific Market Value Share and BPS Analysis by Platform , 2025 and 2035
  • Figure 92: South Asia and Pacific Market Y-o-Y Growth Comparison by Platform , 2025-2035
  • Figure 93: South Asia and Pacific Market Attractiveness Analysis by Platform
  • Figure 94: South Asia and Pacific Market Value Share and BPS Analysis by Source, 2025 and 2035
  • Figure 95: South Asia and Pacific Market Y-o-Y Growth Comparison by Source, 2025-2035
  • Figure 96: South Asia and Pacific Market Attractiveness Analysis by Source
  • Figure 97: South Asia and Pacific Market Value Share and BPS Analysis by End-Use Industry, 2025 and 2035
  • Figure 98: South Asia and Pacific Market Y-o-Y Growth Comparison by End-Use Industry, 2025-2035
  • Figure 99: South Asia and Pacific Market Attractiveness Analysis by End-Use Industry
  • Figure 100: South Asia and Pacific Market Value Share and BPS Analysis by Type, 2025 and 2035
  • Figure 101: South Asia and Pacific Market Y-o-Y Growth Comparison by Type, 2025-2035
  • Figure 102: South Asia and Pacific Market Attractiveness Analysis by Type
  • Figure 103: Middle East & Africa Market Value Share and BPS Analysis by Country, 2025 and 2035
  • Figure 104: Middle East & Africa Market Value Share and BPS Analysis by Platform , 2025 and 2035
  • Figure 105: Middle East & Africa Market Y-o-Y Growth Comparison by Platform , 2025-2035
  • Figure 106: Middle East & Africa Market Attractiveness Analysis by Platform
  • Figure 107: Middle East & Africa Market Value Share and BPS Analysis by Source, 2025 and 2035
  • Figure 108: Middle East & Africa Market Y-o-Y Growth Comparison by Source, 2025-2035
  • Figure 109: Middle East & Africa Market Attractiveness Analysis by Source
  • Figure 110: Middle East & Africa Market Value Share and BPS Analysis by End-Use Industry, 2025 and 2035
  • Figure 111: Middle East & Africa Market Y-o-Y Growth Comparison by End-Use Industry, 2025-2035
  • Figure 112: Middle East & Africa Market Attractiveness Analysis by End-Use Industry
  • Figure 113: Middle East & Africa Market Value Share and BPS Analysis by Type, 2025 and 2035
  • Figure 114: Middle East & Africa Market Y-o-Y Growth Comparison by Type, 2025-2035
  • Figure 115: Middle East & Africa Market Attractiveness Analysis by Type
  • Figure 116: Global Market - Tier Structure Analysis
  • Figure 117: Global Market - Company Share Analysis
Dashboard
Dashboard
Dashboard
Dashboard
Dashboard
Dashboard

Our Research Products

Full Research Suite

The "Full Research Suite" delivers actionable market intel, deep dives on markets or technologies, so clients act faster, cut risk, and unlock growth.

Competitor Leaderboard Report

The Leaderboard benchmarks and ranks top vendors, classifying them as Established Leaders, Leading Challengers, or Disruptors & Challengers.

Future Leaders Index

Locates where complements amplify value and substitutes erode it, forecasting net impact by horizon

Market Data & Forecasts

We deliver granular, decision-grade intel: market sizing, 5-year forecasts, pricing, adoption, usage, revenue, and operational KPIs—plus competitor tracking, regulation, and value chains—across 60 countries broadly.

Market Focus Report

Spot the shifts before they hit your P&L. We track inflection points, adoption curves, pricing moves, and ecosystem plays to show where demand is heading, why it is changing, and what to do next across high-growth markets and disruptive tech

Survey Report

Real-time reads of user behavior. We track shifting priorities, perceptions of today’s and next-gen services, and provider experience, then pace how fast tech moves from trial to adoption, blending buyer, consumer, and channel inputs with social signals (#WhySwitch, #UX).

Bespoke Reports

Partner with our analyst team to build a custom report designed around your business priorities. From analysing market trends to assessing competitors or crafting bespoke datasets, we tailor insights to your needs.

Supplier Intelligence

Discovery & Profiling

Capacity & Footprint

Performance & Risk

Compliance & Governance

Commercial Readiness

Who Supplies Whom

Scorecards & Shortlists

Playbooks & Docs

Category Intelligence

Definition & Scope

Demand & Use Cases

Cost Drivers

Market Structure

Supply Chain Map

Trade & Policy

Operating Norms

Deliverables

Buyer Intelligence

Account Basics

Spend & Scope

Procurement Model

Vendor Requirements

Terms & Policies

Entry Strategy

Pain Points & Triggers

Outputs

Pricing Analysis

Benchmarks

Trends

Should-Cost

Indexation

Landed Cost

Commercial Terms

Deliverables

Brand Analysis

Positioning & Value Prop

Share & Presence

Customer Evidence

Go-to-Market

Digital & Reputation

Compliance & Trust

KPIs & Gaps

Outputs

Full Research Suite comprises of:

Market outlook & trends analysis

Market outlook & trends analysis

Interviews & case studies

Interviews & case studies

Strategic recommendations

Strategic recommendations

Vendor profiles & capabilities analysis

Vendor profiles & capabilities analysis

5-year forecasts

5-year forecasts

8 regions and 60+ country-level data splits

8 regions and 60+ country-level data splits

Market segment data splits

Market segment data splits

12 months of continuous data updates

12 months of continuous data updates

DELIVERED AS:

PDF EXCEL ONLINE

Full Research Suite


$5000

$7500

$10000

Buy Report Now
Similar Industry Reports

Similar Industry Reports

Electric Aircraft Onboard Sensors Market

Electric Aircraft Onboard Sensors Market Size and Share Forecast Outlook 2025 to 2035

Electrical Label Market

Electrical Label Market Size and Share Forecast Outlook 2025 to 2035

Electric Round Sprinklers Market

Electric Round Sprinklers Market Size and Share Forecast Outlook 2025 to 2035

Electric Cloth Cutting Scissors Market

Electric Cloth Cutting Scissors Market Size and Share Forecast Outlook 2025 to 2035

Electrical Insulation Materials Market

Electrical Insulation Materials Market Size and Share Forecast Outlook 2025 to 2035

Electric Aircraft Sensors Market

Electric Aircraft Sensors Market Size and Share Forecast Outlook 2025 to 2035

Electric Traction Motor Market

Electric Traction Motor Market Forecast Outlook 2025 to 2035

Electric Vehicle Sensor Market

Electric Vehicle Sensor Market Forecast and Outlook 2025 to 2035

Electric Vehicle Motor Market

Electric Vehicle Motor Market Forecast and Outlook 2025 to 2035

Electric Off-Road ATVs & UTVs Market

Electric Off-Road ATVs & UTVs Market Size and Share Forecast Outlook 2025 to 2035

Electric Blind Rivet Gun Market

Electric Blind Rivet Gun Market Size and Share Forecast Outlook 2025 to 2035

Electric Fireplace Market

Electric Fireplace Market Size and Share Forecast Outlook 2025 to 2035

Electric Vehicle Battery Conditioners Market

Electric Vehicle Battery Conditioners Market Size and Share Forecast Outlook 2025 to 2035

Electric Power Steering Motors Market

Electric Power Steering Motors Market Size and Share Forecast Outlook 2025 to 2035

Electric Motor Market

Electric Motor Market Size and Share Forecast Outlook 2025 to 2035

Electric Gripper Market

Electric Gripper Market Size and Share Forecast Outlook 2025 to 2035

Electric Boat Market

Electric Boat Market Size and Share Forecast Outlook 2025 to 2035

Electric Bicycle Market

Electric Bicycle Market Size and Share Forecast Outlook 2025 to 2035

Electric Vehicle Transmission Market

Electric Vehicle Transmission Market Size and Share Forecast Outlook 2025 to 2035

Electrical Enclosure Market

Electrical Enclosure Market Size and Share Forecast Outlook 2025 to 2035

Future Market Insights

Electric Glider Market

Chat With MaRIA

Chat With

MaRIA

Hi There, I am MaRIA, Your Market Research Intelligence Assistant. How may I help you?