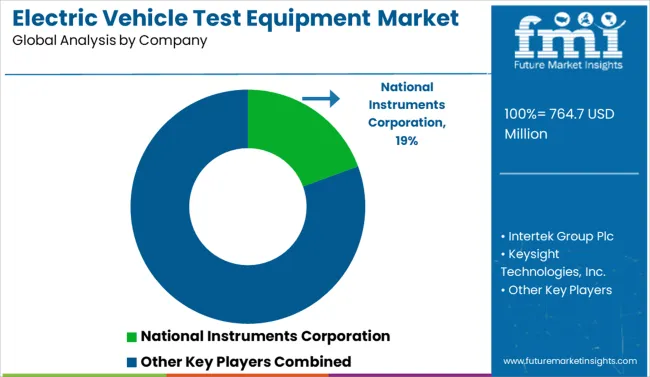
The Electric Vehicle Test Equipment Market is estimated to be valued at USD 764.7 million in 2025 and is projected to reach USD 1947.7 million by 2035, registering a compound annual growth rate (CAGR) of 9.8% over the forecast period.
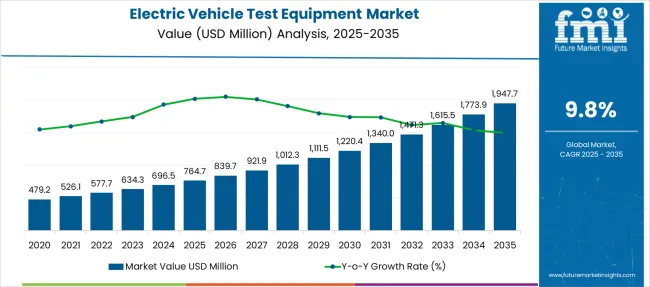
| Metric | Value |
|---|---|
| Electric Vehicle Test Equipment Market Estimated Value in (2025E) | USD 764.7 million |
| Electric Vehicle Test Equipment Market Forecast Value in (2035F) | USD 1947.7 million |
| Forecast CAGR (2025 to 2035) | 9.8% |
The electric vehicle test equipment market is expanding rapidly, driven by the accelerating transition to electrified transportation and increasing focus on vehicle safety, performance, and compliance. As EV adoption gains momentum globally, the demand for precise and efficient testing equipment to validate components, systems, and vehicle-level functionalities has surged.
Testing solutions are critical to ensuring battery efficiency, thermal performance, powertrain reliability, and adherence to evolving regulatory standards. Automakers and component suppliers are investing heavily in R&D, creating a fertile landscape for test equipment manufacturers offering advanced diagnostic, simulation, and validation tools.
Additionally, the emergence of new EV platforms and the diversification of powertrain architectures are intensifying the need for highly adaptable, software-driven test systems. Looking forward, rising production volumes, the rollout of stringent global testing protocols, and advancements in automated and real-time testing technologies are expected to sustain the market’s upward trajectory.
The electric vehicle test equipment market is segmented by vehicle, fuel, and application and geographic regions. By vehicle of the electric vehicle test equipment market is divided into Passenger car and Commercial vehicle. In terms of fuel of the electric vehicle test equipment market is classified into Battery Electric Vehicles (BEVs), Plug-in Hybrid Electric Vehicles (PHEVs), and Hybrid Electric Vehicles (HEVs). Based on application of the electric vehicle test equipment market is segmented into EV component, EV charging, Powertrain, Battery test, and Others. Regionally, the electric vehicle test equipment industry is classified into North America, Latin America, Western Europe, Eastern Europe, Balkan & Baltic Countries, Russia & Belarus, Central Asia, East Asia, South Asia & Pacific, and the Middle East & Africa.
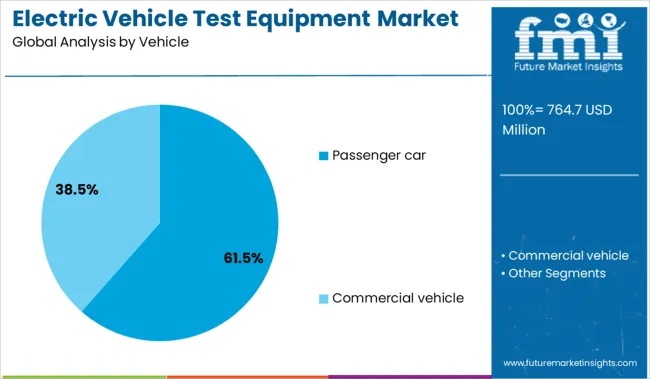
The passenger car segment dominates the vehicle category with a commanding 61.5% share, reflecting the surge in electric car production and rising consumer acceptance across global markets. This dominance is fueled by government incentives, expanding charging infrastructure, and OEM strategies prioritizing electrification of personal vehicles.
Passenger EVs require extensive testing of components such as batteries, inverters, motors, and power electronics to meet performance and safety benchmarks. Test equipment tailored for passenger cars is witnessing increased adoption due to the complexity of modern EV systems and the demand for shorter development cycles.
The segment benefits from high product variability and customization needs, pushing equipment providers to offer flexible, modular testing solutions. As the passenger EV market continues to grow, particularly in Asia, Europe, and North America, the associated testing equipment demand is expected to remain consistently strong.
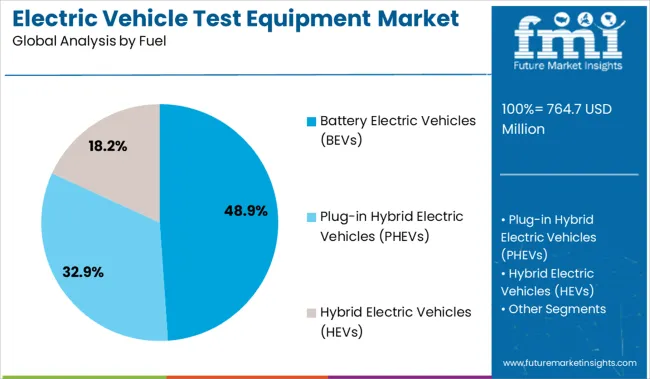
Battery electric vehicles lead the fuel type category with a 48.9% market share, driven by their zero-emission profile, improved battery range, and broad regulatory support. BEVs rely entirely on electric propulsion systems, making the need for thorough electrical, mechanical, and environmental testing even more critical.
Testing for BEVs encompasses battery management systems, thermal efficiency, motor control, and real-time diagnostics, necessitating highly specialized and accurate test equipment. The rise of gigafactories and large-scale BEV production facilities has further elevated the demand for high-throughput, automated testing solutions.
Technological innovations in lithium-ion batteries and advancements in solid-state alternatives are intensifying testing requirements to ensure safety, efficiency, and lifespan validation. As BEVs form the backbone of future mobility strategies, their sustained growth is expected to propel demand for sophisticated test systems across the development and production lifecycle.
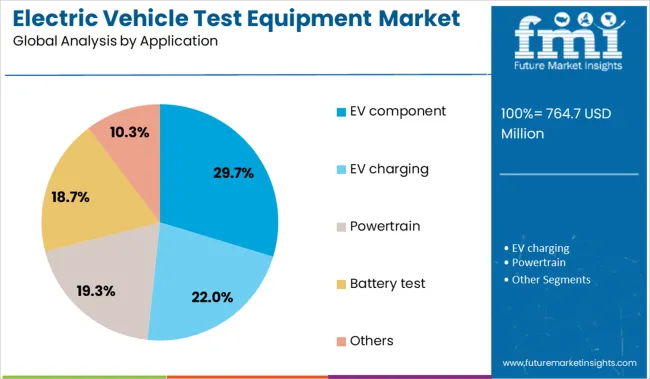
The EV component segment holds a 29.7% share in the application category, highlighting the critical role of sub-system testing in ensuring overall vehicle functionality and performance. This segment includes the testing of power electronics, battery packs, electric drive units, chargers, and control systems—components that are central to EV operation and innovation.
Growth in this area is supported by the increasing complexity and integration of these components, which require rigorous performance validation under various load, temperature, and environmental conditions. Component-level testing ensures that each part meets industry standards before integration into the vehicle, reducing the risk of failure and enhancing safety.
The shift towards modular vehicle architectures and increased reliance on software-defined systems have also raised the importance of simulation-based testing and hardware-in-the-loop (HIL) methodologies. As EV platforms evolve and scale, the EV component application segment is expected to gain further traction in both R&D and production environments.
Rapid expansion is driven by the integration of high voltage batteries, stringent safety testing standards, and global EV fleet scale-up. Opportunities exist in modular test systems, automated diagnostics, and vertically integrated service models.
Manufacturers of electric vehicles rely heavily on test equipment to validate battery safety, charging systems, power electronics, and drive train components. Compliance with evolving standards for thermal runaways, high-voltage shock protection, and Electromagnetic Compatibility (EMC) requires specialized test benches, environmental chambers, and diagnostic hardware. As EV designs diversify across passenger cars, buses, delivery vans, and commercial fleets, OEMs and Tier 1 suppliers invest in scalable test rigs to ensure repeatable validation. Real-time data acquisition and high throughput testing supports faster production ramp‑up and quicker root cause analysis during design cycles. Service labs and certification bodies also deploy this equipment to manage recall risk and warranty reliability. These testing needs form the core demand base for tailored electric vehicle test solutions.
Opportunities lie in offering modular test systems that can adapt to different voltage levels, battery chemistries, and vehicle types without full equipment reinvestment. Subscription based platforms offering remote diagnostics, predictive maintenance tools, and calibration services help manufacturers reduce upfront capital exposure. Collaborations between equipment makers, test labs, EV OEMs, and charging system providers can create libraries of standardized validation protocols. Providing portable mobile test units for field validation supports fleet operators and maintenance services. Geographic expansion into regions ramping EV production, supported by local test service centers and training programs, can reduce barrier to entry. Offering leasing programs that include updates, software upgrades, and service support enables equipment to scale with evolving EV standards and customer needs.
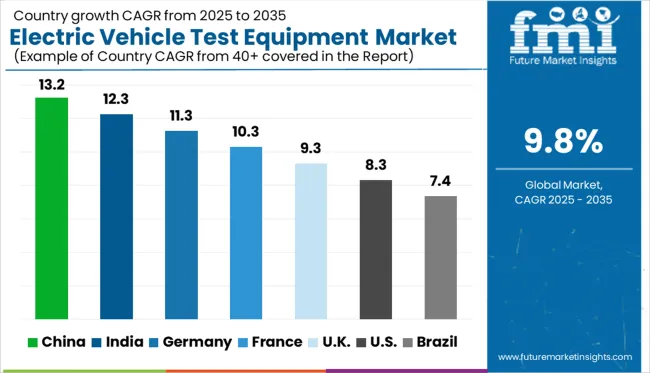
| Country | CAGR |
|---|---|
| China | 13.2% |
| India | 12.3% |
| Germany | 11.3% |
| France | 10.3% |
| UK | 9.3% |
| USA | 8.3% |
| Brazil | 7.4% |
The Electric Vehicle Test Equipment market is projected to grow at a value-based CAGR of 9.8% between 2025 and 2035, fueled by the rapid adoption of electric mobility and stricter quality assurance norms. China leads this trajectory with a 13.2% CAGR, driven by its dominant EV production and battery testing ecosystems. India follows closely at 12.3%, supported by domestic EV incentives and emerging Tier 1 suppliers. Germany, part of the OECD, grows at 11.3% CAGR, backed by strong automotive R&D infrastructure and precision testing technologies. The UK shows a healthy 9.3% growth, aligning with its zero-emission vehicle transition plans. Meanwhile, the US reflects an 8.3% CAGR, shaped by federal electrification policies and growing lab-scale testing for advanced EV systems. This report covers detailed analysis of 40+ countries, and the top five countries have been shared as a reference.
China is expanding at a 13.2% CAGR, with strong YoY momentum due to its vertically integrated EV ecosystem. Test equipment demand is growing across battery cell validation, thermal runaway detection, and charger interface testing. Local OEMs are investing in high-throughput labs for evaluating traction motors, insulation resistance, and inverter efficiency. Equipment makers are aligning with Tier-1 component suppliers in cities like Shenzhen and Changzhou to offer bundled testing solutions. Battery swap stations, unique to China, require robust real-time diagnostic tools for connectors and cell pack stability.
India is advancing at a 12.3% CAGR, with rising YoY demand driven by testing needs in two-wheelers, electric rickshaws, and light-duty EVs. Equipment adoption is growing among component start-ups focused on battery modules, control units, and drive systems. Regional test labs supported by government EV clusters are purchasing hardware for electromagnetic compliance, BMS validation, and overcurrent protection checks. Indian electric bus manufacturers are adopting heavy-duty test rigs for axle-load simulations and regenerative braking analysis. Import reliance for core testing tools remains high, prompting local firms to start reverse-engineering select devices.
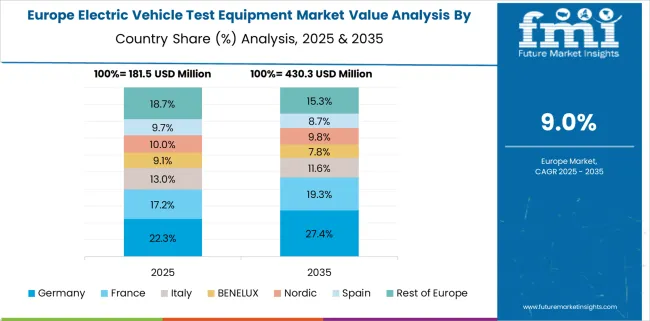
Germany is growing at a 11.3% CAGR, with YoY growth linked to its strong focus on quality assurance across high-voltage EV systems. Premium carmakers are integrating advanced test benches for evaluating inverter harmonics, motor torque accuracy, and thermal cycling. Tier-1 suppliers are deploying inline test stations to monitor sensor integration within battery packs. Labs across Stuttgart and Munich are focusing on test automation frameworks to ensure repeatability in DC fast-charging performance. Equipment imports from Japan and South Korea are common for precise cell impedance and degradation tracking.
The United Kingdom is advancing at a 9.3% CAGR, with YoY traction seen in retrofitting test facilities to support commercial EVs and hybrid fleets. Most growth comes from contract test centers working with defense contractors, delivery fleet operators, and bus transit agencies. Equipment is used for thermal abuse testing, energy loss evaluation, and gearbox durability checks. EV retrofitting firms in the Midlands are buying compact test rigs for hub motors and low-voltage controllers. Compliance with post-Brexit safety standards is also driving demand for re-certification testing platforms.
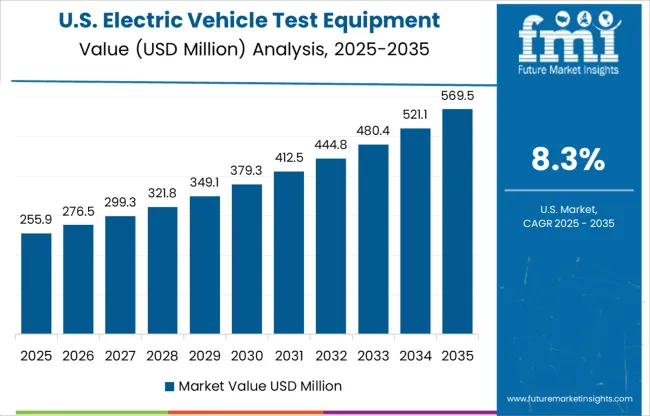
The United States is expanding at an 8.3% CAGR, with stable YoY demand driven by high-performance EV testing in aerospace, motorsport, and municipal fleet domains. Equipment is widely used in Arizona, Michigan, and California for drivetrain simulation, EV battery abuse testing, and software-hardware interface validation. Some growth is coming from private EV startups developing prototypes that require scalable test modules for thermal load and range optimization. Defense contracts are contributing to specialty test equipment orders for electric utility vehicles. Emphasis is shifting to portable test platforms for remote field validation.
The application-specific integrated circuit (ASIC) market is moderately consolidated, with global semiconductor leaders shaping innovation across automotive, industrial, and consumer electronics. Infineon Technologies AG leads with strength in automotive ASICs, leveraging advanced power management and security features. Key players like STMicroelectronics, Texas Instruments, and Renesas Electronics support scalable ASIC solutions for embedded systems and IoT. Intel Corporation provides high-performance ASICs for data centers and AI workloads. Meanwhile, OMNIVISION specializes in image-sensing ASICs, and Tekmos Inc. offers legacy ASIC support and custom designs. Market momentum is driven by rising demand for custom silicon, energy-efficient designs, and integration into mission-critical systems.
On October 15, 2024, Keysight Technologies announced the expansion of its RP7900 series regenerative power systems to support EV testing at 500 V and 20–30 kW power levels. These bi-directional systems enable smooth transitions between sourcing and sinking power, offer high accuracy with sub-millisecond command response, and reduce energy consumption by returning unused power to the grid—enhancing efficiency for battery, EVSE, and drivetrain testing.
| Item | Value |
|---|---|
| Quantitative Units | USD 764.7 Million |
| Vehicle | Passenger car and Commercial vehicle |
| Fuel | Battery Electric Vehicles (BEVs), Plug-in Hybrid Electric Vehicles (PHEVs), and Hybrid Electric Vehicles (HEVs) |
| Application | EV component, EV charging, Powertrain, Battery test, and Others |
| Regions Covered | North America, Europe, Asia-Pacific, Latin America, Middle East & Africa |
| Country Covered | United States, Canada, Germany, France, United Kingdom, China, Japan, India, Brazil, South Africa |
| Key Companies Profiled | National Instruments Corporation, Intertek Group Plc, Keysight Technologies, Inc., Tuv Rheinland, Durr Group, AVL, and Chroma ATE |
| Additional Attributes | Dollar sales by equipment type, vehicle type, and testing application; regional demand driven by EV production growth, battery safety regulations, and R&D investments; innovation in high-voltage testing, fast-charging simulation, and real-time diagnostics; cost dynamics shaped by lab infrastructure, software integration, and test complexity; environmental impact from equipment energy use; and emerging use cases in battery lifecycle analysis, powertrain validation, and autonomous vehicle systems. |
The global electric vehicle test equipment market is estimated to be valued at USD 764.7 million in 2025.
The market size for the electric vehicle test equipment market is projected to reach USD 1,947.7 million by 2035.
The electric vehicle test equipment market is expected to grow at a 9.8% CAGR between 2025 and 2035.
The key product types in electric vehicle test equipment market are passenger car and commercial vehicle.
In terms of fuel, battery electric vehicles (bevs) segment to command 48.9% share in the electric vehicle test equipment market in 2025.


Our Research Products

The "Full Research Suite" delivers actionable market intel, deep dives on markets or technologies, so clients act faster, cut risk, and unlock growth.

The Leaderboard benchmarks and ranks top vendors, classifying them as Established Leaders, Leading Challengers, or Disruptors & Challengers.

Locates where complements amplify value and substitutes erode it, forecasting net impact by horizon

We deliver granular, decision-grade intel: market sizing, 5-year forecasts, pricing, adoption, usage, revenue, and operational KPIs—plus competitor tracking, regulation, and value chains—across 60 countries broadly.

Spot the shifts before they hit your P&L. We track inflection points, adoption curves, pricing moves, and ecosystem plays to show where demand is heading, why it is changing, and what to do next across high-growth markets and disruptive tech

Real-time reads of user behavior. We track shifting priorities, perceptions of today’s and next-gen services, and provider experience, then pace how fast tech moves from trial to adoption, blending buyer, consumer, and channel inputs with social signals (#WhySwitch, #UX).

Partner with our analyst team to build a custom report designed around your business priorities. From analysing market trends to assessing competitors or crafting bespoke datasets, we tailor insights to your needs.
Supplier Intelligence
Discovery & Profiling
Capacity & Footprint
Performance & Risk
Compliance & Governance
Commercial Readiness
Who Supplies Whom
Scorecards & Shortlists
Playbooks & Docs
Category Intelligence
Definition & Scope
Demand & Use Cases
Cost Drivers
Market Structure
Supply Chain Map
Trade & Policy
Operating Norms
Deliverables
Buyer Intelligence
Account Basics
Spend & Scope
Procurement Model
Vendor Requirements
Terms & Policies
Entry Strategy
Pain Points & Triggers
Outputs
Pricing Analysis
Benchmarks
Trends
Should-Cost
Indexation
Landed Cost
Commercial Terms
Deliverables
Brand Analysis
Positioning & Value Prop
Share & Presence
Customer Evidence
Go-to-Market
Digital & Reputation
Compliance & Trust
KPIs & Gaps
Outputs
Full Research Suite comprises of:
Market outlook & trends analysis
Interviews & case studies
Strategic recommendations
Vendor profiles & capabilities analysis
5-year forecasts
8 regions and 60+ country-level data splits
Market segment data splits
12 months of continuous data updates
DELIVERED AS:
PDF EXCEL ONLINE
Electric Aircraft Onboard Sensors Market Size and Share Forecast Outlook 2025 to 2035
Electrical Label Market Size and Share Forecast Outlook 2025 to 2035
Electric Round Sprinklers Market Size and Share Forecast Outlook 2025 to 2035
Electric Cloth Cutting Scissors Market Size and Share Forecast Outlook 2025 to 2035
Electrical Insulation Materials Market Size and Share Forecast Outlook 2025 to 2035
Electric Aircraft Sensors Market Size and Share Forecast Outlook 2025 to 2035
Electric Traction Motor Market Forecast Outlook 2025 to 2035
Electric Off-Road ATVs & UTVs Market Size and Share Forecast Outlook 2025 to 2035
Electric Blind Rivet Gun Market Size and Share Forecast Outlook 2025 to 2035
Electric Fireplace Market Size and Share Forecast Outlook 2025 to 2035
Electric Glider Market Size and Share Forecast Outlook 2025 to 2035
Electric Power Steering Motors Market Size and Share Forecast Outlook 2025 to 2035
Electric Motor Market Size and Share Forecast Outlook 2025 to 2035
Electric Gripper Market Size and Share Forecast Outlook 2025 to 2035
Electric Boat Market Size and Share Forecast Outlook 2025 to 2035
Electric Bicycle Market Size and Share Forecast Outlook 2025 to 2035
Electrical Enclosure Market Size and Share Forecast Outlook 2025 to 2035
Electrical Sub Panels Market Size and Share Forecast Outlook 2025 to 2035
Electric Cargo Bike Market Size and Share Forecast Outlook 2025 to 2035
Electric Sub-meter Market Size and Share Forecast Outlook 2025 to 2035

Thank you!
You will receive an email from our Business Development Manager. Please be sure to check your SPAM/JUNK folder too.
Chat With
MaRIA