Reports

- Global Locations -

Headquarters

Future Market Insights, Inc.

Christiana Corporate, 200
Continental Drive, Suite 401,
Newark, Delaware - 19713,
United States

T: +1-845-579-5705

Americas

Future Market Insights, Inc.

616 Corporate Way, Suite 2-9018,
Valley Cottage, NY 10989, United States

T: +1-347-918-3531

MEA

Future Market Insights

1602-6 Jumeirah Bay X2 Tower, Plot No: JLT-PH2-X2A,
Jumeirah Lakes Towers, Dubai,
United Arab Emirates

Europe

Future Market Insights

3rd Floor, 207 Regent Street,
W1B 3HH London
United Kingdom

T: + 44 (0) 20 8123 9659
D: +44 (0) 20 3287 4268

Asia Pacific

Future Market Insights

IndiaLand Global Tech Park, Unit UG-1, Behind Grand HighStreet, Phase 1, Hinjawadi, MH, Pune – 411057, India

Electric Handpiece Market Snapshot (2022 to 2032)

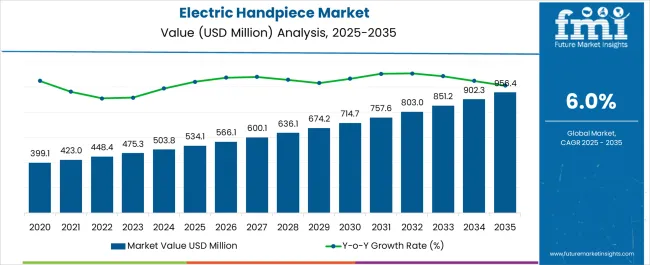
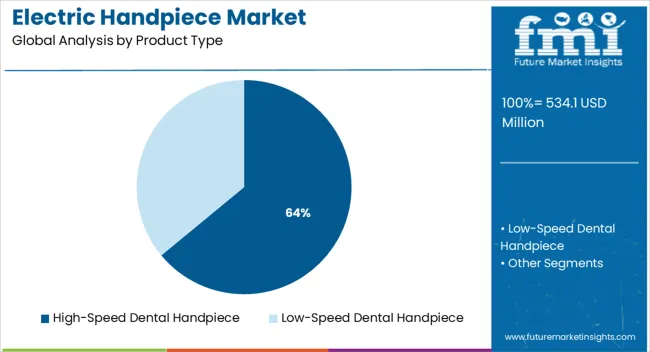
[378 Pages Report] The global electric handpiece market is expected to enjoy a valuation of US$ 448.4 Million in 2022, and further expand at a CAGR rate of 6.0% to reach a valuation of ~US$ 803.8 Million by the end of the year 2032. According to a recent study by Future Market Insights, low-speed dental handpiece products are leading the market with a share of about 59.9% in the year 2021, within the global electric handpiece market.

Market Outlook:

Data Points Market Insights
Market Value 2022 US$ 448.4 Million
Market Value 2032 US$ 803.8 Million
CAGR 2022 to 2032 6.0%
Market Share of Top 5 Countries 52.5%
Key Market Players Dentsply Sirona, KaVo Dental GmbH, NSK/NAKANISHI INC., Bien-Air Dental SA, A-dec Inc., W&H Dentalwerk Bürmoos GmbH, Brasseler USA, SciCan Ltd., Ram Products, Inc, Morita Corporation, DENTALEZ, Inc., Lares Research, DENTAMERICA INC., MAI Animal Health (INOVAD-ENT), Medidenta.

Electric dental handpieces are devices used by dentists to carry out a number of surgeries, including endodontics, cavity preparation, crown preparation, and decay removal. The electric motor used in electric dental handpieces is connected to a shaft by gears, and these gears are connected by burs (the part that performs actual cutting). The bur is rotated by the turbine of an air-driven dental handpiece, which is powered by compressed air. In comparison to air-driven dental handpieces, these electric handpieces provide a number of advantages, including constant speed and torque.

Due to the fact that new electric dental handpiece models come with programmable switching features for endodontics systems, these tools are currently gaining more popularity among dental professionals. Other benefits of these electric handpieces over an air-driven handpiece include improved accessibility, more precise manipulation, and no turbine malfunction.

Don't pay for what you don't need

Customize your report by selecting specific countries or regions and save 30%!

Sales Analysis of Electric Handpiece Market from 2015 to 2021 Vs Market Outlook for 2022 to 2032

The market value for electric handpieces was approximately 6.3% of the overall ~US$ 6.8 Billion global dental handpiece market in 2021.

The sale of electric handpieces grew at a CAGR of close to 4.3% from 2015 to 2021. The market for electric handpieces is expected to be propelled due to the rising prevalence of oral diseases.

According to FDI World Dental Federation, nearly 3.5 billion people worldwide suffer from oral diseases.

The 2019 study by Global Burden of Disease also estimated the number of children suffering from primary tooth decay issues worldwide to be around 520 million, whereas 2 billion adults have tooth decay which is permanent. The need for dentists is growing globally; for example, a WHO factsheet from 2017 states that 93% of its member nations have less than 1 dentist per 1000 people.

People are now more aware of the problems with dental health and how to address them as soon as possible. This is directly related to the forecasted expansion of the electric handpiece market.

Research and development on electric handpiece products have been a consistent part of the enhancement of the dental handpiece industry. Innovations are making the procedure more efficient for dental professionals and comfortable for patients. The different advantages provided by the most recent electric dental handpiece demonstrate the market's innovation and progress. For Instance-

Nakanishi Inc. announced the release of the S-Max M Series on March 12, 2019, which offers the dependability and safety requirements imposed by both industry standards and practitioners.

Other factors such as the rise in the geriatric population with dental and tooth decay problems and increasing demand for cosmetic dentistry would further aid in the growth of the electric handpiece market.

As per the American Association of Oral and Maxillofacial Surgeons 2016 insights, amongst adults aged 35 - 44 years, nearly 69% have lost at least one permanent tooth which causes them to opt for cosmetic dentistry.

Additionally WHO stated that nearly 80 to 85% of dental diseases occur in patients aged greater than 50 years.

Electric Handpiece Market

What are the Key Opportunities for the Electric Handpiece Manufacturers?

The market is set to present an opportunistic outlook, owing to increasing awareness among the rural population. There is a chance to inform and assist the rural population in realizing the value of dental health and oral hygiene.

Such strategies will provide the market an opportunity to expand, even in regions with low market penetration right now. There are many methods that might be used to accomplish this, one of which is communication via telehealth. In addition to supporting patients and meeting their demands, this will offer a chance to advertise cutting-edge items in the electric handpiece industry.

The growth will further be propelled by increasing government healthcare expenditure and awareness programs. For instance, the MHLW created the 8020 Promotion Foundation and the 8020 programs to promote oral health and assist people in saving at least 20 of their own teeth until the age of 80.

The increase in demand for silver-gold-palladium alloys for crowns and other dental prosthesis can be attributed to the expansion of this market. People choose expensive metals because they are better from an aesthetic standpoint and are covered by dental insurance.

Sabyasachi Ghosh
Sabyasachi Ghosh

Principal Consultant

Talk to Analyst

Find your sweet spots for generating winning opportunities in this market.

What are the Factors Restraining Demand for Electric Handpiece Products?

Although the electric handpiece market has numerous end-uses, there are certain obstacles that are likely to pose a challenge to market growth. The low reimbursement rate for dental procedures is one of the main reasons restraining the growth of the electric handpiece market. Dentists are reluctant to accept Medicaid patients due to low reimbursement rates. The Medicaid reimbursement rate is roughly 30% of what dentists typically charge for specific dental procedures. Unfortunately, because of the poor reimbursement rate, dentists are unable to accept these patients.

These propose an adverse consequence on the formative development of the electric handpiece market.
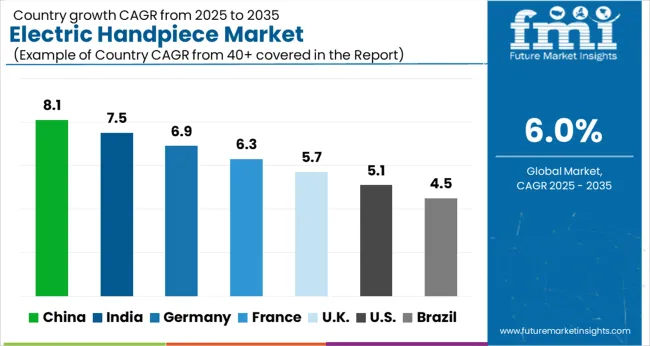
Country-wise Insights

What Makes the USA a Highly Lucrative Market for Electric Handpiece?

The USA dominates the North American region with a total market share of about 92.4 % in 2021 and is expected to continue the same through the forecast period.

With the vast advancements in the research and development sectors due to high investments, a rise in the aging population, availability of cutting-edge dental devices, and easy access of dentists to these devices, the USA market is expected to hold this position in the forecasted period. According to the Centers for Disease Control and Prevention, more than 40% of individuals reported experiencing oral pain. The USA spends more than $124 billion on dental-related expenses.

What is the Outlook of the UK for the Electric Handpiece Market?

The UK is expected to show a CAGR growth rate of 6.6% in the European electric handpiece market over the forecast period.

As per the reports by the Oral Health Foundation Statistics in the UK, 39% of adults do not visit dentists and 31% of the population have tooth decay every year.

The market is anticipated to benefit from growing health awareness amongst consumers, the rising number of market players who are investing and producing innovative electric Handpiece, good healthcare reimbursement scenarios, and the high adoption rate of these devices in dental clinics and hospitals.

What makes Germany a Demanding Market for Electric Handpiece?

Germany holds a market share of 18.8% in the whole of Europe and is expected to grow with a CAGR of 7.5% during the forecasted period.

The reason for the rising demand and growth for electric handpiece is the increased awareness among healthcare professionals towards the use of electric handpiece products, along with a growing number of manufacturers in Germany.

Get the data you need at a Fraction of the cost

Personalize your report by choosing insights you need
and save 40%!

Category-wise Insights

Which Electric Handpiece Product is driving the Market?

Low-speed dental handpiece held a market share of 59.9% in the global market in 2021 and grow with a CAGR of 6.5% by the end of the forecast period.

Low-speed dental handpieces are designed to handle much more air pressure than high-speed handpieces.

They are designed to be more user-friendly and are shorter in design. They usually operate at around 20,000 RPMs. Hence they are preferred more over high-speed dental handpiece as they are easier to handle and causes less damage.

What Motor Type is Largely in Focus Globally?

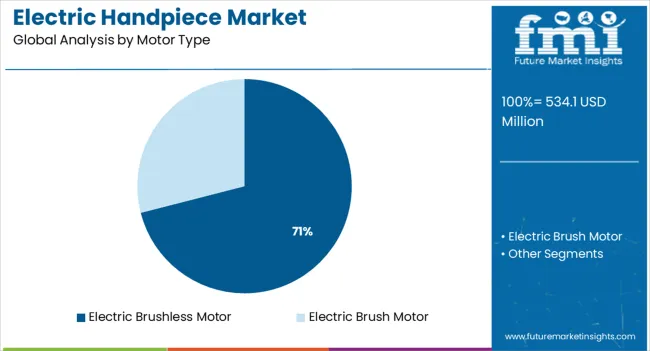
The electric brush motor has shown increased demand with a market share of 56.0% globally in 2021 and is expected to grow with a CAGR of 5.8%.

The electric brush motor is majorly in focus among consumers and healthcare professionals as it helps to maintain a constant speed and torque even when the load increases while performing procedures. Hence, it creates a smoother and more precise cut maintaining greater flexibility in the procedures.

Which Electric Handpiece Technology is Largely in Focus in the Market?

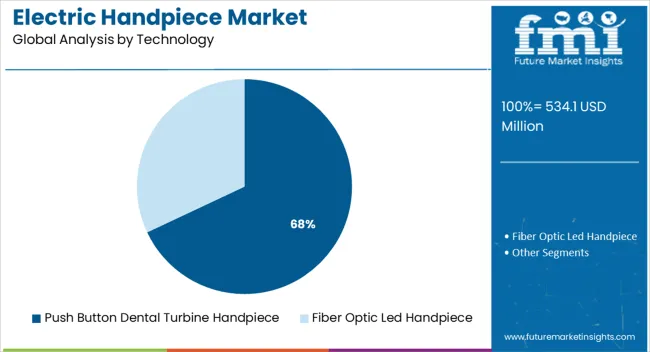
The fiber optic led handpiece held a market share of over 59% globally owing to the fact that it shines light directly on the preparation, which greatly improves sight and helps to perform the operation successfully with less stress. This is why it highly preferred by dentists is.

Which End User Benefits the Most from the Sales of Electric Handpiece?

Dental Clinics held nearly half of the global market share by value during the year 2021.

Dental clinics held the highest market share due to increased insurance company mergers and partnerships. With the aid of dental support organizations, dental clinics are anticipated to change how they give care and take control of the industry in the upcoming years.

Competitive Landscape

With several competitors in the production of electric handpiece, the overall market is highly fragmented. Key Players such as Dentsply Sirona,
KaVo Dental GmbH, NSK/NAKANISHI INC. are adopting new strategies like collaborations with dental organizations, new high-tech product launches, and partnerships to promote their products. These strategies are being followed by upcoming players to increase their business and capture the untapped market.

  • On May 4, 2021, KaVo Dental Technologies announced a collaboration with A-dec, Inc. for delivering innovation and world-class products to healthcare professionals worldwide.
  • On May 4, 2021, A-dec and KaVo, two of the most reputable names in the dental industry, announced a new partnership to provide dental professionals with premier products and world-class service.

Similarly, recent developments related to companies manufacturing electric handpiece have been tracked by the team at Future Market Insights, which are available in the full report.

Report Scope as per Electric Handpiece Industry Analysis

Attribute Details
Forecast Period 2022 to 2032
Historical Data Available for 2015 to 2021
Market Analysis US$ Million for Value
Key Regions Covered North America, Latin America, Europe, South Asia, East Asia, Oceania, and Middle East & Africa
Key Countries Covered USA, Canada, Brazil, Mexico, Argentina, UK, Germany, Italy, Russia, Spain, France, BENELUX, India, Thailand, Indonesia, Malaysia, Japan, China, South Korea, Australia, New Zealand, Turkey, GCC Countries, South Africa
Key Market Segments Covered Product, Motor Type, Technology, End User, Region
Key Companies Profiled
  • Dentsply Sirona
  • KaVo Dental GmbH
  • NSK/NAKANISHI INC.
  • Bien-Air Dental SA
  • A-dec Inc.
  • W&H Dentalwerk Bürmoos GmbH
  • Brasseler USA
  • SciCan Ltd.
  • Ram Products, Inc
  • Morita Corporation
  • DENTALEZ, Inc.
  • Lares Research
  • DENTAMERICA INC.
  • MAI Animal Health (INOVAD-ENT)
  • Medidenta
Pricing Available upon Request

Key Market Segments Covered in Electric Handpiece Industry Research

By Product:

  • Low-Speed Dental Handpiece
  • High-Speed Dental Handpiece

By Motor Type:

  • Electric Brush Motor
  • Electric Brushless Motor

By Technology:

  • Fiber Optic Led Handpiece
  • Push Button Dental Turbine Handpiece

By End-Users:

  • Hospitals
  • Dental Clinics
  • Dental Academic and Research Institutes
  • Ambulatory Surgical Centers

By Region:

  • North America
  • Latin America
  • Europe
  • South Asia
  • East Asia
  • Oceania
  • Middle East and Africa (MEA)

Frequently Asked Questions

How much is the electric handpiece market estimated to be worth in 2022?

The global electric handpiece market is estimated to be worth US$ 448.4 Million in 2022, and is set to expand 1.8 X over the next ten years.

What is the sales forecast for electric handpiece market through 2032?

The electric handpiece market is expected to reach US$ 803.8 Million by the end of 2032, with sales revenue expected to register 6.0% CAGR.

What are the key trends shaping the electric handpiece industry?

The expanding research and development in the electric dental handpieces, rising awareness among consumers, immense advertising, focus on dental cosmetic surgery and rising mergers & collaborations among key market players are some of the key trends within this market.

Which are the top 5 countries driving demand for electric handpiece market?

The USA, UK, Germany, France and India are the top 5 countries and are expected to drive demand for the electric handpiece industry.

What is the North American market outlook for electric handpiece market?

North America is one of the key markets for electric handpiece, with the USA accounting for 92.4% of the North American electric handpiece market in the year 2021.

At what percentage is the demand for Electric Dental Handpiece expected to register growth in Europe?

Demand for electric dental handpiece in Europe is expected to register a growth of 6.4% CAGR over the next ten years.

Which countries are the key producers of electric handpiece?

The USA, Germany, and the UK are the key producers of electric handpiece.

Who are the key players in the electric handpiece market sphere?

Dentsply Sirona , KaVo Dental GmbH , NSK/NAKANISHI INC., Bien-Air Dental SA , A-dec Inc. , W&H Dentalwerk Bürmoos GmbH , Brasseler USA , SciCan Ltd. , Ram Products, Inc , Morita Corporation , DENTALEZ, Inc. , Lares Research , DENTAMERICA INC., MAI Animal Health (INOVAD-ENT) and Medidenta are the key players within this market.

Table of Content

1. Executive Summary | Electric Handpiece Market

    1.1. Global Market Outlook

    1.2. Demand Side Trends

    1.3. Supply Side Trends

    1.4. Analysis and Recommendations

2. Market Overview

    2.1. Market Coverage / Taxonomy

    2.2. Market Definition / Scope / Limitations

    2.3. Inclusions and Exclusions

3. Key Market Trends

    3.1. Key Trends Impacting the Market

    3.2. Product Development and Innovation Trends

4. Key Success Factors

    4.1. Product Adoption/ Usage Analysis

    4.2. Regulatory Scenario

    4.3. PESTLE Analysis

    4.4. Porter’s Analysis

5. Market Background

    5.1. Macro-Economic Factors

        5.1.1. Global GDP Growth Outlook

        5.1.2. Global Healthcare Industry Market Outlook

        5.1.3. Global Dental Handpieces Market

    5.2. Forecast Factors - Relevance & Impact

        5.2.1. Rising Demand For Dental Care

        5.2.2. Rising Prevalence of Dental Disorders

        5.2.3. Growing Investments in Healthcare Expenditure

        5.2.4. Innovation and Development

        5.2.5. Cost of Electric Handpieces

        5.2.6. Growing Cases of Malocclusions

        5.2.7. Increased Mergers and Acquisitions

        5.2.8. Adoption Rate of Electric Handpieces

    5.3. Market Dynamics

        5.3.1. Drivers

        5.3.2. Restraints

        5.3.3. Opportunity Analysis

6. COVID-19 Crisis - Impact Assessment

    6.1. COVID-19 and Impact Analysis

        6.1.1. Revenue By Product

        6.1.2. Revenue By Motor Type

        6.1.3. Revenue By Technology

        6.1.4. Revenue By End User

        6.1.5. Revenue By Region

    6.2. 2021 Market Scenario

7. Global Market Volume (‘000 Units) Analysis 2015 to 2021 and Forecast, 2022 to 2032

    7.1. Historical Market Volume (‘000 Units) Analysis, 2015 to 2021

    7.2. Current and Future Market Volume (‘000 Units) Projections, 2022 to 2032

        7.2.1. Y-o-Y Growth Trend Analysis

8. Global Market - Pricing Analysis

    8.1. Regional Pricing Analysis By Product

    8.2. Pricing Break-up

        8.2.1. Manufacturer-Level Pricing

        8.2.2. Distributor Level Pricing

    8.3. Global Average Pricing Analysis Benchmark

    8.4. Pricing Assumptions

9. Global Market Value (US$ Million) Analysis 2015 to 2021 and Forecast, 2022 to 2032

    9.1. Historical Market Value (US$ Million) Analysis, 2015 to 2021

    9.2. Current and Future Market Value (US$ Million) Projections, 2022 to 2032

        9.2.1. Y-o-Y Growth Trend Analysis

        9.2.2. Absolute $ Opportunity Analysis

10. Global Market Analysis 2015 to 2021 and Forecast 2022 to 2032, By Product

    10.1. Introduction / Key Findings

    10.2. Historical Market Size (US$ Million) and Volume (‘000 Units), By Product, 2015 to 2021

    10.3. Current and Future Market Size (US$ Million) and Volume (‘000 Units) Analysis By Product, 2022 to 2032

        10.3.1. Low-Speed Dental Handpiece

        10.3.2. High-Speed Dental Handpiece

    10.4. Market Attractiveness Analysis By Product

11. Global Market Analysis 2015 to 2021 and Forecast 2022 to 2032, By Motor Type

    11.1. Introduction / Key Findings

    11.2. Historical Market Size (US$ Million) and Volume (‘000 Units), By Motor Type, 2015 to 2021

    11.3. Current and Future Market Size (US$ Million) and Volume (‘000 Units) Analysis and Forecast By Motor Type, 2022 to 2032

        11.3.1. Electric Brush Motor

        11.3.2. Electric Brushless Motor

    11.4. Market Attractiveness Analysis By Motor Type

12. Global Market Analysis 2015 to 2021 and Forecast 2022 to 2032, By Technology

    12.1. Introduction / Key Findings

    12.2. Historical Market Size (US$ Million) and Volume (‘000 Units), By Technology, 2015 to 2021

    12.3. Current and Future Market Size (US$ Million) and Volume (‘000 Units) Analysis and Forecast By Technology, 2022 to 2032

        12.3.1. Fiber Optic Led Handpiece

        12.3.2. Push Button Dental Turbine Handpiece

    12.4. Market Attractiveness Analysis By Technology

13. Global Market Analysis 2015 to 2021 and Forecast 2022 to 2032, By End User

    13.1. Introduction / Key Findings

    13.2. Historical Market Size (US$ Million), By End User, 2015 to 2021

    13.3. Current and Future Market Size (US$ Million) and Forecast By End User, 2022 to 2032

        13.3.1. Hospitals

        13.3.2. Dental Clinics

        13.3.3. Dental Academic and Research Institutes

        13.3.4. Ambulatory Surgical Centers

    13.4. Market Attractiveness Analysis By End User

14. Global Market Analysis 2015 to 2021 and Forecast 2022 to 2032, by Region

    14.1. Introduction

    14.2. Historical Market Size (US$ Million) Analysis By Region, 2015 to 2021

    14.3. Current Market Size (US$ Million) Analysis and Forecast By Region, 2022 to 2032

        14.3.1. North America

        14.3.2. Latin America

        14.3.3. Europe

        14.3.4. South Asia

        14.3.5. East Asia

        14.3.6. Oceania

        14.3.7. Middle East and Africa (MEA)

    14.4. Market Attractiveness Analysis By Region

15. North America Market Analysis 2015 to 2021 and Forecast 2022 to 2032

    15.1. Introduction

    15.2. Historical Market Size (US$ Million) ) and Volume (‘000 Units) Analysis, By Market Taxonomy, 2015 to 2021

    15.3. Current and Future Market Size (US$ Million) ) and Volume (‘000 Units) Analysis, By Market Taxonomy 2022 to 2032

        15.3.1. By Country

            15.3.1.1. United States of America

            15.3.1.2. Canada

        15.3.2. By Product

        15.3.3. By Motor Type

        15.3.4. By Technology

        15.3.5. By End User

    15.4. Market Attractiveness Analysis

        15.4.1. By Country

        15.4.2. By Product

        15.4.3. By Motor Type

        15.4.4. By Technology

        15.4.5. By End User

    15.5. Key Market Participants - Intensity Mapping

    15.6. Drivers and Restraints - Impact Analysis

    15.7. Country-Level Analysis & Forecast

        15.7.1. USA Market Analysis

            15.7.1.1. .Introduction

            15.7.1.2. Market Analysis and Forecast by Market Taxonomy

                15.7.1.2.1. By Product

                15.7.1.2.2. By Motor Type

                15.7.1.2.3. By Technology

                15.7.1.2.4. By End User

        15.7.2. Canada Market Analysis

            15.7.2.1. Introduction

            15.7.2.2. Market Analysis and Forecast by Market Taxonomy

                15.7.2.2.1. By Product

                15.7.2.2.2. By Motor Type

                15.7.2.2.3. By Technology

                15.7.2.2.4. By End User

16. Latin America Market Analysis 2015 to 2021 and Forecast 2022 to 2032

    16.1. Introduction

    16.2. Historical Market Size (US$ Million) and ) and Volume (‘000 Units) Analysis By Market Taxonomy, 2015 to 2021

    16.3. Current and Future Market Size (US$ Million) ) and Volume (‘000 Units) Analysis, By Market Taxonomy, 2022 to 2032

        16.3.1. By Country

            16.3.1.1. Mexico

            16.3.1.2. Brazil

            16.3.1.3. Argentina

            16.3.1.4. Rest of Latin America

        16.3.2. By Product

        16.3.3. By Motor Type

        16.3.4. By Technology

        16.3.5. By End User

    16.4. Market Attractiveness Analysis

        16.4.1. By Country

        16.4.2. By Product

        16.4.3. By Motor Type

        16.4.4. By Technology

        16.4.5. By End User

    16.5. Key Market Participants - Intensity Mapping

    16.6. Drivers and Restraints - Impact Analysis

    16.7. Country-Level Analysis & Forecast

        16.7.1. Brazil Market Analysis

            16.7.1.1. Introduction

            16.7.1.2. Market Analysis and Forecast by Market Taxonomy

                16.7.1.2.1. By Product

                16.7.1.2.2. By Motor Type

                16.7.1.2.3. By Technology

                16.7.1.2.4. By End User

        16.7.2. Mexico Market Analysis

            16.7.2.1. Introduction

            16.7.2.2. Market Analysis and Forecast by Market Taxonomy

                16.7.2.2.1. By Product

                16.7.2.2.2. By Motor Type

                16.7.2.2.3. By Technology

                16.7.2.2.4. By End User

        16.7.3. Argentina Market Analysis

            16.7.3.1. Introduction

            16.7.3.2. Market Analysis and Forecast by Market Taxonomy

                16.7.3.2.1. By Product

                16.7.3.2.2. By Motor Type

                16.7.3.2.3. By Technology

                16.7.3.2.4. By End User

17. Europe Market Analysis 2015 to 2021 and Forecast 2022 to 2032

    17.1. Introduction

    17.2. Historical Market Size (US$ Million) ) and Volume (‘000 Units) Analysis, By Market Taxonomy, 2015 to 2021

    17.3. Current and Future Market Size (US$ Million) ) and Volume (‘000 Units) Analysis, By Market Taxonomy, 2022 to 2032

        17.3.1. By Country

            17.3.1.1. United Kingdom

            17.3.1.2. Germany

            17.3.1.3. Italy

            17.3.1.4. France

            17.3.1.5. Spain

            17.3.1.6. Russia

            17.3.1.7. BENELUX

            17.3.1.8. Rest of Europe

        17.3.2. By Product

        17.3.3. By Motor Type

        17.3.4. By Technology

        17.3.5. By End User

    17.4. Market Attractiveness Analysis

        17.4.1. By Country

        17.4.2. By Product

        17.4.3. By Motor Type

        17.4.4. By Technology

        17.4.5. By End User

    17.5. Key Market Participants - Intensity Mapping

    17.6. Drivers and Restraints - Impact Analysis

    17.7. Country-Level Analysis & Forecast

        17.7.1. UK Market Analysis

            17.7.1.1. Introduction

            17.7.1.2. Market Analysis and Forecast by Market Taxonomy

                17.7.1.2.1. By Product

                17.7.1.2.2. By Motor Type

                17.7.1.2.3. By Technology

                17.7.1.2.4. By End User

        17.7.2. Germany Market Analysis

            17.7.2.1. Introduction

            17.7.2.2. Market Analysis and Forecast by Market Taxonomy

                17.7.2.2.1. By Product

                17.7.2.2.2. By Motor Type

                17.7.2.2.3. By Technology

                17.7.2.2.4. By End User

        17.7.3. Italy Market Analysis

            17.7.3.1. Introduction

            17.7.3.2. Market Analysis and Forecast by Market Taxonomy

                17.7.3.2.1. By Product

                17.7.3.2.2. By Motor Type

                17.7.3.2.3. By Technology

                17.7.3.2.4. By End User

        17.7.4. France Market Analysis

            17.7.4.1. Introduction

            17.7.4.2. Market Analysis and Forecast by Market Taxonomy

                17.7.4.2.1. By Product

                17.7.4.2.2. By Motor Type

                17.7.4.2.3. By Technology

                17.7.4.2.4. By End User

        17.7.5. Spain Market Analysis

            17.7.5.1. Introduction

            17.7.5.2. Market Analysis and Forecast by Market Taxonomy

                17.7.5.2.1. By Product

                17.7.5.2.2. By Motor Type

                17.7.5.2.3. By Technology

                17.7.5.2.4. By End User

        17.7.6. Russia Market Analysis

            17.7.6.1. Introduction

            17.7.6.2. Market Analysis and Forecast by Market Taxonomy

                17.7.6.2.1. By Product

                17.7.6.2.2. By Motor Type

                17.7.6.2.3. By Technology

                17.7.6.2.4. By End User

        17.7.7. BENELUX Market Analysis

            17.7.7.1. Introduction

            17.7.7.2. Market Analysis and Forecast by Market Taxonomy

                17.7.7.2.1. By Product

                17.7.7.2.2. By Motor Type

                17.7.7.2.3. By Technology

                17.7.7.2.4. By End User

18. South Asia Market Analysis 2015 to 2021 and Forecast 2022 to 2032

    18.1. Introduction

    18.2. Historical Market Size (US$ Million) and Volume (‘000 Units) Analysis By Market Taxonomy, 2015 to 2021

    18.3. Current and Future Market Size (US$ Million) and Volume (‘000 Units) Analysis, By Market Taxonomy, 2022 to 2032

        18.3.1. By Country

            18.3.1.1. India

            18.3.1.2. Indonesia

            18.3.1.3. Malaysia

            18.3.1.4. Thailand

            18.3.1.5. Rest of South Asia

        18.3.2. By Product

        18.3.3. By Motor Type

        18.3.4. By Technology

        18.3.5. By End User

    18.4. Market Attractiveness Analysis

        18.4.1. By Country

        18.4.2. By Product

        18.4.3. By Motor Type

        18.4.4. By Technology

        18.4.5. By End User

    18.5. Key Market Participants - Intensity Mapping

    18.6. Drivers and Restraints - Impact Analysis

    18.7. Country-Level Analysis & Forecast

        18.7.1. India Market Analysis

            18.7.1.1. Introduction

            18.7.1.2. Market Analysis and Forecast by Market Taxonomy

                18.7.1.2.1. By Product

                18.7.1.2.2. By Motor Type

                18.7.1.2.3. By Technology

                18.7.1.2.4. By End User

        18.7.2. Indonesia Market Analysis

            18.7.2.1. Introduction

            18.7.2.2. Market Analysis and Forecast by Market Taxonomy

                18.7.2.2.1. By Product

                18.7.2.2.2. By Motor Type

                18.7.2.2.3. By Technology

                18.7.2.2.4. By End User

        18.7.3. Malaysia Market Analysis

            18.7.3.1. Introduction

            18.7.3.2. Market Analysis and Forecast by Market Taxonomy

                18.7.3.2.1. By Product

                18.7.3.2.2. By Motor Type

                18.7.3.2.3. By Technology

                18.7.3.2.4. By End User

        18.7.4. Thailand Market Analysis

            18.7.4.1. Introduction

            18.7.4.2. Market Analysis and Forecast by Market Taxonomy

                18.7.4.2.1. By Product

                18.7.4.2.2. By Motor Type

                18.7.4.2.3. By Technology

                18.7.4.2.4. By End User

19. East Asia Market Analysis 2015 to 2021 and Forecast 2022 to 2032

    19.1. Introduction

    19.2. Historical Market Size (US$ Million) and Volume (‘000 Units) Analysis By Market Taxonomy, 2015 to 2021

    19.3. Current and Future Market Size (US$ Million) and Volume (‘000 Units) Analysis, By Market Taxonomy, 2022 to 2032

        19.3.1. By Country

            19.3.1.1. China

            19.3.1.2. Japan

            19.3.1.3. South Korea

        19.3.2. By Product

        19.3.3. By Motor Type

        19.3.4. By Technology

        19.3.5. By End User

    19.4. Market Attractiveness Analysis

        19.4.1. By Country

        19.4.2. By Product

        19.4.3. By Motor Type

        19.4.4. By Technology

        19.4.5. By End User

    19.5. Key Market Participants - Intensity Mapping

    19.6. Drivers and Restraints - Impact Analysis

    19.7. Country-Level Analysis & Forecast

        19.7.1. China Market Analysis

            19.7.1.1. Introduction

            19.7.1.2. Market Analysis and Forecast by Market Taxonomy

                19.7.1.2.1. By Product

                19.7.1.2.2. By Motor Type

                19.7.1.2.3. By Technology

                19.7.1.2.4. By End User

        19.7.2. Japan Market Analysis

            19.7.2.1. Introduction

            19.7.2.2. Market Analysis and Forecast by Market Taxonomy

                19.7.2.2.1. By Product

                19.7.2.2.2. By Motor Type

                19.7.2.2.3. By Technology

                19.7.2.2.4. By End User

        19.7.3. South Korea Market Analysis

            19.7.3.1. Introduction

            19.7.3.2. Market Analysis and Forecast by Market Taxonomy

                19.7.3.2.1. By Product

                19.7.3.2.2. By Motor Type

                19.7.3.2.3. By Technology

                19.7.3.2.4. By End User

20. Oceania Market 2012-2021 and Forecast 2022 to 2032

    20.1. Introduction

    20.2. Historical Market Size (US$ Million) and Volume (‘000 Units) Analysis By Market Taxonomy, 2015 to 2021

    20.3. Current and Future Market Size (US$ Million) and Volume (‘000 Units) Analysis, By Market Taxonomy, 2022 to 2032

        20.3.1. By Country

            20.3.1.1. Australia

            20.3.1.2. New Zealand

        20.3.2. By Product

        20.3.3. By Motor Type

        20.3.4. By Technology

        20.3.5. By End User

    20.4. Market Attractiveness Analysis

        20.4.1. By Country

        20.4.2. By Product

        20.4.3. By Motor Type

        20.4.4. By Technology

        20.4.5. By End User

    20.5. Key Market Participants - Intensity Mapping

    20.6. Drivers and Restraints - Impact Analysis

    20.7. Country-Level Analysis & Forecast

        20.7.1. Australia Market Analysis

            20.7.1.1. Introduction

            20.7.1.2. Market Analysis and Forecast by Market Taxonomy

                20.7.1.2.1. By Product

                20.7.1.2.2. By Motor Type

                20.7.1.2.3. By Technology

                20.7.1.2.4. By End User

        20.7.2. New Zealand Market Analysis

            20.7.2.1. Introduction

            20.7.2.2. Market Analysis and Forecast by Market Taxonomy

                20.7.2.2.1. By Product

                20.7.2.2.2. By Motor Type

                20.7.2.2.3. By Technology

                20.7.2.2.4. By End User

21. Middle East and Africa (MEA) Market Analysis 2015 to 2021 and Forecast 2022 to 2032

    21.1. Introduction

    21.2. Historical Market Size (US$ Million) and Volume (‘000 Units) Analysis By Market Taxonomy, 2015 to 2021

    21.3. Current and Future Market Size (US$ Million) and Volume (‘000 Units) Analysis, By Market Taxonomy, 2022 to 2032

        21.3.1. By Country

            21.3.1.1. GCC Countries

            21.3.1.2. Turkey

            21.3.1.3. South Africa

            21.3.1.4. North Africa

            21.3.1.5. Rest of Middle East and Africa

        21.3.2. By Product

        21.3.3. By Motor Type

        21.3.4. By Technology

        21.3.5. By End User

    21.4. Market Attractiveness Analysis

        21.4.1. By Country

        21.4.2. By Product

        21.4.3. By Motor Type

        21.4.4. By Technology

        21.4.5. By End User

    21.5. Key Market Participants - Intensity Mapping

    21.6. Drivers and Restraints - Impact Analysis

    21.7. Country-Level Analysis & Forecast

        21.7.1. GCC Countries Market Analysis

            21.7.1.1. Introduction

            21.7.1.2. Market Analysis and Forecast by Market Taxonomy

                21.7.1.2.1. By Product

                21.7.1.2.2. By Motor Type

                21.7.1.2.3. By Technology

                21.7.1.2.4. By End User

        21.7.2. Turkey  Market Analysis

            21.7.2.1. Introduction

            21.7.2.2. Market Analysis and Forecast by Market Taxonomy

                21.7.2.2.1. By Product

                21.7.2.2.2. By Motor Type

                21.7.2.2.3. By Technology

                21.7.2.2.4. By End User

        21.7.3. South Africa Market Analysis

            21.7.3.1. Introduction

            21.7.3.2. Market Analysis and Forecast by Market Taxonomy

                21.7.3.2.1. By Product

                21.7.3.2.2. By Motor Type

                21.7.3.2.3. By Technology

                21.7.3.2.4. By End User

        21.7.4. North Africa Market Analysis

            21.7.4.1. Introduction

            21.7.4.2. Market Analysis and Forecast by Market Taxonomy

                21.7.4.2.1. By Product

                21.7.4.2.2. By Motor Type

                21.7.4.2.3. By Technology

                21.7.4.2.4. By End User

22. Market Structure Analysis

    22.1. Market Analysis by Tier of Companies

    22.2. Market Share Analysis of Top Players

23. Competition Analysis

    23.1. Competition Dashboard

    23.2. Competition Benchmarking

    23.3. Competition Deep Dive

        23.3.1. Dentsply Sirona

            23.3.1.1. Overview

            23.3.1.2. Product Portfolio

            23.3.1.3. Sales Footprint

            23.3.1.4. Key Financials

            23.3.1.5. Strategy Overview

            23.3.1.6. SWOT Analysis

        23.3.2. KaVo Dental GmbH

            23.3.2.1. Overview

            23.3.2.2. Product Portfolio

            23.3.2.3. Sales Footprint

            23.3.2.4. Key Financials

            23.3.2.5. Strategy Overview

            23.3.2.6. SWOT Analysis

        23.3.3. NSK/NAKANISHI INC.

            23.3.3.1. Overview

            23.3.3.2. Product Portfolio

            23.3.3.3. Sales Footprint

            23.3.3.4. Key Financials

            23.3.3.5. Strategy Overview

            23.3.3.6. SWOT Analysis

        23.3.4. Bien-Air Dental SA

            23.3.4.1. Overview

            23.3.4.2. Product Portfolio

            23.3.4.3. Sales Footprint

            23.3.4.4. Key Financials

            23.3.4.5. Strategy Overview

            23.3.4.6. SWOT Analysis

        23.3.5. A-dec Inc.

            23.3.5.1. Overview

            23.3.5.2. Product Portfolio

            23.3.5.3. Sales Footprint

            23.3.5.4. Key Financials

            23.3.5.5. Strategy Overview

            23.3.5.6. SWOT Analysis

        23.3.6. W&H Dentalwerk Bürmoos GmbH

            23.3.6.1. Overview

            23.3.6.2. Product Portfolio

            23.3.6.3. Sales Footprint

            23.3.6.4. Key Financials

            23.3.6.5. Strategy Overview

            23.3.6.6. SWOT Analysis

        23.3.7. Brasseler USA

            23.3.7.1. Overview

            23.3.7.2. Product Portfolio

            23.3.7.3. Sales Footprint

            23.3.7.4. Key Financials

            23.3.7.5. Strategy Overview

            23.3.7.6. SWOT Analysis

        23.3.8. SciCan Ltd.

            23.3.8.1. Overview

            23.3.8.2. Product Portfolio

            23.3.8.3. Sales Footprint

            23.3.8.4. Key Financials

            23.3.8.5. Strategy Overview

            23.3.8.6. SWOT Analysis

        23.3.9. Ram Products, Inc

            23.3.9.1. Overview

            23.3.9.2. Product Portfolio

            23.3.9.3. Sales Footprint

            23.3.9.4. Key Financials

            23.3.9.5. Strategy Overview

            23.3.9.6. SWOT Analysis

        23.3.10. Morita Corporation

            23.3.10.1. Overview

            23.3.10.2. Product Portfolio

            23.3.10.3. Sales Footprint

            23.3.10.4. Key Financials

            23.3.10.5. Strategy Overview

            23.3.10.6. SWOT Analysis

        23.3.11. DENTALEZ, Inc.

            23.3.11.1. Overview

            23.3.11.2. Product Portfolio

            23.3.11.3. Sales Footprint

            23.3.11.4. Key Financials

            23.3.11.5. Strategy Overview

            23.3.11.6. SWOT Analysis

        23.3.12. Lares Research

            23.3.12.1. Overview

            23.3.12.2. Product Portfolio

            23.3.12.3. Sales Footprint

            23.3.12.4. Key Financials

            23.3.12.5. Strategy Overview

            23.3.12.6. SWOT Analysis

        23.3.13. DENTAMERICA INC.

            23.3.13.1. Overview

            23.3.13.2. Product Portfolio

            23.3.13.3. Sales Footprint

            23.3.13.4. Key Financials

            23.3.13.5. Strategy Overview

            23.3.13.6. SWOT Analysis

        23.3.14. MAI Animal Health (INOVAD-ENT)

            23.3.14.1. Overview

            23.3.14.2. Product Portfolio

            23.3.14.3. Sales Footprint

            23.3.14.4. Key Financials

            23.3.14.5. Strategy Overview

            23.3.14.6. SWOT Analysis

        23.3.15. Medidenta

            23.3.15.1. Overview

            23.3.15.2. Product Portfolio

            23.3.15.3. Sales Footprint

            23.3.15.4. Key Financials

            23.3.15.5. Strategy Overview

            23.3.15.6. SWOT Analysis

24. Assumptions and Acronyms Used

25. Research Methodology

List of Tables

Table 01: Global Market Value (US$ Million) Analysis and Forecast 2015 to 2032, by Product

Table 02: Global Market Volume (Units) Analysis and Forecast 2015 to 2032, by Product

Table 03: Global Market Value (US$ Million) Analysis and Forecast 2015 to 2032, by Motor Type

Table 04: Global Market Value (US$ Million) Analysis and Forecast 2015 to 2032, by Technology

Table 05: Global Market Value (US$ Million) Analysis and Forecast 2015 to 2032, by End User

Table 06: North America Market Value (US$ Million) Analysis 2015 to 2021 and Forecast 2022 to 2032, by Country

Table 07: North America Market Value (US$ Million) Analysis and Forecast 2015 to 2032, by Product

Table 08: North America Market Volume (Units) Analysis and Forecast 2015 to 2032, by Product

Table 09: North America Market Value (US$ Million) Analysis and Forecast 2015 to 2032, by Motor Type

Table 10: North America Market Value (US$ Million) Analysis and Forecast 2015 to 2032, by Technology

Table 11: North America Market Value (US$ Million) Analysis and Forecast 2015 to 2032, by End User

Table 12: Latin America Market Value (US$ Million) Analysis 2015 to 2021 and Forecast 2022 to 2032, by Country

Table 13: Latin America Market Value (US$ Million) Analysis and Forecast 2015 to 2032, by Product

Table 14: Latin America Market Volume (Units) Analysis and Forecast 2015 to 2032, by Product

Table 15: Latin America Market Value (US$ Million) Analysis and Forecast 2015 to 2032, by Motor Type

Table 16: Latin America Market Value (US$ Million) Analysis and Forecast 2015 to 2032, by Technology

Table 17: Latin America Market Value (US$ Million) Analysis and Forecast 2015 to 2032, by End User

Table 18: Europe Market Value (US$ Million) Analysis 2015 to 2021 and Forecast 2022 to 2032, by Country

Table 19: Europe Market Value (US$ Million) Analysis and Forecast 2015 to 2032, by Product

Table 20: Europe Market Volume (Units) Analysis and Forecast 2015 to 2032, by Product

Table 21: Europe Market Value (US$ Million) Analysis and Forecast 2015 to 2032, by Motor Type

Table 22: Europe Market Value (US$ Million) Analysis and Forecast 2015 to 2032, by Technology

Table 23: Europe Market Value (US$ Million) Analysis and Forecast 2015 to 2032, by End User

Table 24: South Asia Market Value (US$ Million) Analysis 2015 to 2021 and Forecast 2022 to 2032, by Country

Table 25: South Asia Market Value (US$ Million) Analysis and Forecast 2015 to 2032, by Product

Table 26: South Asia Market Volume (Units) Analysis and Forecast 2015 to 2032, by Product

Table 27: South Asia Market Value (US$ Million) Analysis and Forecast 2015 to 2032, by Motor Type

Table 28: South Asia Market Value (US$ Million) Analysis and Forecast 2015 to 2032, by Technology

Table 29: South Asia Market Value (US$ Million) Analysis and Forecast 2015 to 2032, by End User

Table 30: East Asia Market Value (US$ Million) Analysis 2015 to 2021 and Forecast 2022 to 2032, by Country

Table 31: East Asia Market Value (US$ Million) Analysis and Forecast 2015 to 2032, by Product

Table 32: East Asia Market Volume (Units) Analysis and Forecast 2015 to 2032, by Product

Table 33: East Asia Market Value (US$ Million) Analysis and Forecast 2015 to 2032, by Motor Type

Table 34: East Asia Market Value (US$ Million) Analysis and Forecast 2015 to 2032, by Technology

Table 35: East Asia Market Value (US$ Million) Analysis and Forecast 2015 to 2032, by End User

Table 36: Oceania Market Value (US$ Million) Analysis 2015 to 2021 and Forecast 2022 to 2032, by Country

Table 37: Oceania Market Value (US$ Million) Analysis and Forecast 2015 to 2032, by Product

Table 38: Oceania Market Volume (Units) Analysis and Forecast 2015 to 2032, by Product

Table 39: Oceania Market Value (US$ Million) Analysis and Forecast 2015 to 2032, by Motor Type

Table 40: Oceania Market Value (US$ Million) Analysis and Forecast 2015 to 2032, by Technology

Table 41: Oceania Market Value (US$ Million) Analysis and Forecast 2015 to 2032, by End User

Table 42: MEA Market Value (US$ Million) Analysis 2015 to 2021 and Forecast 2022 to 2032, by Country

Table 43: MEA Market Value (US$ Million) Analysis and Forecast 2015 to 2032, by Product

Table 44: MEA Market Volume (Units) Analysis and Forecast 2015 to 2032, by Product

Table 45: MEA Market Value (US$ Million) Analysis and Forecast 2015 to 2032, by Motor Type

Table 46: MEA Market Value (US$ Million) Analysis and Forecast 2015 to 2032, by Technology

Table 47: MEA Market Value (US$ Million) Analysis and Forecast 2015 to 2032, by End User

List of Charts

Figure 01: Global Market Volume (Units), 2015 to 2021

Figure 02: Global Market Volume (Units) & Y-o-Y Growth (%) Analysis,

Figure 03: Electric Handpiece, Pricing Analysis per unit (US$), in 2022

Figure 04: Electric Handpiece, Pricing Forecast per unit (US$), in 2032

Figure 05: Global Market Value (US$ Million) Analysis, 2015 to 2021

Figure 06: Global Market Forecast & Y-o-Y Growth, 2022 to 2032

Figure 07: Global Market Absolute $ Opportunity (US$ Million) Analysis, 2021 to 2032

Figure 08: Global Market Value Share (%) Analysis 2022 and 2032, by Product

Figure 09: Global Market Y-o-Y Growth (%) Analysis 2021 to 2032, by Product

Figure 10: Global Market Attractiveness Analysis 2022 to 2032, by Product

Figure 11: Global Market Value Share (%) Analysis 2022 and 2032, by Motor Type

Figure 12: Global Market Y-o-Y Growth (%) Analysis 2021 to 2032, by Motor Type

Figure 13: Global Market Attractiveness Analysis 2022 to 2032, by Motor Type

Figure 14: Global Market Value Share (%) Analysis 2022 and 2032, by Technology

Figure 15: Global Market Y-o-Y Growth (%) Analysis 2021 to 2032, by Technology

Figure 16: Global Market Attractiveness Analysis 2022 to 2032, by Technology

Figure 17: Global Market Value Share (%) Analysis 2022 and 2032, by End User

Figure 18: Global Market Y-o-Y Growth (%) Analysis 2021 to 2032, by End User

Figure 19: Global Market Attractiveness Analysis 2022 to 2032, by End User

Figure 20: Global Market Value Share (%) Analysis 2022 and 2032, by Region

Figure 21: Global Market Y-o-Y Growth (%) Analysis 2021 to 2032, by Region

Figure 22: Global Market Attractiveness Analysis 2022 to 2032, by Region

Figure 23: North America Market Value (US$ Million) Analysis, 2015 to 2021

Figure 24: North America Market Value (US$ Million) Forecast, 2022 to 2032

Figure 25: North America Market Value Share, by Product (2022 E)

Figure 26: North America Market Value Share, by Motor Type (2022 E)

Figure 27: North America Market Value Share, by Technology (2022 E)

Figure 28: North America Market Value Share, by End User (2022 E)

Figure 29: North America Market Value Share, by Country (2022 E)

Figure 30: North America Market Attractiveness Analysis by Product, 2022 to 2032

Figure 31: North America Market Attractiveness Analysis by Motor Type, 2022 to 2032

Figure 32: North America Market Attractiveness Analysis by Technology, 2022 to 2032

Figure 33: North America Market Attractiveness Analysis by End User, 2022 to 2032

Figure 34: North America Market Attractiveness Analysis by Country, 2022 to 2032

Figure 35: USA Market Value Proportion Analysis, 2021

Figure 36: Global Vs. USA Growth Comparison

Figure 37: USA Market Share Analysis (%) by Product, 2021 to 2032

Figure 38: USA Market Share Analysis (%) by Motor Type, 2021 to 2032

Figure 39: USA Market Share Analysis (%) by Technology, 2021 to 2032

Figure 40: USA Market Share Analysis (%) by End User, 2021 to 2032

Figure 41: Canada Market Value Proportion Analysis, 2021

Figure 42: Global Vs. Canada. Growth Comparison

Figure 43: Canada Market Share Analysis (%) by Product, 2021 to 2032

Figure 44: Canada Market Share Analysis (%) by Motor Type, 2021 to 2032

Figure 45: Canada Market Share Analysis (%) by Technology, 2021 to 2032

Figure 46: Canada Market Share Analysis (%) by End User, 2021 to 2032

Figure 47: Latin America Market Value (US$ Million) Analysis, 2015 to 2021

Figure 48: Latin America Market Value (US$ Million) Forecast, 2022 to 2032

Figure 49: Latin America Market Value Share, by Product (2022 E)

Figure 50: Latin America Market Value Share, by Motor Type (2022 E)

Figure 51: Latin America Market Value Share, by Technology (2022 E)

Figure 52: Latin America Market Value Share, by End User (2022 E)

Figure 53: Latin America Market Value Share, by Country (2022 E)

Figure 54: Latin America Market Attractiveness Analysis by Product, 2022 to 2032

Figure 55: Latin America Market Attractiveness Analysis by Motor Type, 2022 to 2032

Figure 56: Latin America Market Attractiveness Analysis by Technology, 2022 to 2032

Figure 57: Latin America Market Attractiveness Analysis by End User, 2022 to 2032

Figure 58: Latin America Market Attractiveness Analysis by Country, 2022 to 2032

Figure 59: Mexico Market Value Proportion Analysis, 2021

Figure 60: Global Vs Mexico Growth Comparison

Figure 61: Mexico Market Share Analysis (%) by Product, 2021 to 2032

Figure 62: Mexico Market Share Analysis (%) by Motor Type, 2021 to 2032

Figure 63: Mexico Market Share Analysis (%) by Technology, 2021 to 2032

Figure 64: Mexico Market Share Analysis (%) by End User, 2021 to 2032

Figure 65: Brazil Market Value Proportion Analysis, 2021

Figure 66: Global Vs. Brazil. Growth Comparison

Figure 67: Brazil Market Share Analysis (%) by Product, 2021 to 2032

Figure 68: Brazil Market Share Analysis (%) by Motor Type, 2021 to 2032

Figure 69: Brazil Market Share Analysis (%) by Technology, 2021 to 2032

Figure 70: Brazil Market Share Analysis (%) by End User, 2021 to 2032

Figure 71: Argentina Market Value Proportion Analysis, 2021

Figure 72: Global Vs Argentina Growth Comparison

Figure 73: Argentina Market Share Analysis (%) by Product, 2021 to 2032

Figure 74: Argentina Market Share Analysis (%) by Motor Type, 2021 to 2032

Figure 75: Argentina Market Share Analysis (%) by Technology, 2021 to 2032

Figure 76: Argentina Market Share Analysis (%) by End User, 2021 to 2032

Figure 77: Europe Market Value (US$ Million) Analysis, 2015 to 2021

Figure 78: Europe Market Value (US$ Million) Forecast, 2022 to 2032

Figure 79: Europe Market Value Share, by Product (2022 E)

Figure 80: Europe Market Value Share, by Motor Type (2022 E)

Figure 81: Europe Market Value Share, by Technology (2022 E)

Figure 82: Europe Market Value Share, by End User (2022 E)

Figure 83: Europe Market Value Share, by Country (2022 E)

Figure 84: Europe Market Attractiveness Analysis by Product, 2022 to 2032

Figure 85: Europe Market Attractiveness Analysis by Motor Type, 2022 to 2032

Figure 86: Europe Market Attractiveness Analysis by Technology, 2022 to 2032

Figure 87: Europe Market Attractiveness Analysis by End User, 2022 to 2032

Figure 88: Europe Market Attractiveness Analysis by Country, 2022 to 2032

Figure 89: UK Market Value Proportion Analysis, 2021

Figure 90: Global Vs. UK Growth Comparison

Figure 91: UK Market Share Analysis (%) by Product, 2021 to 2032

Figure 92: UK Market Share Analysis (%) by Motor Type, 2021 to 2032

Figure 93: UK Market Share Analysis (%) by Technology, 2021 to 2032

Figure 94: UK Market Share Analysis (%) by End User, 2021 to 2032

Figure 95: Germany Market Value Proportion Analysis, 2021

Figure 96: Global Vs. Germany Growth Comparison

Figure 97: Germany Market Share Analysis (%) by Product, 2021 to 2032

Figure 98: Germany Market Share Analysis (%) by Motor Type, 2021 to 2032

Figure 99: Germany Market Share Analysis (%) by Technology, 2021 to 2032

Figure 100: Germany Market Share Analysis (%) by End User, 2021 to 2032

Figure 101: Italy Market Value Proportion Analysis, 2021

Figure 102: Global Vs. Italy Growth Comparison

Figure 103: Italy Market Share Analysis (%) by Product, 2021 to 2032

Figure 104: Italy Market Share Analysis (%) by Motor Type, 2021 to 2032

Figure 105: Italy Market Share Analysis (%) by Technology, 2021 to 2032

Figure 106: Italy Market Share Analysis (%) by End User, 2021 to 2032

Figure 107: France Market Value Proportion Analysis, 2021

Figure 108: Global Vs France Growth Comparison

Figure 109: France Market Share Analysis (%) by Product, 2021 to 2032

Figure 110: France Market Share Analysis (%) by Motor Type, 2021 to 2032

Figure 111: France Market Share Analysis (%) by Technology, 2021 to 2032

Figure 112: France Market Share Analysis (%) by End User, 2021 to 2032

Figure 113: Spain Market Value Proportion Analysis, 2021

Figure 114: Global Vs Spain Growth Comparison

Figure 115: Spain Market Share Analysis (%) by Product, 2021 to 2032

Figure 116: Spain Market Share Analysis (%) by Motor Type, 2021 to 2032

Figure 117: Spain Market Share Analysis (%) by Technology, 2021 to 2032

Figure 118: Spain Market Share Analysis (%) by End User, 2021 to 2032

Figure 119: Russia Market Value Proportion Analysis, 2021

Figure 120: Global Vs Russia Growth Comparison

Figure 121: Russia Market Share Analysis (%) by Product, 2021 to 2032

Figure 122: Russia Market Share Analysis (%) by Motor Type, 2021 to 2032

Figure 123: Russia Market Share Analysis (%) by Technology, 2021 to 2032

Figure 124: Russia Market Share Analysis (%) by End User, 2021 to 2032

Figure 125: BENELUX Market Value Proportion Analysis, 2021

Figure 126: Global Vs BENELUX Growth Comparison

Figure 127: BENELUX Market Share Analysis (%) by Product, 2021 to 2032

Figure 128: BENELUX Market Share Analysis (%) by Motor Type, 2021 to 2032

Figure 129: BENELUX Market Share Analysis (%) by Technology, 2021 to 2032

Figure 130: BENELUX Market Share Analysis (%) by End User, 2021 to 2032

Figure 131: East Asia Market Value (US$ Million) Analysis, 2015 to 2021

Figure 132: East Asia Market Value (US$ Million) Forecast, 2022 to 2032

Figure 133: East Asia Market Value Share, by Product (2022 E)

Figure 134: East Asia Market Value Share, by Motor Type (2022 E)

Figure 135: East Asia Market Value Share, by Technology (2022 E)

Figure 136: East Asia Market Value Share, by End User (2022 E)

Figure 137: East Asia Market Value Share, by Country (2022 E)

Figure 138: East Asia Market Attractiveness Analysis by Product, 2022 to 2032

Figure 139: East Asia Market Attractiveness Analysis by Motor Type, 2022 to 2032

Figure 140: East Asia Market Attractiveness Analysis by Technology, 2022 to 2032

Figure 141: East Asia Market Attractiveness Analysis by End User, 2022 to 2032

Figure 142: East Asia Market Attractiveness Analysis by Country, 2022 to 2032

Figure 143: China Market Value Proportion Analysis, 2021

Figure 144: Global Vs. China Growth Comparison

Figure 145: China Market Share Analysis (%) by Product, 2021 to 2032

Figure 146: China Market Share Analysis (%) by Motor Type, 2021 to 2032

Figure 147: China Market Share Analysis (%) by Technology, 2021 to 2032

Figure 148: China Market Share Analysis (%) by End User, 2021 to 2032

Figure 149: Japan Market Value Proportion Analysis, 2021

Figure 150: Global Vs. Japan Growth Comparison

Figure 151: Japan Market Share Analysis (%) by Product, 2021 to 2032

Figure 152: Japan Market Share Analysis (%) by Motor Type, 2021 to 2032

Figure 153: Japan Market Share Analysis (%) by Technology, 2021 to 2032

Figure 154: Japan Market Share Analysis (%) by End User, 2021 to 2032

Figure 155: South Korea Market Value Proportion Analysis, 2021

Figure 156: Global Vs South Korea Growth Comparison

Figure 157: South Korea Market Share Analysis (%) by Product, 2021 to 2032

Figure 158: South Korea Market Share Analysis (%) by Motor Type, 2021 to 2032

Figure 159: South Korea Market Share Analysis (%) by Technology, 2021 to 2032

Figure 160: South Korea Market Share Analysis (%) by End User, 2021 to 2032

Figure 161: South Asia Market Value (US$ Million) Analysis, 2015 to 2021

Figure 162: South Asia Market Value (US$ Million) Forecast, 2022 to 2032

Figure 163: South Asia Market Value Share, by Product (2022 E)

Figure 164: South Asia Market Value Share, by Motor Type (2022 E)

Figure 165: South Asia Market Value Share, by Technology (2022 E)

Figure 166: South Asia Market Value Share, by End User (2022 E)

Figure 167: South Asia Market Value Share, by Country (2022 E)

Figure 168: South Asia Market Attractiveness Analysis by Product, 2022 to 2032

Figure 169: South Asia Market Attractiveness Analysis by Motor Type, 2022 to 2032

Figure 170: South Asia Market Attractiveness Analysis by Technology, 2022 to 2032

Figure 171: South Asia Market Attractiveness Analysis by End User, 2022 to 2032

Figure 172: South Asia Market Attractiveness Analysis by Country, 2022 to 2032

Figure 173: India Market Value Proportion Analysis, 2021

Figure 174: Global Vs. India Growth Comparison

Figure 175: India Market Share Analysis (%) by Product, 2021 to 2032

Figure 176: India Market Share Analysis (%) by Motor Type, 2021 to 2032

Figure 177: India Market Share Analysis (%) by Technology, 2021 to 2032

Figure 178: India Market Share Analysis (%) by End User, 2021 to 2032

Figure 179: Indonesia Market Value Proportion Analysis, 2021

Figure 180: Global Vs. Indonesia Growth Comparison

Figure 181: Indonesia Market Share Analysis (%) by Product, 2021 to 2032

Figure 182: Indonesia Market Share Analysis (%) by Motor Type, 2021 to 2032

Figure 183: Indonesia Market Share Analysis (%) by Technology, 2021 to 2032

Figure 184: Indonesia Market Share Analysis (%) by End User, 2021 to 2032

Figure 185: Malaysia Market Value Proportion Analysis, 2021

Figure 186: Global Vs. Malaysia Growth Comparison

Figure 187: Malaysia Market Share Analysis (%) by Product, 2021 to 2032

Figure 188: Malaysia Market Share Analysis (%) by Motor Type, 2021 to 2032

Figure 189: Malaysia Market Share Analysis (%) by Technology, 2021 to 2032

Figure 190: Malaysia Market Share Analysis (%) by End User, 2021 to 2032

Figure 191: Thailand Market Value Proportion Analysis, 2021

Figure 192: Global Vs. Thailand Growth Comparison

Figure 193: Thailand Market Share Analysis (%) by Product, 2021 to 2032

Figure 194: Thailand Market Share Analysis (%) by Motor Type, 2021 to 2032

Figure 195: Thailand Market Share Analysis (%) by Technology, 2021 to 2032

Figure 196: Thailand Market Share Analysis (%) by End User, 2021 to 2032

Figure 197: Oceania Market Value (US$ Million) Analysis, 2015 to 2021

Figure 198: Oceania Market Value (US$ Million) Forecast, 2022 to 2032

Figure 199: Oceania Market Value Share, by Product (2022 E)

Figure 200: Oceania Market Value Share, by Motor Type (2022 E)

Figure 201: Oceania Market Value Share, by Technology (2022 E)

Figure 202: Oceania Market Value Share, by End User (2022 E)

Figure 203: Oceania Market Value Share, by Country (2022 E)

Figure 204: Oceania Market Attractiveness Analysis by Product, 2022 to 2032

Figure 205: Oceania Market Attractiveness Analysis by Motor Type, 2022 to 2032

Figure 206: Oceania Market Attractiveness Analysis by Technology, 2022 to 2032

Figure 207: Oceania Market Attractiveness Analysis by End User, 2022 to 2032

Figure 208: Oceania Market Attractiveness Analysis by Country, 2022 to 2032

Figure 209: Australia Market Value Proportion Analysis, 2021

Figure 210: Global Vs. Australia Growth Comparison

Figure 211: Australia Market Share Analysis (%) by Product, 2021 to 2032

Figure 212: Australia Market Share Analysis (%) by Motor Type, 2021 to 2032

Figure 213: Australia Market Share Analysis (%) by Technology, 2021 to 2032

Figure 214: Australia Market Share Analysis (%) by End User, 2021 to 2032

Figure 215: New Zealand Market Value Proportion Analysis, 2021

Figure 216: Global Vs New Zealand Growth Comparison

Figure 217: New Zealand Market Share Analysis (%) by Product, 2021 to 2032

Figure 218: New Zealand Market Share Analysis (%) by Motor Type, 2021 to 2032

Figure 219: New Zealand Market Share Analysis (%) by Technology, 2021 to 2032

Figure 220: New Zealand Market Share Analysis (%) by End User, 2021 to 2032

Figure 221: Middle East & Africa Market Value (US$ Million) Analysis, 2015 to 2021

Figure 222: Middle East & Africa Market Value (US$ Million) Forecast, 2022 to 2032

Figure 223: Middle East & Africa Market Value Share, by Product (2022 E)

Figure 224: Middle East & Africa Market Value Share, by Motor Type (2022 E)

Figure 225: Middle East & Africa Market Value Share, by Technology (2022 E)

Figure 226: Middle East & Africa Market Value Share, by End User (2022 E)

Figure 227: Middle East & Africa Market Value Share, by Country (2022 E)

Figure 228: Middle East & Africa Market Attractiveness Analysis by Product, 2022 to 2032

Figure 229: Middle East & Africa Market Attractiveness Analysis by Motor Type, 2022 to 2032

Figure 230: Middle East & Africa Market Attractiveness Analysis by Technology, 2022 to 2032

Figure 231: Middle East & Africa Market Attractiveness Analysis by End User, 2022 to 2032

Figure 232: Middle East & Africa Market Attractiveness Analysis by Country, 2022 to 2032

Figure 233: GCC Countries Market Value Proportion Analysis, 2021

Figure 234: Global Vs GCC Countries Growth Comparison

Figure 235: GCC Countries Market Share Analysis (%) by Product, 2021 to 2032

Figure 236: GCC Countries Market Share Analysis (%) by Motor Type, 2021 to 2032

Figure 237: GCC Countries Market Share Analysis (%) by Technology, 2021 to 2032

Figure 238: GCC Countries Market Share Analysis (%) by End User, 2021 to 2032

Figure 239: Turkey Market Value Proportion Analysis, 2021

Figure 240: Global Vs. Turkey Growth Comparison

Figure 241: Turkey Market Share Analysis (%) by Product, 2021 to 2032

Figure 242: Turkey Market Share Analysis (%) by Motor Type, 2021 to 2032

Figure 243: Turkey Market Share Analysis (%) by Technology, 2021 to 2032

Figure 244: Turkey Market Share Analysis (%) by End User, 2021 to 2032

Figure 245: South Africa Market Value Proportion Analysis, 2021

Figure 246: Global Vs. South Africa Growth Comparison

Figure 247: South Africa Market Share Analysis (%) by Product, 2021 to 2032

Figure 248: South Africa Market Share Analysis (%) by Motor Type, 2021 to 2032

Figure 249: South Africa Market Share Analysis (%) by Technology, 2021 to 2032

Figure 250: South Africa Market Share Analysis (%) by End User, 2021 to 2032

Figure 251: North Africa Market Value Proportion Analysis, 2021

Figure 252: Global Vs North Africa Growth Comparison

Figure 253: North Africa Market Share Analysis (%) by Product, 2021 to 2032

Figure 254: North Africa Market Share Analysis (%) by Motor Type, 2021 to 2032

Figure 255: North Africa Market Share Analysis (%) by Technology, 2021 to 2032

Figure 256: North Africa Market Share Analysis (%) by End User, 2021 to 2032

Recommendations

Healthcare

Dental Service Market

Published : April 2024

Healthcare

Dental Imaging Equipment Market

Published : February 2024

Healthcare

Dental Caries and Endodontic Market

Published : September 2023

Healthcare

Lights for Dental Healthcare Market

Published : February 2023

Explore Healthcare Insights

View Reports

Electric Handpiece Market