Electric Lift Truck Market Size, Share, and Forecast Outlook 2025 to 2035

The electric lift truck market is forecast to reach USD 57 billion by 2025, growing at a compound annual growth rate of 14.6%. Applying this growth rate over the next 10 years results in a multiplying factor of approximately 4.61, which means the market value is expected to exceed USD 263 billion by 2035. This increase reflects growing adoption of electric lift trucks in warehouses, manufacturing, and logistics due to stricter emission rules and the drive to reduce operating expenses. Companies are shifting from diesel and gas-powered models to electric alternatives that offer lower maintenance and environmental impact

Quick stats of Electric Lift Truck Market

  • Electric Lift Truck Market Size (2025): USD 57 billion
  • Projected Electric Lift Truck Market Size (2035): Exceeding USD 263 billion
  • Forecast CAGR of Electric Lift Truck Market (2025 to 2035): 14.6%
  • Leading Product Segment of Electric Lift Truck Market (2025): Counterbalanced Trucks (40%)
  • Key Growth Regions of Electric Lift Truck Market: North America, Asia-Pacific, Europe
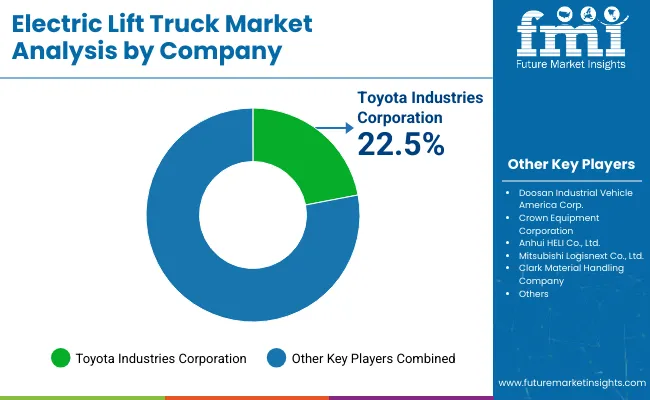
  • Top Key Player of Electric Lift Truck Market:Toyota Industries Corporation holds 22.5% of the industry share

Electric Lift Truck Market (2)

Metric Value
Industry Size (2025E) USD 57 billion
Industry Value (2035F) USD 263 billion
CAGR (2025 to 2035) 14.6%

Market saturation analysis indicates the sector remains far from maturity. Adoption is expanding globally as electric lift trucks become more common across industries. Saturation might occur when these vehicles dominate most regions, especially where environmental regulations and incentives encourage their use.

Current market penetration remains below capacity, leaving room for further growth. Challenges such as infrastructure development and initial costs could affect adoption speed in some markets, but ongoing technological improvements and cost declines support expansion. The multiplying factor and growth outlook suggest the market will continue to expand well beyond 2035, with no immediate saturation risk.

The electric lift truck market holds distinct shares across its parent markets, reflecting its specialized role. Within the material handling equipment market, electric lift trucks represent approximately 5-7%. In the broader industrial equipment market, the share is around 3-5%.

Their presence is more significant in the warehouse and logistics equipment market, accounting for about 20-25%, and within the electric vehicle market, the share is estimated at 3-5%. In the broader commercial vehicles market, electric lift trucks comprise roughly 1-2%, highlighting their specialized nature. These percentages underscore the unique position of electric lift trucks in the industrial landscape.

The market is experiencing significant advancements.Key manufacturers are investing in lithium-ion battery technology, enhancing energy efficiency and reducing downtime.Companies are integrating automation and telematics into lift trucks, improving operational efficiency and safety.There is a growing emphasis on sustainability, with firms adopting eco-friendly practices and materials.

Strategic partnerships are being formed to expand market reach and capabilities.Additionally, the development of charging infrastructure is being prioritized to support the widespread adoption of electric lift trucks.These trends indicate a dynamic shift towards more efficient, sustainable, and technologically advanced material handling solutions.

Top Electric Lift Truck Market Dynamics

The electric lift truck market is growing steadily as companies adopt energy-efficient and eco-friendly material handling solutions. Significant improvements in lithium-ion batteries have increased operational runtimes by approximately 40% compared to traditional lead-acid batteries. Investment in warehouse automation, surpassing USD 20 billion globally, supports rising demand in logistics and manufacturing sectors.

Strict emission regulations in regions such as North America, Europe, and Asia favor electric lift trucks due to their zero on-site emissions. Despite higher upfront costs, electric trucks lower operational expenses by nearly 30% through savings on fuel and maintenance.

Rising Warehouse Automation Budgets and Emission Regulations Accelerate Demand

Warehouse automation spending is increasing annually by 10-15%, creating significant demand for electric lift trucks. Their compatibility with automated systems and clean operation make them preferred choices in modern warehouses. Emission regulations in major markets limit diesel truck use, steering companies toward electric alternatives.

Lithium-ion battery prices have declined around 20% over the past five years, improving the cost-effectiveness of electric lift trucks. Additionally, e-commerce growth, expected to increase by more than 14% annually, fuels the need for efficient material handling equipment. Together, these factors boost adoption rates and strengthen market expansion.

Higher Upfront Costs and Charging Infrastructure Limit Broader Adoption

Electric lift trucks come with initial costs that are 20-40% higher than diesel or LPG models, posing challenges for budget-sensitive buyers. Charging infrastructure installation ranges between USD 10,000 and USD 50,000 per facility, adding to total investment costs. Charging lead-acid batteries typically takes 6-8 hours, which can reduce operational uptime without access to fast-charging solutions.

Battery maintenance requires skilled technicians, increasing complexity and expenses. Moreover, battery replacement cycles generally occur every 5-7 years, adding further financial considerations. These factors restrict adoption, particularly for small and medium-sized enterprises.

Opportunities from Faster Charging Batteries and IoT Integration in Fleet Management

The growing adoption of lithium-ion batteries, which recharge approximately 50% faster and last 20-30% longer than lead-acid types, presents significant opportunities. IoT-enabled fleet management systems provide real-time diagnostics and predictive maintenance alerts, reducing downtime by up to 15%. Emerging markets with rapid warehousing growth offer new potential customers.

Leasing and battery-as-a-service business models lower upfront expenses, making electric lift trucks accessible to smaller operators. Increased corporate focus on sustainability further drives demand for zero-emission equipment, opening additional avenues for market growth.

Digitalization, Autonomous Operations, and Sustainability Trends Shaping the Market

Electric lift trucks are increasingly equipped with semi-autonomous navigation and remote monitoring technologies, enhancing safety and operational efficiency. Large warehouses adopting autonomous forklifts report labor cost reductions of around 20%. Cloud-based maintenance platforms improve fleet management by optimizing uptime and asset tracking.

Manufacturers focus on sustainable practices, developing recyclable battery technologies and eco-friendly production methods. Collaboration between electric lift truck makers and technology companies accelerates innovation, aligning products with stricter emission standards and evolving customer needs. These trends collectively influence the future direction of the market.

Analyzing Electric Lift Truck Market by Leading Segments

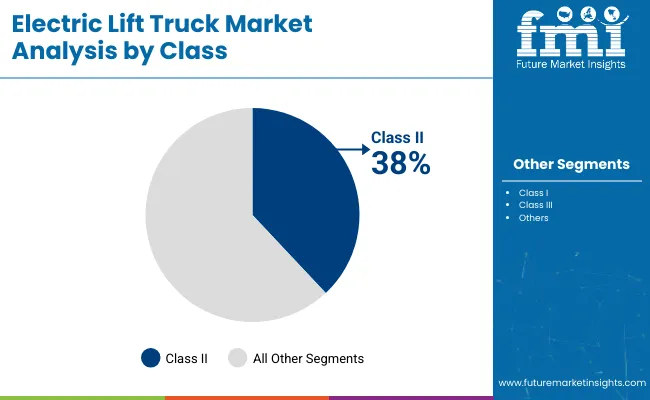
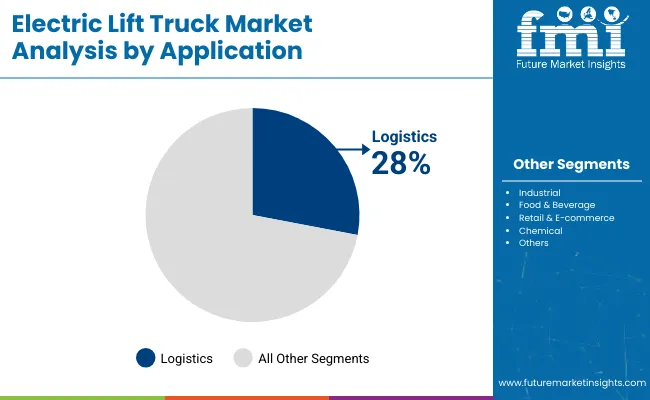
The electric lift truck market in 2025 is anchored by counterbalanced trucks with 40% share, preferred for broad load handling in various industries. Class II trucks hold 38%, valued for aisle navigation and warehouse efficiency. Logistics leads applications at 28%, fueled by e-commerce growth.

Reach trucks at 25% serve high-density storage needs. Industrial and food & beverage sectors contribute 24% and 18%, reflecting specialized operational demands. Market investment focuses on extending battery life, enhancing safety systems, and integrating automation for improved material flow and cost management.
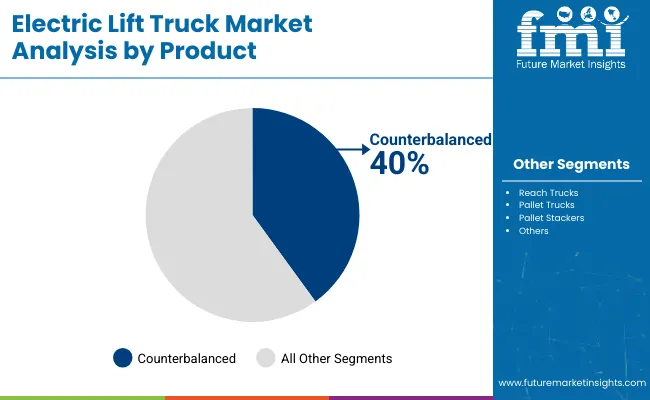
Counterbalanced trucks command 40% product segment

Electric Lift Truck Market By Product

Counterbalanced trucks represent 40% of the product segment, favored for handling uneven or bulky loads due to their rear counterweight design. Their versatility supports loading dock operations and outdoor yard movements, increasing operational scope by nearly 25%. These trucks are often equipped with regenerative braking systems that recover up to 10% of energy during deceleration, improving overall efficiency. Modern models offer modular battery options enabling fast swapping, minimizing downtime during shifts. Their robust chassis design helps reduce maintenance frequency by about 15%, lowering lifecycle costs.
  • Rear counterweight design supports uneven and bulky load handling
  • Regenerative braking recovers up to 10% energy, boosting efficiency
  • Modular batteries enable fast swapping to minimize downtime

Class II trucks lead with 38% share by class

Electric Lift Truck Market By Class

Class II trucks secure 38% market share, optimized for compact warehouse layouts. Their smaller turning radius, reduced by 12% compared to standard forklifts, allows easier navigation in tight spaces. These trucks often include digital load sensors that prevent overloading by alerting operators when exceeding safe thresholds, reducing equipment damage risk. Class II models typically feature enhanced battery management systems that extend battery lifespan by 20%. Their quiet operation, producing 30% less noise, makes them ideal for indoor environments like retail warehouses and food storage facilities.
  • Turning radius reduced by 12% for superior aisle navigation
  • Digital sensors alert operators to prevent overloading damage
  • Battery management systems extend battery lifespan by 20%

Logistics applications dominate with 28% share

Electric Lift Truck Market By Application

Logistics uses account for 28% of the market, driven by the need for rapid pallet handling across distribution networks. Electric lift trucks in this sector can operate continuously for 10+ hours with optimized battery usage, supporting multiple shifts. Integration with warehouse management software allows real-time inventory tracking, reducing pick errors by up to 18%. Trucks designed for logistics often have enhanced telematics to monitor operator behavior, which can improve safety compliance by 22%. Their adaptability to various pallet sizes increases operational flexibility across heterogeneous goods.
  • Continuous operation exceeding 10 hours supports multi-shift workflows
  • Warehouse software integration reduces pick errors by up to 18%
  • Telematics improve safety compliance by approximately 22%

Top Countries Driving Electric Lift Truck Market Growth

Electric Lift Truck Market Country

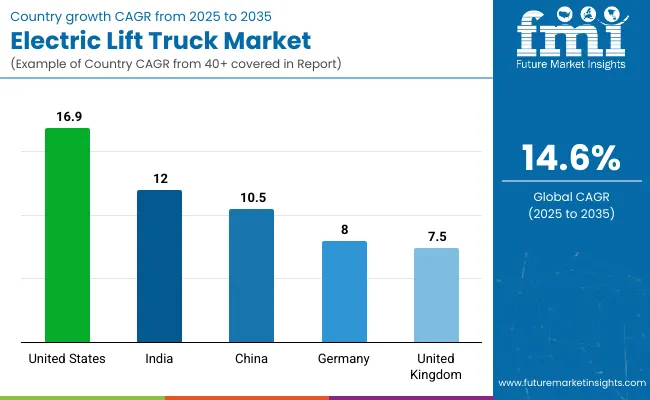
The market is projected to grow at a CAGR of 14.6% from 2025 to 2035. The United States leads with a CAGR of 16.9%, exceeding the global average by +16%. India follows with 12.0%, trailing the global rate by -18%. China records a CAGR of 10.5%, which is -28% below the global figure. Germany and the United Kingdom show more moderate growth at 8.0% and 7.5%, respectively, both significantly below the global benchmark by -45% and -49%.

Growth in the United States is supported by rapid adoption of green warehouse technologies within the OECD, while BRICS countries such as India and China advance through expanding industrial automation. ASEAN regions are anticipated to contribute indirectly through rising demand for efficient material handling solutions. These variations highlight differing market maturity levels and investment focuses across developed and emerging economies.

Growth Analysis of Electric Lift Truck Market in the United States

The electric lift truck market in the United States is forecast to expand at a CAGR of 16.9%, driven by increased adoption in warehousing, logistics, and manufacturing sectors. Companies prioritize energy-efficient and low-emission equipment to reduce operating costs and comply with environmental standards. Technological advances such as longer battery life and fast-charging capabilities improve operational uptime. Leasing programs help small and medium enterprises access modern electric lift trucks without heavy upfront investments. Rising e-commerce demand fuels warehouse automation, further accelerating market growth.

  • Battery life improvements increased average operational hours by 20%.
  • Fast-charging systems reduce downtime between shifts by up to 30%.
  • Leasing programs contribute to 35% of new electric lift truck acquisitions.

Analysis of Electric Lift Truck Market in India

The demand of electric lift truck in India is expected to grow at a CAGR of 12.0%, supported by expanding industrial infrastructure and logistics modernization. Increasing focus on reducing emissions and improving workplace safety encourages adoption of electric models over diesel alternatives. Local manufacturers are developing cost-effective electric lift trucks tailored to Indian operating conditions. Government incentives for clean energy equipment facilitate wider use. Growth in organized retail and e-commerce sectors drives demand for material handling solutions with low maintenance and operational costs.

  • Local electric lift truck models saw a 25% increase in sales in the last two years.
  • Government incentives reduced acquisition costs by approximately 10%.
  • Organized retail expansion led to 18% growth in warehouse electric lift truck usage.

Demand Forecast for Electric Lift Truck Market in China

The electric lift truck market in China is forecast to grow at a CAGR of 10.5%, propelled by expanding manufacturing output and warehouse automation. The government promotes electric vehicles to reduce urban pollution, encouraging fleet electrification. Leading manufacturers invest heavily in battery technology and integrated telematics systems to improve performance and fleet management. Large-scale logistics hubs incorporate electric lift trucks to meet environmental regulations and increase operational efficiency. Battery swapping infrastructure is gradually improving, supporting extended operational hours.

  • Battery swapping stations increased by 22% in major logistics hubs over the past three years.
  • Telematics integration improved fleet utilization rates by 17%.
  • Government policies contributed to a 14% rise in electric lift truck fleet size.

Electric Lift Truck Market Growth Outlook in Germany

The electric lift truck market in Germany is projected to grow at a CAGR of 8.0%, supported by stringent emission standards and automation trends in manufacturing. Industrial operators prefer electric lift trucks equipped with advanced safety features and energy recovery systems. Integration with digital warehouse management systems enhances productivity and reduces energy waste. Incentives for electric vehicle adoption contribute to steady market expansion. Focus on ergonomics and operator comfort supports longer shift durations with reduced fatigue.

  • Energy recovery systems improved battery efficiency by 12%.
  • Integration with warehouse management systems increased throughput by 15%.
  • Operator ergonomic improvements lowered fatigue-related incidents by 9%.

Future Outlook for Electric Lift Truck Market in the United Kingdom

The United Kingdom electric lift truck market is forecast to grow at a CAGR of 7.5%, driven by growing warehouse automation and environmental regulations. Operators are adopting electric lift trucks to reduce carbon footprints and operating expenses. Increasing investment in battery technology enhances charge cycles and reduces charging times. Rental and leasing models help lower entry barriers for smaller companies. Enhanced safety protocols and operator training programs improve workplace safety and efficiency.
  • Battery charge cycle improvements extended equipment life by 18%.
  • Leasing and rental accounted for nearly 30% of electric lift truck acquisitions.
  • Safety training programs contributed to a 13% reduction in workplace accidents.

Leading Electric Lift Truck Manufacturers, Suppliers, Distributors

Electric Lift Truck Market By Company

Leading Player - Toyota Industries Corporation holding 22.5% industry share.Leading electric lift truck manufacturers, suppliers, and distributors employ various strategies to strengthen their positions in a competitive market. Doosan Industrial Vehicle America Corp. focuses on expanding its electric forklift range with models offering enhanced battery life and operator comfort. Crown Equipment Corporation invests heavily in research and development to improve energy efficiency and introduce smart control systems, recently launching a series of electric forklifts suited for diverse warehouse applications.

Anhui HELI Co., Ltd. leverages large-scale production capabilities and competitive pricing to capture growing demand in emerging markets. Mitsubishi Logisnext Co., Ltd. enhances its product portfolio through incremental improvements in maneuverability and safety features, targeting logistics and manufacturing sectors.

Clark Material Handling Company emphasizes durability and service support, introducing new electric lift trucks designed for heavy-duty operations. Konecranes and Combilift Material Handling Solutions focus on specialized equipment, including multi-directional electric forklifts, tailored to unique operational challenges. Godrej and Boyce Group and Hangcha Group Co., Ltd. expand through new product launches and strengthened distribution networks in Asia.

HubtexMaschinenbau GmbH & Co. KG and KION GROUP AG offer customized solutions and modular designs to meet specific customer needs. Komatsu Ltd. and Lonking Holdings Limited prioritize expanding electric forklift ranges with enhanced safety features. Hyster-Yale Materials Handling, Inc., Manitou Group, Paletrans Forklifts, and Toyota Industries Corporation maintain their presence through continuous product upgrades, improved ergonomics, and aftersales support. Emerging players concentrate on cost-effective, locally adapted models to gain market share across different regions.

Leading Players

  • Doosan Industrial Vehicle America Corp.
  • Crown Equipment Corporation
  • Anhui HELI Co., Ltd.
  • Mitsubishi Logisnext Co., Ltd.
  • Clark Material Handling Company
  • Konecranes
  • Combilift Material Handling Solutions
  • Godrej and Boyce Group
  • Hangcha Group Co., Ltd.
  • HubtexMaschinenbau GmbH & Co. KG
  • KION GROUP AG
  • Komatsu Ltd.
  • Lonking Holdings Limited
  • Hyster-Yale Materials Handling, Inc.
  • Manitou Group
  • Paletrans Forklifts
  • Toyota Industries Corporation

Report Scope

Report Attributes Details
Market Size (2025) USD 57 billion
Projected Market Size (2035) Exceeding USD 263 billion
CAGR (2025 to 2035) 14.6%
Base Year for Estimation 2024
Historical Period 2020 to 2024
Projections Period 2025 to 2035
Quantitative Units USD billion for value and relevant volume units
Product Types Analyzed (Segment 1) Counterbalanced, Pallet Trucks, Reach Trucks, Pallet Stackers, Others
Classes Analyzed (Segment 2) Class I, Class II, Class III, Others
Applications Analyzed (Segment 3) Chemical, Food & Beverage, Industrial, Logistics, Retail & E-commerce, Others
Regions Covered North America; Europe; Asia Pacific; Latin America; Middle East & Africa
Countries Covered United States, Germany, China, India, Brazil, United Kingdom, Mexico, South Africa, UAE
Key Players Influencing the Market Doosan Industrial Vehicle America Corp., Crown Equipment Corporation, Anhui HELI Co., Ltd., Mitsubishi Logisnext Co., Ltd., Clark Material Handling Company, Konecranes, Combilift Material Handling Solutions, Godrej and Boyce Group, Hangcha Group Co., Ltd., Hubtex Maschinenbau GmbH & Co. KG, KION GROUP AG, Komatsu Ltd., Lonking Holdings Limited, Hyster -Yale Materials Handling, Inc., Manitou Group, Paletrans Forklifts, Toyota Industries Corporation
Additional Attributes Dollar sales by lift truck type and load capacity, demand trends across warehousing, manufacturing, and logistics, regional adoption in North America, Europe, Asia-Pacific, innovation in battery technology, automation, and safety features, environmental impact of energy use and emissions, and new uses in smart warehouses.

Electric Lift Truck Market Analyzed by Key Investment Segments 

By Product:

  • Counterbalanced
  • Pallet Trucks
  • Reach Trucks
  • Pallet Stackers
  • Others

By Class:

  • Class I
  • Class II
  • Class III
  • Others

By Application:

  • Chemical
  • Food & beverage
  • Industrial
  • Logistics
  • Retail & E-commerce
  • Others

By Region:

  • North America
  • Europe
  • Asia Pacific
  • Latin America
  • Middle East & Africa


Table of Content

  1. Executive Summary
    • Global Market Outlook
    • Demand-side Trends
    • Supply-side Trends
    • Technology Roadmap Analysis
    • Analysis and Recommendations
  2. Market Overview
    • Market Coverage / Taxonomy
    • Market Definition / Scope / Limitations
  3. Market Background
    • Market Dynamics
      • Drivers
      • Restraints
      • Opportunity
      • Trends
    • Scenario Forecast
      • Demand in Optimistic Scenario
      • Demand in Likely Scenario
      • Demand in Conservative Scenario
    • Opportunity Map Analysis
    • Product Life Cycle Analysis
    • Supply Chain Analysis
      • Supply Side Participants and their Roles
        • Producers
        • Mid-Level Participants (Traders/ Agents/ Brokers)
        • Wholesalers and Distributors
      • Value Added and Value Created at Node in the Supply Chain
      • List of Raw Material Suppliers
      • List of Existing and Potential Buyer’s
    • Investment Feasibility Matrix
    • Value Chain Analysis
      • Profit Margin Analysis
      • Wholesalers and Distributors
      • Retailers
    • PESTLE and Porter’s Analysis
    • Regulatory Landscape
      • By Key Regions
      • By Key Countries
    • Regional Parent Market Outlook
    • Production and Consumption Statistics
    • Import and Export Statistics
  4. Global Market Analysis 2020 to 2024 and Forecast, 2025 to 2035
    • Historical Market Size Value (USD Billion) & Volume (Units) Analysis, 2020 to 2024
    • Current and Future Market Size Value (USD Billion) & Volume (Units) Projections, 2025 to 2035
      • Y-o-Y Growth Trend Analysis
      • Absolute $ Opportunity Analysis
  5. Global Market Pricing Analysis 2020 to 2024 and Forecast 2025 to 2035
  6. Global Market Analysis 2020 to 2024 and Forecast 2025 to 2035, By Product
    • Introduction / Key Findings
    • Historical Market Size Value (USD Billion) & Volume (Units) Analysis By Product, 2020 to 2024
    • Current and Future Market Size Value (USD Billion) & Volume (Units) Analysis and Forecast By Product, 2025 to 2035
      • Counterbalanced
      • Reach Trucks
      • Pallet Trucks
      • Pallet Stackers
      • Others
    • Y-o-Y Growth Trend Analysis By Product, 2020 to 2024
    • Absolute $ Opportunity Analysis By Product, 2025 to 2035
  7. Global Market Analysis 2020 to 2024 and Forecast 2025 to 2035, By Class
    • Introduction / Key Findings
    • Historical Market Size Value (USD Billion) & Volume (Units) Analysis By Class, 2020 to 2024
    • Current and Future Market Size Value (USD Billion) & Volume (Units) Analysis and Forecast By Class, 2025 to 2035
      • Class II
      • Class I
      • Class III
      • Others
    • Y-o-Y Growth Trend Analysis By Class, 2020 to 2024
    • Absolute $ Opportunity Analysis By Class, 2025 to 2035
  8. Global Market Analysis 2020 to 2024 and Forecast 2025 to 2035, By Application
    • Introduction / Key Findings
    • Historical Market Size Value (USD Billion) & Volume (Units) Analysis By Application, 2020 to 2024
    • Current and Future Market Size Value (USD Billion) & Volume (Units) Analysis and Forecast By Application, 2025 to 2035
      • Logistics
      • Industrial
      • Food & Beverage
      • Retail & E-commerce
      • Chemical
      • Others
    • Y-o-Y Growth Trend Analysis By Application, 2020 to 2024
    • Absolute $ Opportunity Analysis By Application, 2025 to 2035
  9. Global Market Analysis 2020 to 2024 and Forecast 2025 to 2035, By Region
    • Introduction
    • Historical Market Size Value (USD Billion) & Volume (Units) Analysis By Region, 2020 to 2024
    • Current Market Size Value (USD Billion) & Volume (Units) Analysis and Forecast By Region, 2025 to 2035
      • North America
      • Latin America
      • Western Europe
      • Eastern Europe
      • East Asia
      • South Asia & Pacific
      • Middle East and Africa
    • Market Attractiveness Analysis By Region
  10. North America Market Analysis 2020 to 2024 and Forecast 2025 to 2035, By Country
    • Historical Market Size Value (USD Billion) & Volume (Units) Trend Analysis By Market Taxonomy, 2020 to 2024
    • Market Size Value (USD Billion) & Volume (Units) Forecast By Market Taxonomy, 2025 to 2035
      • By Country
        • USA
        • Canada
        • Mexico
      • By Product
      • By Class
      • By Application
    • Market Attractiveness Analysis
      • By Country
      • By Product
      • By Class
      • By Application
    • Key Takeaways
  11. Latin America Market Analysis 2020 to 2024 and Forecast 2025 to 2035, By Country
    • Historical Market Size Value (USD Billion) & Volume (Units) Trend Analysis By Market Taxonomy, 2020 to 2024
    • Market Size Value (USD Billion) & Volume (Units) Forecast By Market Taxonomy, 2025 to 2035
      • By Country
        • Brazil
        • Argentina
        • Rest of LATAM
      • By Product
      • By Class
      • By Application
    • Market Attractiveness Analysis
      • By Country
      • By Product
      • By Class
      • By Application
    • Key Takeaways
  12. Western Europe Market Analysis 2020 to 2024 and Forecast 2025 to 2035, By Country
    • Historical Market Size Value (USD Billion) & Volume (Units) Trend Analysis By Market Taxonomy, 2020 to 2024
    • Market Size Value (USD Billion) & Volume (Units) Forecast By Market Taxonomy, 2025 to 2035
      • By Country
        • Germany
        • Italy
        • France
        • UK
        • Spain
        • BENELUX
        • Nordic
        • Rest of W.Europe
      • By Product
      • By Class
      • By Application
    • Market Attractiveness Analysis
      • By Country
      • By Product
      • By Class
      • By Application
    • Key Takeaways
  13. Eastern Europe Market Analysis 2020 to 2024 and Forecast 2025 to 2035, By Country
    • Historical Market Size Value (USD Billion) & Volume (Units) Trend Analysis By Market Taxonomy, 2020 to 2024
    • Market Size Value (USD Billion) & Volume (Units) Forecast By Market Taxonomy, 2025 to 2035
      • By Country
        • Russia
        • Hungary
        • Poland
        • Balkan & Baltics
        • Rest of E. Europe
      • By Product
      • By Class
      • By Application
    • Market Attractiveness Analysis
      • By Country
      • By Product
      • By Class
      • By Application
    • Key Takeaways
  14. East Asia Market Analysis 2020 to 2024 and Forecast 2025 to 2035, By Country
    • Historical Market Size Value (USD Billion) & Volume (Units) Trend Analysis By Market Taxonomy, 2020 to 2024
    • Market Size Value (USD Billion) & Volume (Units) Forecast By Market Taxonomy, 2025 to 2035
      • By Country
        • China
        • Japan
        • South Korea
      • By Product
      • By Class
      • By Application
    • Market Attractiveness Analysis
      • By Country
      • By Product
      • By Class
      • By Application
    • Key Takeaways
  15. South Asia & Pacific Market Analysis 2020 to 2024 and Forecast 2025 to 2035, By Country
    • Historical Market Size Value (USD Billion) & Volume (Units) Trend Analysis By Market Taxonomy, 2020 to 2024
    • Market Size Value (USD Billion) & Volume (Units) Forecast By Market Taxonomy, 2025 to 2035
      • By Country
        • India
        • Australia & New Zealand
        • ASEAN
        • Rest of SAP
      • By Product
      • By Class
      • By Application
    • Market Attractiveness Analysis
      • By Country
      • By Product
      • By Class
      • By Application
    • Key Takeaways
  16. Middle East and Africa Market Analysis 2020 to 2024 and Forecast 2025 to 2035, By Country
    • Historical Market Size Value (USD Billion) & Volume (Units) Trend Analysis By Market Taxonomy, 2020 to 2024
    • Market Size Value (USD Billion) & Volume (Units) Forecast By Market Taxonomy, 2025 to 2035
      • By Country
        • GCC Countries
        • Northern Africa
        • South Africa
        • Turkiye
        • Rest of MEA
      • By Product
      • By Class
      • By Application
    • Market Attractiveness Analysis
      • By Country
      • By Product
      • By Class
      • By Application
    • Key Takeaways
  17. Key Countries Market Analysis
    • USA
      • Pricing Analysis
      • Market Share Analysis, 2024
        • By Product
        • By Class
        • By Application
    • Canada
      • Pricing Analysis
      • Market Share Analysis, 2024
        • By Product
        • By Class
        • By Application
    • Brazil
      • Pricing Analysis
      • Market Share Analysis, 2024
        • By Product
        • By Class
        • By Application
    • Mexico
      • Pricing Analysis
      • Market Share Analysis, 2024
        • By Product
        • By Class
        • By Application
    • Argentina
      • Pricing Analysis
      • Market Share Analysis, 2024
        • By Product
        • By Class
        • By Application
  18. Market Structure Analysis
    • Competition Dashboard
    • Competition Benchmarking
    • Market Share Analysis of Top Players
      • By Regional
      • By Product
      • By Class
      • By Application
  19. Competition Analysis
    • Competition Deep Dive
      • Doosan Industrial Vehicle America Corp.
        • Overview
        • Product Portfolio
        • Profitability by Market Segments (Product/Age /Sales Channel/Region)
        • Sales Footprint
        • Strategy Overview
          • Marketing Strategy
          • Product Strategy
          • Channel Strategy
      • Crown Equipment Corporation
        • Overview
        • Product Portfolio
        • Profitability by Market Segments (Product/Age /Sales Channel/Region)
        • Sales Footprint
        • Strategy Overview
          • Marketing Strategy
          • Product Strategy
          • Channel Strategy
      • Anhui HELI Co., Ltd.
        • Overview
        • Product Portfolio
        • Profitability by Market Segments (Product/Age /Sales Channel/Region)
        • Sales Footprint
        • Strategy Overview
          • Marketing Strategy
          • Product Strategy
          • Channel Strategy
      • Mitsubishi Logisnext Co., Ltd.
        • Overview
        • Product Portfolio
        • Profitability by Market Segments (Product/Age /Sales Channel/Region)
        • Sales Footprint
        • Strategy Overview
          • Marketing Strategy
          • Product Strategy
          • Channel Strategy
      • Clark Material Handling Company
        • Overview
        • Product Portfolio
        • Profitability by Market Segments (Product/Age /Sales Channel/Region)
        • Sales Footprint
        • Strategy Overview
          • Marketing Strategy
          • Product Strategy
          • Channel Strategy
      • Konecranes
        • Overview
        • Product Portfolio
        • Profitability by Market Segments (Product/Age /Sales Channel/Region)
        • Sales Footprint
        • Strategy Overview
          • Marketing Strategy
          • Product Strategy
          • Channel Strategy
      • Combilift Material Handling Solutions
        • Overview
        • Product Portfolio
        • Profitability by Market Segments (Product/Age /Sales Channel/Region)
        • Sales Footprint
        • Strategy Overview
          • Marketing Strategy
          • Product Strategy
          • Channel Strategy
      • Godrej and Boyce Group
        • Overview
        • Product Portfolio
        • Profitability by Market Segments (Product/Age /Sales Channel/Region)
        • Sales Footprint
        • Strategy Overview
          • Marketing Strategy
          • Product Strategy
          • Channel Strategy
      • Hangcha Group Co., Ltd.
        • Overview
        • Product Portfolio
        • Profitability by Market Segments (Product/Age /Sales Channel/Region)
        • Sales Footprint
        • Strategy Overview
          • Marketing Strategy
          • Product Strategy
          • Channel Strategy
      • Hubtex Maschinenbau GmbH & Co. KG
        • Overview
        • Product Portfolio
        • Profitability by Market Segments (Product/Age /Sales Channel/Region)
        • Sales Footprint
        • Strategy Overview
          • Marketing Strategy
          • Product Strategy
          • Channel Strategy
      • KION GROUP AG
        • Overview
        • Product Portfolio
        • Profitability by Market Segments (Product/Age /Sales Channel/Region)
        • Sales Footprint
        • Strategy Overview
          • Marketing Strategy
          • Product Strategy
          • Channel Strategy
      • Komatsu Ltd.
        • Overview
        • Product Portfolio
        • Profitability by Market Segments (Product/Age /Sales Channel/Region)
        • Sales Footprint
        • Strategy Overview
          • Marketing Strategy
          • Product Strategy
          • Channel Strategy
      • Lonking Holdings Limited
        • Overview
        • Product Portfolio
        • Profitability by Market Segments (Product/Age /Sales Channel/Region)
        • Sales Footprint
        • Strategy Overview
          • Marketing Strategy
          • Product Strategy
          • Channel Strategy
      • Hyster-Yale Materials Handling, Inc.
        • Overview
        • Product Portfolio
        • Profitability by Market Segments (Product/Age /Sales Channel/Region)
        • Sales Footprint
        • Strategy Overview
          • Marketing Strategy
          • Product Strategy
          • Channel Strategy
      • Manitou Group
        • Overview
        • Product Portfolio
        • Profitability by Market Segments (Product/Age /Sales Channel/Region)
        • Sales Footprint
        • Strategy Overview
          • Marketing Strategy
          • Product Strategy
          • Channel Strategy
      • Paletrans Forklifts
        • Overview
        • Product Portfolio
        • Profitability by Market Segments (Product/Age /Sales Channel/Region)
        • Sales Footprint
        • Strategy Overview
          • Marketing Strategy
          • Product Strategy
          • Channel Strategy
      • Toyota Industries Corporation
        • Overview
        • Product Portfolio
        • Profitability by Market Segments (Product/Age /Sales Channel/Region)
        • Sales Footprint
        • Strategy Overview
          • Marketing Strategy
          • Product Strategy
          • Channel Strategy
  20. Assumptions & Acronyms Used
  21. Research Methodology
    • Executive Summary
      • Global Market Outlook
      • Demand-side Trends
      • Supply-side Trends
      • Technology Roadmap Analysis
      • Analysis and Recommendations
    • Market Overview
      • Market Coverage / Taxonomy
      • Market Definition / Scope / Limitations
    • Market Background
      • Market Dynamics
        • Drivers
        • Restraints
        • Opportunity
        • Trends
      • Scenario Forecast
        • Demand in Optimistic Scenario
        • Demand in Likely Scenario
        • Demand in Conservative Scenario
      • Opportunity Map Analysis
      • Product Life Cycle Analysis
      • Supply Chain Analysis
        • Supply Side Participants and their Roles
          • Producers
          • Mid-Level Participants (Traders/ Agents/ Brokers)
          • Wholesalers and Distributors
        • Value Added and Value Created at Node in the Supply Chain
        • List of Raw Material Suppliers
        • List of Existing and Potential Buyer’s
      • Investment Feasibility Matrix
      • Value Chain Analysis
        • Profit Margin Analysis
        • Wholesalers and Distributors
        • Retailers
      • PESTLE and Porter’s Analysis
      • Regulatory Landscape
        • By Key Regions
        • By Key Countries
      • Regional Parent Market Outlook
      • Production and Consumption Statistics
      • Import and Export Statistics
    • Global Market Analysis 2020 to 2024 and Forecast, 2025 to 2035
      • Historical Market Size Value (USD Billion) & Volume (Units) Analysis, 2020 to 2024
      • Current and Future Market Size Value (USD Billion) & Volume (Units) Projections, 2025 to 2035
        • Y-o-Y Growth Trend Analysis
        • Absolute $ Opportunity Analysis
    • Global Market Pricing Analysis 2020 to 2024 and Forecast 2025 to 2035
    • Global Market Analysis 2020 to 2024 and Forecast 2025 to 2035, By Product
      • Introduction / Key Findings
      • Historical Market Size Value (USD Billion) & Volume (Units) Analysis By Product, 2020 to 2024
      • Current and Future Market Size Value (USD Billion) & Volume (Units) Analysis and Forecast By Product, 2025 to 2035
        • Counterbalanced
        • Reach Trucks
        • Pallet Trucks
        • Pallet Stackers
        • Others
      • Y-o-Y Growth Trend Analysis By Product, 2020 to 2024
      • Absolute $ Opportunity Analysis By Product, 2025 to 2035
    • Global Market Analysis 2020 to 2024 and Forecast 2025 to 2035, By Class
      • Introduction / Key Findings
      • Historical Market Size Value (USD Billion) & Volume (Units) Analysis By Class, 2020 to 2024
      • Current and Future Market Size Value (USD Billion) & Volume (Units) Analysis and Forecast By Class, 2025 to 2035
        • Class II
        • Class I
        • Class III
        • Others
      • Y-o-Y Growth Trend Analysis By Class, 2020 to 2024
      • Absolute $ Opportunity Analysis By Class, 2025 to 2035
    • Global Market Analysis 2020 to 2024 and Forecast 2025 to 2035, By Application
      • Introduction / Key Findings
      • Historical Market Size Value (USD Billion) & Volume (Units) Analysis By Application, 2020 to 2024
      • Current and Future Market Size Value (USD Billion) & Volume (Units) Analysis and Forecast By Application, 2025 to 2035
        • Logistics
        • Industrial
        • Food & Beverage
        • Retail & E-commerce
        • Chemical
        • Others
      • Y-o-Y Growth Trend Analysis By Application, 2020 to 2024
      • Absolute $ Opportunity Analysis By Application, 2025 to 2035
    • Global Market Analysis 2020 to 2024 and Forecast 2025 to 2035, By Region
      • Introduction
      • Historical Market Size Value (USD Billion) & Volume (Units) Analysis By Region, 2020 to 2024
      • Current Market Size Value (USD Billion) & Volume (Units) Analysis and Forecast By Region, 2025 to 2035
        • North America
        • Latin America
        • Western Europe
        • Eastern Europe
        • East Asia
        • South Asia & Pacific
        • Middle East and Africa
      • Market Attractiveness Analysis By Region
    • North America Market Analysis 2020 to 2024 and Forecast 2025 to 2035, By Country
      • Historical Market Size Value (USD Billion) & Volume (Units) Trend Analysis By Market Taxonomy, 2020 to 2024
      • Market Size Value (USD Billion) & Volume (Units) Forecast By Market Taxonomy, 2025 to 2035
        • By Country
          • USA
          • Canada
          • Mexico
        • By Product
        • By Class
        • By Application
      • Market Attractiveness Analysis
        • By Country
        • By Product
        • By Class
        • By Application
      • Key Takeaways
    • Latin America Market Analysis 2020 to 2024 and Forecast 2025 to 2035, By Country
      • Historical Market Size Value (USD Billion) & Volume (Units) Trend Analysis By Market Taxonomy, 2020 to 2024
      • Market Size Value (USD Billion) & Volume (Units) Forecast By Market Taxonomy, 2025 to 2035
        • By Country
          • Brazil
          • Argentina
          • Rest of LATAM
        • By Product
        • By Class
        • By Application
      • Market Attractiveness Analysis
        • By Country
        • By Product
        • By Class
        • By Application
      • Key Takeaways
    • Western Europe Market Analysis 2020 to 2024 and Forecast 2025 to 2035, By Country
      • Historical Market Size Value (USD Billion) & Volume (Units) Trend Analysis By Market Taxonomy, 2020 to 2024
      • Market Size Value (USD Billion) & Volume (Units) Forecast By Market Taxonomy, 2025 to 2035
        • By Country
          • Germany
          • Italy
          • France
          • UK
          • Spain
          • BENELUX
          • Nordic
          • Rest of W.Europe
        • By Product
        • By Class
        • By Application
      • Market Attractiveness Analysis
        • By Country
        • By Product
        • By Class
        • By Application
      • Key Takeaways
    • Eastern Europe Market Analysis 2020 to 2024 and Forecast 2025 to 2035, By Country
      • Historical Market Size Value (USD Billion) & Volume (Units) Trend Analysis By Market Taxonomy, 2020 to 2024
      • Market Size Value (USD Billion) & Volume (Units) Forecast By Market Taxonomy, 2025 to 2035
        • By Country
          • Russia
          • Hungary
          • Poland
          • Balkan & Baltics
          • Rest of E. Europe
        • By Product
        • By Class
        • By Application
      • Market Attractiveness Analysis
        • By Country
        • By Product
        • By Class
        • By Application
      • Key Takeaways
    • East Asia Market Analysis 2020 to 2024 and Forecast 2025 to 2035, By Country
      • Historical Market Size Value (USD Billion) & Volume (Units) Trend Analysis By Market Taxonomy, 2020 to 2024
      • Market Size Value (USD Billion) & Volume (Units) Forecast By Market Taxonomy, 2025 to 2035
        • By Country
          • China
          • Japan
          • South Korea
        • By Product
        • By Class
        • By Application
      • Market Attractiveness Analysis
        • By Country
        • By Product
        • By Class
        • By Application
      • Key Takeaways
    • South Asia & Pacific Market Analysis 2020 to 2024 and Forecast 2025 to 2035, By Country
      • Historical Market Size Value (USD Billion) & Volume (Units) Trend Analysis By Market Taxonomy, 2020 to 2024
      • Market Size Value (USD Billion) & Volume (Units) Forecast By Market Taxonomy, 2025 to 2035
        • By Country
          • India
          • Australia & New Zealand
          • ASEAN
          • Rest of SAP
        • By Product
        • By Class
        • By Application
      • Market Attractiveness Analysis
        • By Country
        • By Product
        • By Class
        • By Application
      • Key Takeaways
    • Middle East and Africa Market Analysis 2020 to 2024 and Forecast 2025 to 2035, By Country
      • Historical Market Size Value (USD Billion) & Volume (Units) Trend Analysis By Market Taxonomy, 2020 to 2024
      • Market Size Value (USD Billion) & Volume (Units) Forecast By Market Taxonomy, 2025 to 2035
        • By Country
          • GCC Countries
          • Northern Africa
          • South Africa
          • Turkiye
          • Rest of MEA
        • By Product
        • By Class
        • By Application
      • Market Attractiveness Analysis
        • By Country
        • By Product
        • By Class
        • By Application
      • Key Takeaways
    • Key Countries Market Analysis
      • USA
        • Pricing Analysis
        • Market Share Analysis, 2024
          • By Product
          • By Class
          • By Application
      • Canada
        • Pricing Analysis
        • Market Share Analysis, 2024
          • By Product
          • By Class
          • By Application
      • Brazil
        • Pricing Analysis
        • Market Share Analysis, 2024
          • By Product
          • By Class
          • By Application
      • Mexico
        • Pricing Analysis
        • Market Share Analysis, 2024
          • By Product
          • By Class
          • By Application
      • Argentina
        • Pricing Analysis
        • Market Share Analysis, 2024
          • By Product
          • By Class
          • By Application
    • Market Structure Analysis
      • Competition Dashboard
      • Competition Benchmarking
      • Market Share Analysis of Top Players
        • By Regional
        • By Product
        • By Class
        • By Application
    • Competition Analysis
      • Competition Deep Dive
        • Doosan Industrial Vehicle America Corp.
          • Overview
          • Product Portfolio
          • Profitability by Market Segments (Product/Age /Sales Channel/Region)
          • Sales Footprint
          • Strategy Overview
            • Marketing Strategy
            • Product Strategy
            • Channel Strategy
        • Crown Equipment Corporation
          • Overview
          • Product Portfolio
          • Profitability by Market Segments (Product/Age /Sales Channel/Region)
          • Sales Footprint
          • Strategy Overview
            • Marketing Strategy
            • Product Strategy
            • Channel Strategy
        • Anhui HELI Co., Ltd.
          • Overview
          • Product Portfolio
          • Profitability by Market Segments (Product/Age /Sales Channel/Region)
          • Sales Footprint
          • Strategy Overview
            • Marketing Strategy
            • Product Strategy
            • Channel Strategy
        • Mitsubishi Logisnext Co., Ltd.
          • Overview
          • Product Portfolio
          • Profitability by Market Segments (Product/Age /Sales Channel/Region)
          • Sales Footprint
          • Strategy Overview
            • Marketing Strategy
            • Product Strategy
            • Channel Strategy
        • Clark Material Handling Company
          • Overview
          • Product Portfolio
          • Profitability by Market Segments (Product/Age /Sales Channel/Region)
          • Sales Footprint
          • Strategy Overview
            • Marketing Strategy
            • Product Strategy
            • Channel Strategy
        • Konecranes
          • Overview
          • Product Portfolio
          • Profitability by Market Segments (Product/Age /Sales Channel/Region)
          • Sales Footprint
          • Strategy Overview
            • Marketing Strategy
            • Product Strategy
            • Channel Strategy
        • Combilift Material Handling Solutions
          • Overview
          • Product Portfolio
          • Profitability by Market Segments (Product/Age /Sales Channel/Region)
          • Sales Footprint
          • Strategy Overview
            • Marketing Strategy
            • Product Strategy
            • Channel Strategy
        • Godrej and Boyce Group
          • Overview
          • Product Portfolio
          • Profitability by Market Segments (Product/Age /Sales Channel/Region)
          • Sales Footprint
          • Strategy Overview
            • Marketing Strategy
            • Product Strategy
            • Channel Strategy
        • Hangcha Group Co., Ltd.
          • Overview
          • Product Portfolio
          • Profitability by Market Segments (Product/Age /Sales Channel/Region)
          • Sales Footprint
          • Strategy Overview
            • Marketing Strategy
            • Product Strategy
            • Channel Strategy
        • Hubtex Maschinenbau GmbH & Co. KG
          • Overview
          • Product Portfolio
          • Profitability by Market Segments (Product/Age /Sales Channel/Region)
          • Sales Footprint
          • Strategy Overview
            • Marketing Strategy
            • Product Strategy
            • Channel Strategy
        • KION GROUP AG
          • Overview
          • Product Portfolio
          • Profitability by Market Segments (Product/Age /Sales Channel/Region)
          • Sales Footprint
          • Strategy Overview
            • Marketing Strategy
            • Product Strategy
            • Channel Strategy
        • Komatsu Ltd.
          • Overview
          • Product Portfolio
          • Profitability by Market Segments (Product/Age /Sales Channel/Region)
          • Sales Footprint
          • Strategy Overview
            • Marketing Strategy
            • Product Strategy
            • Channel Strategy
        • Lonking Holdings Limited
          • Overview
          • Product Portfolio
          • Profitability by Market Segments (Product/Age /Sales Channel/Region)
          • Sales Footprint
          • Strategy Overview
            • Marketing Strategy
            • Product Strategy
            • Channel Strategy
        • Hyster-Yale Materials Handling, Inc.
          • Overview
          • Product Portfolio
          • Profitability by Market Segments (Product/Age /Sales Channel/Region)
          • Sales Footprint
          • Strategy Overview
            • Marketing Strategy
            • Product Strategy
            • Channel Strategy
        • Manitou Group
          • Overview
          • Product Portfolio
          • Profitability by Market Segments (Product/Age /Sales Channel/Region)
          • Sales Footprint
          • Strategy Overview
            • Marketing Strategy
            • Product Strategy
            • Channel Strategy
        • Paletrans Forklifts
          • Overview
          • Product Portfolio
          • Profitability by Market Segments (Product/Age /Sales Channel/Region)
          • Sales Footprint
          • Strategy Overview
            • Marketing Strategy
            • Product Strategy
            • Channel Strategy
        • Toyota Industries Corporation
          • Overview
          • Product Portfolio
          • Profitability by Market Segments (Product/Age /Sales Channel/Region)
          • Sales Footprint
          • Strategy Overview
            • Marketing Strategy
            • Product Strategy
            • Channel Strategy
    • Assumptions & Acronyms Used
    • Research Methodology

List of Tables

  • Table 1: Global Market Value (USD Billion) Forecast by Region, 2020-2035
  • Table 2: Global Market Volume (Units) Forecast by Region, 2020-2035
  • Table 3: Global Market Value (USD Billion) Forecast by Product, 2020-2035
  • Table 4: Global Market Volume (Units) Forecast by Product, 2020-2035
  • Table 5: Global Market Value (USD Billion) Forecast by Class, 2020-2035
  • Table 6: Global Market Volume (Units) Forecast by Class, 2020-2035
  • Table 7: Global Market Value (USD Billion) Forecast by Application, 2020-2035
  • Table 8: Global Market Volume (Units) Forecast by Application, 2020-2035
  • Table 9: North America Market Value (USD Billion) Forecast by Country, 2020-2035
  • Table 10: North America Market Volume (Units) Forecast by Country, 2020-2035
  • Table 11: North America Market Value (USD Billion) Forecast by Product, 2020-2035
  • Table 12: North America Market Volume (Units) Forecast by Product, 2020-2035
  • Table 13: North America Market Value (USD Billion) Forecast by Class, 2020-2035
  • Table 14: North America Market Volume (Units) Forecast by Class, 2020-2035
  • Table 15: North America Market Value (USD Billion) Forecast by Application, 2020-2035
  • Table 16: North America Market Volume (Units) Forecast by Application, 2020-2035
  • Table 17: Latin America Market Value (USD Billion) Forecast by Country, 2020-2035
  • Table 18: Latin America Market Volume (Units) Forecast by Country, 2020-2035
  • Table 19: Latin America Market Value (USD Billion) Forecast by Product, 2020-2035
  • Table 20: Latin America Market Volume (Units) Forecast by Product, 2020-2035
  • Table 21: Latin America Market Value (USD Billion) Forecast by Class, 2020-2035
  • Table 22: Latin America Market Volume (Units) Forecast by Class, 2020-2035
  • Table 23: Latin America Market Value (USD Billion) Forecast by Application, 2020-2035
  • Table 24: Latin America Market Volume (Units) Forecast by Application, 2020-2035
  • Table 25: Western Europe Market Value (USD Billion) Forecast by Country, 2020-2035
  • Table 26: Western Europe Market Volume (Units) Forecast by Country, 2020-2035
  • Table 27: Western Europe Market Value (USD Billion) Forecast by Product, 2020-2035
  • Table 28: Western Europe Market Volume (Units) Forecast by Product, 2020-2035
  • Table 29: Western Europe Market Value (USD Billion) Forecast by Class, 2020-2035
  • Table 30: Western Europe Market Volume (Units) Forecast by Class, 2020-2035
  • Table 31: Western Europe Market Value (USD Billion) Forecast by Application, 2020-2035
  • Table 32: Western Europe Market Volume (Units) Forecast by Application, 2020-2035
  • Table 33: Eastern Europe Market Value (USD Billion) Forecast by Country, 2020-2035
  • Table 34: Eastern Europe Market Volume (Units) Forecast by Country, 2020-2035
  • Table 35: Eastern Europe Market Value (USD Billion) Forecast by Product, 2020-2035
  • Table 36: Eastern Europe Market Volume (Units) Forecast by Product, 2020-2035
  • Table 37: Eastern Europe Market Value (USD Billion) Forecast by Class, 2020-2035
  • Table 38: Eastern Europe Market Volume (Units) Forecast by Class, 2020-2035
  • Table 39: Eastern Europe Market Value (USD Billion) Forecast by Application, 2020-2035
  • Table 40: Eastern Europe Market Volume (Units) Forecast by Application, 2020-2035
  • Table 41: East Asia Market Value (USD Billion) Forecast by Country, 2020-2035
  • Table 42: East Asia Market Volume (Units) Forecast by Country, 2020-2035
  • Table 43: East Asia Market Value (USD Billion) Forecast by Product, 2020-2035
  • Table 44: East Asia Market Volume (Units) Forecast by Product, 2020-2035
  • Table 45: East Asia Market Value (USD Billion) Forecast by Class, 2020-2035
  • Table 46: East Asia Market Volume (Units) Forecast by Class, 2020-2035
  • Table 47: East Asia Market Value (USD Billion) Forecast by Application, 2020-2035
  • Table 48: East Asia Market Volume (Units) Forecast by Application, 2020-2035
  • Table 49: South Asia & Pacific Market Value (USD Billion) Forecast by Country, 2020-2035
  • Table 50: South Asia & Pacific Market Volume (Units) Forecast by Country, 2020-2035
  • Table 51: South Asia & Pacific Market Value (USD Billion) Forecast by Product, 2020-2035
  • Table 52: South Asia & Pacific Market Volume (Units) Forecast by Product, 2020-2035
  • Table 53: South Asia & Pacific Market Value (USD Billion) Forecast by Class, 2020-2035
  • Table 54: South Asia & Pacific Market Volume (Units) Forecast by Class, 2020-2035
  • Table 55: South Asia & Pacific Market Value (USD Billion) Forecast by Application, 2020-2035
  • Table 56: South Asia & Pacific Market Volume (Units) Forecast by Application, 2020-2035
  • Table 57: Middle East and Africa Market Value (USD Billion) Forecast by Country, 2020-2035
  • Table 58: Middle East and Africa Market Volume (Units) Forecast by Country, 2020-2035
  • Table 59: Middle East and Africa Market Value (USD Billion) Forecast by Product, 2020-2035
  • Table 60: Middle East and Africa Market Volume (Units) Forecast by Product, 2020-2035
  • Table 61: Middle East and Africa Market Value (USD Billion) Forecast by Class, 2020-2035
  • Table 62: Middle East and Africa Market Volume (Units) Forecast by Class, 2020-2035
  • Table 63: Middle East and Africa Market Value (USD Billion) Forecast by Application, 2020-2035
  • Table 64: Middle East and Africa Market Volume (Units) Forecast by Application, 2020-2035

List of Figures

  • Figure 1: Global Market Volume (Units) Forecast 2020-2035
  • Figure 2: Global Market Pricing Analysis
  • Figure 3: Global Market Value (USD Billion) Forecast 2020-2035
  • Figure 4: Global Market Value Share and BPS Analysis by Product, 2025 and 2035
  • Figure 5: Global Market Y-o-Y Growth Comparison by Product, 2025-2035
  • Figure 6: Global Market Attractiveness Analysis by Product
  • Figure 7: Global Market Value Share and BPS Analysis by Class, 2025 and 2035
  • Figure 8: Global Market Y-o-Y Growth Comparison by Class, 2025-2035
  • Figure 9: Global Market Attractiveness Analysis by Class
  • Figure 10: Global Market Value Share and BPS Analysis by Application, 2025 and 2035
  • Figure 11: Global Market Y-o-Y Growth Comparison by Application, 2025-2035
  • Figure 12: Global Market Attractiveness Analysis by Application
  • Figure 13: Global Market Value (USD Billion) Share and BPS Analysis by Region, 2025 and 2035
  • Figure 14: Global Market Y-o-Y Growth Comparison by Region, 2025-2035
  • Figure 15: Global Market Attractiveness Analysis by Region
  • Figure 16: North America Market Incremental $ Opportunity, 2025-2035
  • Figure 17: Latin America Market Incremental $ Opportunity, 2025-2035
  • Figure 18: Western Europe Market Incremental $ Opportunity, 2025-2035
  • Figure 19: Eastern Europe Market Incremental $ Opportunity, 2025-2035
  • Figure 20: East Asia Market Incremental $ Opportunity, 2025-2035
  • Figure 21: South Asia & Pacific Market Incremental $ Opportunity, 2025-2035
  • Figure 22: Middle East and Africa Market Incremental $ Opportunity, 2025-2035
  • Figure 23: North America Market Value Share and BPS Analysis by Country, 2025 and 2035
  • Figure 24: North America Market Value Share and BPS Analysis by Product, 2025 and 2035
  • Figure 25: North America Market Y-o-Y Growth Comparison by Product, 2025-2035
  • Figure 26: North America Market Attractiveness Analysis by Product
  • Figure 27: North America Market Value Share and BPS Analysis by Class, 2025 and 2035
  • Figure 28: North America Market Y-o-Y Growth Comparison by Class, 2025-2035
  • Figure 29: North America Market Attractiveness Analysis by Class
  • Figure 30: North America Market Value Share and BPS Analysis by Application, 2025 and 2035
  • Figure 31: North America Market Y-o-Y Growth Comparison by Application, 2025-2035
  • Figure 32: North America Market Attractiveness Analysis by Application
  • Figure 33: Latin America Market Value Share and BPS Analysis by Country, 2025 and 2035
  • Figure 34: Latin America Market Value Share and BPS Analysis by Product, 2025 and 2035
  • Figure 35: Latin America Market Y-o-Y Growth Comparison by Product, 2025-2035
  • Figure 36: Latin America Market Attractiveness Analysis by Product
  • Figure 37: Latin America Market Value Share and BPS Analysis by Class, 2025 and 2035
  • Figure 38: Latin America Market Y-o-Y Growth Comparison by Class, 2025-2035
  • Figure 39: Latin America Market Attractiveness Analysis by Class
  • Figure 40: Latin America Market Value Share and BPS Analysis by Application, 2025 and 2035
  • Figure 41: Latin America Market Y-o-Y Growth Comparison by Application, 2025-2035
  • Figure 42: Latin America Market Attractiveness Analysis by Application
  • Figure 43: Western Europe Market Value Share and BPS Analysis by Country, 2025 and 2035
  • Figure 44: Western Europe Market Value Share and BPS Analysis by Product, 2025 and 2035
  • Figure 45: Western Europe Market Y-o-Y Growth Comparison by Product, 2025-2035
  • Figure 46: Western Europe Market Attractiveness Analysis by Product
  • Figure 47: Western Europe Market Value Share and BPS Analysis by Class, 2025 and 2035
  • Figure 48: Western Europe Market Y-o-Y Growth Comparison by Class, 2025-2035
  • Figure 49: Western Europe Market Attractiveness Analysis by Class
  • Figure 50: Western Europe Market Value Share and BPS Analysis by Application, 2025 and 2035
  • Figure 51: Western Europe Market Y-o-Y Growth Comparison by Application, 2025-2035
  • Figure 52: Western Europe Market Attractiveness Analysis by Application
  • Figure 53: Eastern Europe Market Value Share and BPS Analysis by Country, 2025 and 2035
  • Figure 54: Eastern Europe Market Value Share and BPS Analysis by Product, 2025 and 2035
  • Figure 55: Eastern Europe Market Y-o-Y Growth Comparison by Product, 2025-2035
  • Figure 56: Eastern Europe Market Attractiveness Analysis by Product
  • Figure 57: Eastern Europe Market Value Share and BPS Analysis by Class, 2025 and 2035
  • Figure 58: Eastern Europe Market Y-o-Y Growth Comparison by Class, 2025-2035
  • Figure 59: Eastern Europe Market Attractiveness Analysis by Class
  • Figure 60: Eastern Europe Market Value Share and BPS Analysis by Application, 2025 and 2035
  • Figure 61: Eastern Europe Market Y-o-Y Growth Comparison by Application, 2025-2035
  • Figure 62: Eastern Europe Market Attractiveness Analysis by Application
  • Figure 63: East Asia Market Value Share and BPS Analysis by Country, 2025 and 2035
  • Figure 64: East Asia Market Value Share and BPS Analysis by Product, 2025 and 2035
  • Figure 65: East Asia Market Y-o-Y Growth Comparison by Product, 2025-2035
  • Figure 66: East Asia Market Attractiveness Analysis by Product
  • Figure 67: East Asia Market Value Share and BPS Analysis by Class, 2025 and 2035
  • Figure 68: East Asia Market Y-o-Y Growth Comparison by Class, 2025-2035
  • Figure 69: East Asia Market Attractiveness Analysis by Class
  • Figure 70: East Asia Market Value Share and BPS Analysis by Application, 2025 and 2035
  • Figure 71: East Asia Market Y-o-Y Growth Comparison by Application, 2025-2035
  • Figure 72: East Asia Market Attractiveness Analysis by Application
  • Figure 73: South Asia & Pacific Market Value Share and BPS Analysis by Country, 2025 and 2035
  • Figure 74: South Asia & Pacific Market Value Share and BPS Analysis by Product, 2025 and 2035
  • Figure 75: South Asia & Pacific Market Y-o-Y Growth Comparison by Product, 2025-2035
  • Figure 76: South Asia & Pacific Market Attractiveness Analysis by Product
  • Figure 77: South Asia & Pacific Market Value Share and BPS Analysis by Class, 2025 and 2035
  • Figure 78: South Asia & Pacific Market Y-o-Y Growth Comparison by Class, 2025-2035
  • Figure 79: South Asia & Pacific Market Attractiveness Analysis by Class
  • Figure 80: South Asia & Pacific Market Value Share and BPS Analysis by Application, 2025 and 2035
  • Figure 81: South Asia & Pacific Market Y-o-Y Growth Comparison by Application, 2025-2035
  • Figure 82: South Asia & Pacific Market Attractiveness Analysis by Application
  • Figure 83: Middle East and Africa Market Value Share and BPS Analysis by Country, 2025 and 2035
  • Figure 84: Middle East and Africa Market Value Share and BPS Analysis by Product, 2025 and 2035
  • Figure 85: Middle East and Africa Market Y-o-Y Growth Comparison by Product, 2025-2035
  • Figure 86: Middle East and Africa Market Attractiveness Analysis by Product
  • Figure 87: Middle East and Africa Market Value Share and BPS Analysis by Class, 2025 and 2035
  • Figure 88: Middle East and Africa Market Y-o-Y Growth Comparison by Class, 2025-2035
  • Figure 89: Middle East and Africa Market Attractiveness Analysis by Class
  • Figure 90: Middle East and Africa Market Value Share and BPS Analysis by Application, 2025 and 2035
  • Figure 91: Middle East and Africa Market Y-o-Y Growth Comparison by Application, 2025-2035
  • Figure 92: Middle East and Africa Market Attractiveness Analysis by Application
  • Figure 93: Global Market - Tier Structure Analysis
  • Figure 94: Global Market - Company Share Analysis

Frequently Asked Questions

What is the projected market size of the electric lift truck market by 2035?

The market is expected to exceed USD 263 billion by 2035.

What is the forecast CAGR of the electric lift truck market from 2025 to 2035?

The CAGR is projected at 14.6% during this period.

Which product segment holds the largest market share in 2025?

Counterbalanced trucks hold 40% of the market share by product.

How much market share does Toyota Industries Corporation hold among electric lift truck manufacturers?

Toyota Industries Corporation holds approximately 22.5% of the industry share.

What percentage of the electric lift truck market is attributed to logistics applications?

Logistics accounts for 28% of the market share by application.

Explore Similar Insights

Future Market Insights

Electric lift Trucks Market