Deflectable Catheters Market
Deflectable Catheters Market By Product Type (Uni-Directional Deflectable Catheters, Bi-Directional Deflectable Catheters), Application (Deflectable Catheters for Coronary Interventions, Deflectable Catheters for Electrophysiology) & Region | Forecast 2022 to 2029
Market Insights on Deflectable Catheters covering sales outlook, demand forecast and up-to-date key trends
Deflectable Catheters Market Outlook (2022 to 2029)
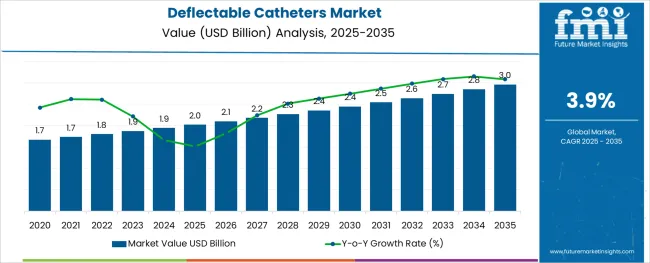
[243 Pages Report] The global deflectable catheters market is projected to expand at a CAGR of 3.9% from 2022 to 2029. Sales of deflectable catheters currently stand at a valuation of US$ 1.8 Billion, and are estimated to reach a market valuation of US$ 2.4 Billion by 2029.
Deflectable Catheters Market Size (2022) |
US$ 1.8 Billion |
Projected Market Value (2029) |
US$ 2.4 Billion |
Estimated Market Growth Rate (2022 to 2029) |
3.9% CAGR |
Market Share of Hospitals (2022) |
54.7% |
Shipments of deflectable catheters account for a 9.8% revenue share of the global catheter market. Rising preference for minimally-invasive procedures and high incidence of cardiovascular diseases across the world are expected to be the main factors driving market expansion.
Don't pay for what you don't need
Customize your report by selecting specific countries or regions and save 30%!
How The Market Progressed Till June 2022?
Particulars |
Details |
H1, 2021 |
3.91% |
H1, 2022 Projected |
3.86% |
H1, 2022 Outlook |
3.26% |
BPS Change - H1, 2022 (O) - H1, 2022 (P) |
(-) 60 ↓ |
BPS Change – H1, 2022 (O) - H1, 2021 |
(-) 65 ↓ |
The comparative analysis and market growth rate of the global deflectable catheters market as studied by Future Market Insights will show a negative BPS growth in the H1-2022 outlook as compared to H1-2022 projected period by 60 BPS, and, a decline in BPS growth is expected in H1-2022 over H1- 2021 duration with 65 Basis Point Share (BPS).
The market is subject to medical device regulations, in accordance with macroeconomic and industrial standards.
The market experienced a decline in the BPS values associated with the inherent device limitations such as its size and limited trackability, and infusion limitations, causing a shift in product preference. Moreover, a large number of reported occurrences of catheter-associated urinary tract infections (CAUTI) have further restrained patient preference towards the product.
However, with the introduction of steerable catheters, the market is likely to observe a positive growth outlook over the forecasted years. The key developments in the market include the introduction of the cobra catheter for complex surgical interventions.
Demand Analysis Of Deflectable Catheters (2014 To 2021) Vs Market Statistics (2022 To 2029)
The world has seen a substantial rise in cardiovascular disorders, and this has spawned major demand for multiple cardiovascular treatments. Consumption of deflectable catheters rose at a CAGR of 3.8% from 2014 to 2021.
The increasing prevalence of peripheral artery diseases, growing geriatric population, increasing preference for minimally invasive surgeries, rapid advancements in catheters, and rising number of cardiovascular surgeries are major factors that guide the sales of deflectable catheter systems.
With cardiovascular diseases becoming one of the prime causes of death across the world, demand for better and more effective treatments has also bolstered amidst this. Government initiatives are focusing on increasing awareness of these cardiovascular disorders and investments to further advance research and development of novel treatment products.
Complications associated with the use of catheters, risk of myocardial infections, and allergic reactions are expected to hinder deflectable catheter sales to a certain extent over the forecast period. However, these drawbacks are being addressed by research and the development of better catheters free from the aforementioned risks.
The deflectable catheters industry is projected to progress steadily at a CAGR of 3.9% from 2022 to 2029.
Which Market Factors Can Positively Influence Demand For Deflectable Catheters?
“Increasing Prevalence of Cardiovascular Disorders to Boost Sales of Deflectable Catheters”
The world has seen a substantial increase in the incidence of cardiovascular diseases over the past few years which has subsequently influenced the consumption of deflectable catheters. Increasing research and development activity for cardiovascular diseases is propelling demand for innovative products to cover most applications.
“Increasing Availability of Microcatheters”
Microcatheters have seen a substantial rise in popularity recently and are expected to see rapid development over the forecast period as well. The increasing use of microcatheters is majorly influenced by their key characteristics such as 3D navigation and mirrored workability.
With this widening scope of application, investments in the research & development of microcatheters are expected to see a prominent rise through 2029.
As these advanced microcatheters are developed, their scope of use for deflectable catheters is also expected to increase and subsequently drive market potential.
How Will The Global Deflectable Catheters Market Fare Across Regions?
“China & India to Emerge as Highly Rewarding Markets in the Asian Region”
Deflectable catheter demand analysis for regions such as North America, Latin America, Europe, East Asia, South Asia & Pacific, and the Middle East & Africa (MEA) has been discussed in this FMI study.
The North American deflectable catheters market is expected to account for the largest market share and is projected to maintain this stance through 2029. The presence of key deflectable catheter manufacturers and well-established healthcare infrastructure are expected to be prime drivers for deflectable catheter shipments in this region.
The Europe deflectable catheter products market is expected to exhibit steady growth in demand over the forecast period. Rising focus on healthcare, increasing medical research and development activities, and a rising geriatric population is anticipated to be major trends in this region.
Deflectable catheter consumption in the regions of South Asia and East Asia is anticipated to see a substantial increase over the forecast period. The increase in demand for deflectable catheters can be attributed to factors such as developing healthcare infrastructure, increasing prevalence of cardiovascular disorders, and increasing healthcare spending potential. China and India are expected to emerge as prime markets in these regions.
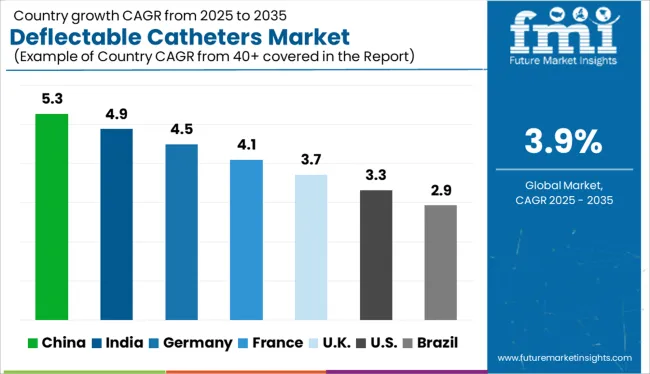
Country-Wise Analysis
What is the Demand Outlook for Deflectable Catheters in India?
“Rapidly Developing Healthcare Infrastructure to Provide Lucrative Opportunities for Deflectable Catheter Providers”
India has seen a rise in instances of cardiovascular disorders over the past few years, and this is expected to continue through 2029. Increasing sedentary lifestyles, poor eating habits, rising geriatric population, increasing healthcare spending, and rising popularity of minimally invasive cardiovascular procedures are projected to guide deflectable catheter consumption over the forecast period.
Deflectable catheter manufacturers can focus on India to discover untapped potential in this nation and increase their overall sales revenue.
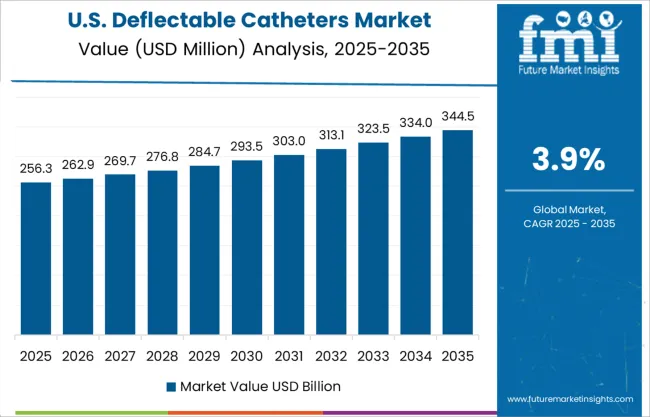
How are Deflectable Catheter Sales Expected to Perform in the USA?
“Increasing Incidence of Cardiovascular Ailments to Propel Deflectable Catheter Consumption”
The USA has been battling some major health issues over the past few years that have been massively influencing public health trends in the nation. The nation has seen a substantial increase in the prevalence of obesity which has led to a significant increase in cardiovascular disorders.
Increasing healthcare spending, rising availability of treatment options, and increasing preference for minimally invasive surgeries are some major factors that govern demand for deflectable catheters in the USA
Get the data you need at a Fraction of the cost
Personalize your report by choosing insights you need
and save 40%!
Category-Wise Analysis
Which End User Majorly Drives Shipments of Deflectable Catheters?
“Hospitals Account for Majority of Deflectable Catheter Sales; Demand from Catheterization Labs to Soar Going Forward”
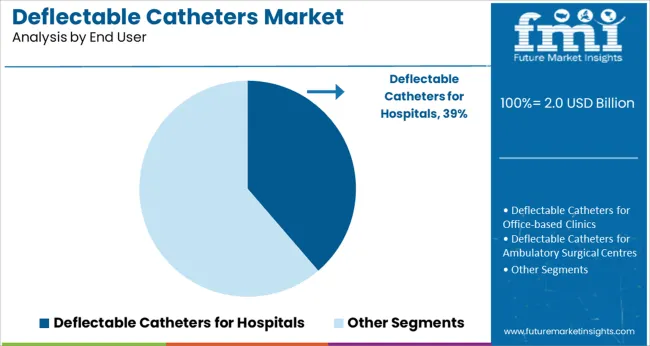
Currently, hospitals account for 54.7% of the global deflectable catheter demand and are anticipated to maintain a dominant stance throughout the forecast period, since most cardiovascular treatment procedures require a hospital setting and the presence of medical professionals. However, sales of deflectable catheters are expected to see a rapid increase as demand from independent catheterization labs increases.
In 2022, independent catheterization labs account for 30.7% of the global deflectable catheter market landscape. The number of independent catheterization labs is increasing and is expected to be a prominent trend through 2029.
Office-based clinics and ambulatory surgical centers hold market shares of 2.2% and 12.5%, respectively, in the global deflectable catheters industry.
COVID-19 Impact Survey
The COVID-19 pandemic of 2020 largely influenced healthcare infrastructure on a global scale and reshaped the way we approach public healthcare. As coronavirus infections plagued the world, lockdowns were imposed by multiple nations, and all healthcare institutions were focused on dealing with the widespread pandemic.
Amidst these unpredictable times, focus on other diseases was minimal and this negatively impacted the deflectable catheters market. Sales of deflectable catheters saw a major drop as cardiovascular surgeries were not being performed in the wake of coronavirus infections.
However, deflectable catheter shipments are expected to rise at a slow pace in the post-pandemic era and bring the market into recovery mode with many deflectable catheter manufacturers focusing on expanding their revenue potential to cope with previous losses.
Competitive Landscape
Deflectable catheter providers are investing in enhancing the deflectable functionality of catheters and stents to optimize cardiovascular procedures.
- In February 2022, Zeus, a leading name in polymer solutions, announced the addition of new tubing to its existing product portfolio. The new PTFE Sub-Lite-Wall® multi-lumen tubing will make the process of catheter manufacturing a lot less challenging and is expected to save one-fifth of time as compared to the traditional manufacturing process.
Deflectable Catheters Industry Report Scope
Attribute |
Details |
Forecast Period |
2022 to 2029 |
Historical Data Available for |
2014 to 2021 |
Market Analysis |
Units for Volume, US$ Million for Value |
Key Regions Covered |
|
Key Countries Covered |
|
Key Market Segments Covered |
|
Key Companies Profiled |
|
Key Segments Of Deflectable Catheters Industry Survey
Deflectable Catheters Market by Product Type:
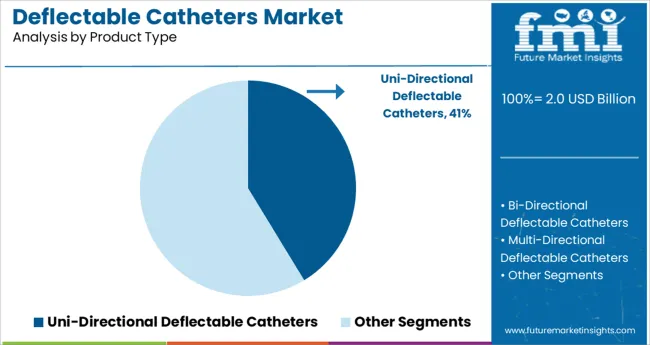
- Uni-Directional Deflectable Catheters
- Bi-Directional Deflectable Catheters
- Multi-Directional Deflectable Catheters
Deflectable Catheters Market by Application:
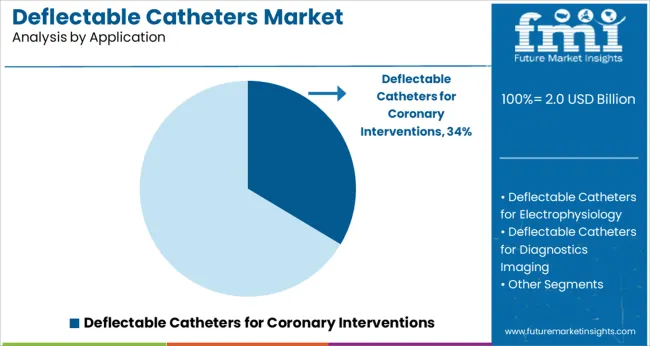
- Deflectable Catheters for Coronary Interventions
- Deflectable Catheters for Electrophysiology
- Deflectable Catheters for Diagnostics Imaging
- Deflectable Catheters for Peripheral Interventions
Deflectable Catheters Market by End User:
- Deflectable Catheters for Hospitals
- Deflectable Catheters for Office-based Clinics
- Deflectable Catheters for Ambulatory Surgical Centres
- Deflectable Catheters for Independent Catheterization Labs
Deflectable Catheters Market by Region:
- North America Deflectable Catheters Market
- Latin America Deflectable Catheters Market
- Europe Deflectable Catheters Market
- East Asia Deflectable Catheters Market
- South Asia & Pacific Deflectable Catheters Market
- Middle East & Africa (MEA) Deflectable Catheters Market
Frequently Asked Questions
What is the current deflectable catheters market worth?
The global deflectable catheters market is valued at US$ 1.8 Billion in 2022.
In terms of CAGR, how is the deflectable catheters market predicted to progress?
Shipments of deflectable catheters are projected to increase at a CAGR of 3.9% from 2022 to 2029.
What is the sales forecast for 2029?
By 2029, deflectable catheter sales are anticipated to rake in a net worth of US$ 2.4 Billion.
Who are the key deflectable catheters manufacturers?
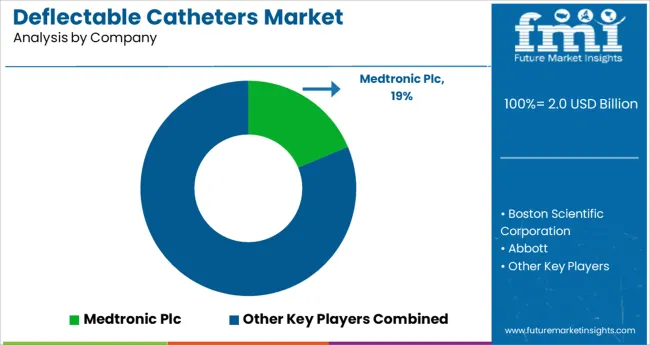
Biosense Webster Inc., Teleflex Incorporated, Boston Scientific Corporation, Biomerics LLC, OSYPKA AG, Abbot, Japan Lifeline Co., CathRx Ltd., and Biotronik SE & Co. KG are key market players that have been profiled in this research.
Which end user holds a dominant outlook?
In 2022, the hospital segment held a mammoth share of 54.7% in the global deflectable catheter industry.
Table of Content
1. Executive Summary | Deflectable Catheters Market 2. Market Overview 2.1. Market Coverage / Taxonomy 2.2. Market Definition / Scope / Limitations 3. Key Market Trends 4. Key Success Factors 5. Global Market - Pricing Analysis 5.1. Regional Pricing Analysis By Product Type 5.2. Pricing Break-up 6. Global Market Demand (in Volume) Analysis 2014 to 2021 and Forecast, 2022 to 2029 6.1. Historical Market Volume (Units) Analysis, 2014 to 2021 6.2. Current and Future Market Volume (Units) Projections, 2022 to 2029 6.2.1. Y-o-Y Growth Trend Analysis 7. Global Market Demand (in Value or Size in US$ Million) Analysis 2014 to 2021 and Forecast, 2022 to 2029 7.1. Historical Market Value (US$ Million) Analysis, 2014 to 2021 7.2. Current and Future Market Value (US$ Million) Projections, 2022 to 2029 7.2.1. Y-o-Y Growth Trend Analysis 7.2.2. Absolute $ Opportunity Analysis 8. Market Background 8.1. Macro-Economic Factors 8.1.1. Global GDP Growth Outlook 8.1.2. Global Healthcare Industry Market Outlook 8.2. Forecast Factors - Relevance & Impact 8.2.1. Increasing Prevalence of Cardiovascular Disease 8.2.2. Number of Surgical Procedures 8.2.3. Technology Advancement 8.2.4. Reimbursement 8.3. Market Dynamics 8.3.1. Drivers 8.3.2. Restraints 8.3.3. Opportunity Analysis 9. Global Market Analysis 2014 to 2021 and Forecast 2022 to 2029, by Product Type 9.1. Introduction / Key Findings 9.2. Historical Market Size (US$ Million) & Volume Analysis By Product Type, 2014 to 2021 9.3. Current and Future Market Size (US$ Million) & Volume Analysis and Forecast By Product Type, 2022 to 2029 9.3.1. Uni-Directional 9.3.2. Bi-Directional 9.3.3. Multi-Directional 9.4. Market Attractiveness Analysis By Product Type 10. Global Market Analysis 2014 to 2021 and Forecast 2022 to 2029, by Application 10.1. Introduction / Key Findings 10.2. Historical Market Size (US$ Million) Analysis By Application, 2014 to 2021 10.3. Current and Future Market Size (US$ Million) Analysis and Forecast By Application, 2022 to 2029 10.3.1. Coronary Interventions 10.3.2. Electrophysiology 10.3.3. Diagnostics Imaging 10.3.4. Peripheral Interventions 10.4. Market Attractiveness Analysis By Application 11. Global Market Analysis 2014 to 2021 and Forecast 2022 to 2029, by End User 11.1. Introduction / Key Findings 11.2. Historical Market Size (US$ Million) Analysis By End User, 2014 to 2021 11.3. Current and Future Market Size (US$ Million) Analysis and Forecast By End User, 2022 to 2029 11.3.1. Hospitals 11.3.2. Office-Based Clinics 11.3.3. Ambulatory Surgical Centers 11.3.4. Independent Catheterization Labs 11.4. Market Attractiveness Analysis By End User 12. Global Market Analysis 2014 to 2021 and Forecast 2022 to 2029, by Region 12.1. Introduction 12.2. Historical Market Size (US$ Million) Analysis By Region, 2014 to 2021 12.3. Current Market Size (US$ Million) Analysis and Forecast By Region, 2022 to 2029 12.3.1. North America 12.3.2. Latin America 12.3.3. Europe 12.3.4. Middle East and Africa (MEA) 12.3.5. East Asia 12.3.6. South Asia 12.3.7. Oceania 12.4. Market Attractiveness Analysis By Region 13. North America Market Analysis 2014 to 2021 and Forecast 2022 to 2029 13.1. Introduction 13.2. Pricing Analysis 13.3. Historical Market Size (US$ Million) Trend Analysis By Market Taxonomy, 2014 to 2021 13.4. Market Size (US$ Million) Forecast By Market Taxonomy, 2022 to 2029 13.4.1. By Country 13.4.1.1. The USA 13.4.1.2. Canada 13.4.2. By Product Type 13.4.3. By Application 13.4.4. By End User 13.5. Market Attractiveness Analysis 13.5.1. By Country 13.5.2. By Product Type 13.5.3. By Application 13.5.4. By End User 13.6. Drivers and Restraints - Impact Analysis 14. Latin America Market Analysis 2014 to 2021 and Forecast 2022 to 2029 14.1. Introduction 14.2. Pricing Analysis 14.3. Historical Market Size (US$ Million) Trend Analysis By Market Taxonomy, 2014 to 2021 14.4. Market Size (US$ Million) Forecast By Market Taxonomy, 2022 to 2029 14.4.1. By Country 14.4.1.1. Brazil 14.4.1.2. Mexico 14.4.1.3. Rest of Latin America 14.4.2. By Product Type 14.4.3. By Application 14.4.4. By End User 14.5. Market Attractiveness Analysis 14.5.1. By Country 14.5.2. By Product Type 14.5.3. By Application 14.5.4. By End User 14.6. Drivers and Restraints - Impact Analysis 15. Europe Market Analysis 2014 to 2021 and Forecast 2022 to 2029 15.1. Introduction 15.2. Pricing Analysis 15.3. Historical Market Size (US$ Million) Trend Analysis By Market Taxonomy, 2014 to 2021 15.4. Market Size (US$ Million) Forecast By Market Taxonomy, 2022 to 2029 15.4.1. By Country 15.4.1.1. Germany 15.4.1.2. Italy 15.4.1.3. France 15.4.1.4. The UK 15.4.1.5. Spain 15.4.1.6. BENELUX 15.4.1.7. Russia 15.4.1.8. Rest of Europe 15.4.2. By Product Type 15.4.3. By Application 15.4.4. By End User 15.5. Market Attractiveness Analysis 15.5.1. By Country 15.5.2. By Product Type 15.5.3. By Application 15.5.4. By End User 15.6. Drivers and Restraints - Impact Analysis 16. South Asia Market Analysis 2014 to 2021 and Forecast 2022 to 2029 16.1. Introduction 16.2. Pricing Analysis 16.3. Historical Market Size (US$ Million) Trend Analysis By Market Taxonomy, 2014 to 2021 16.4. Market Size (US$ Million) Forecast By Market Taxonomy, 2022 to 2029 16.4.1. By Country 16.4.1.1. India 16.4.1.2. Thailand 16.4.1.3. Indonesia 16.4.1.4. Malaysia 16.4.1.5. Rest of South Asia 16.4.2. By Product Type 16.4.3. By Application 16.4.4. By End User 16.5. Market Attractiveness Analysis 16.5.1. By Country 16.5.2. By Product Type 16.5.3. By Application 16.5.4. By End User 16.6. Drivers and Restraints - Impact Analysis 17. East Asia Market Analysis 2014 to 2021 and Forecast 2022 to 2029 17.1. Introduction 17.2. Pricing Analysis 17.3. Historical Market Size (US$ Million) Trend Analysis By Market Taxonomy, 2014 to 2021 17.4. Market Size (US$ Million) Forecast By Market Taxonomy, 2022 to 2029 17.4.1. By Country 17.4.1.1. China 17.4.1.2. Japan 17.4.1.3. South Korea 17.4.2. By Product Type 17.4.3. By Application 17.4.4. By End User 17.5. Market Attractiveness Analysis 17.5.1. By Country 17.5.2. By Product Type 17.5.3. By Application 17.5.4. By End User 17.6. Drivers and Restraints - Impact Analysis 18. Oceania Market Analysis 2014 to 2021 and Forecast 2022 to 2029 18.1. Introduction 18.2. Pricing Analysis 18.3. Historical Market Size (US$ Million) Trend Analysis By Market Taxonomy, 2014 to 2021 18.4. Market Size (US$ Million) Forecast By Market Taxonomy, 2022 to 2029 18.4.1. By Country 18.4.1.1. Australia 18.4.1.2. New Zealand 18.4.2. By Product Type 18.4.3. By Application 18.4.4. By End User 18.5. Market Attractiveness Analysis 18.5.1. By Country 18.5.2. By Product Type 18.5.3. By Application 18.5.4. By End User 18.6. Drivers and Restraints - Impact Analysis 19. Middle East and Africa Market Analysis 2014 to 2021 and Forecast 2022 to 2029 19.1. Introduction 19.2. Pricing Analysis 19.3. Historical Market Size (US$ Million) Trend Analysis By Market Taxonomy, 2014 to 2021 19.4. Market Size (US$ Million) Forecast By Market Taxonomy, 2022 to 2029 19.4.1. By Country 19.4.1.1. GCC Countries 19.4.1.2. Turkey 19.4.1.3. Northern Africa 19.4.1.4. South Africa 19.4.1.5. Rest of Middle East and Africa 19.4.2. By Product Type 19.4.3. By Application 19.4.4. By End User 19.5. Market Attractiveness Analysis 19.5.1. By Country 19.5.2. By Product Type 19.5.3. By Application 19.5.4. By End User 19.6. Drivers and Restraints - Impact Analysis 20. Market Structure Analysis 20.1. Market Concentration 20.2. Market Share Analysis of Top Players 21. Competition Analysis 21.1. Competition Dashboard 21.2. Competition Deep Dive 21.2.1. Medtronic Plc 21.2.1.1. Overview 21.2.1.2. Product Portfolio 21.2.1.3. Profitability by Market Segments (Product / Channel / Region) 21.2.1.4. Strategy Overview 21.2.1.4.1. Marketing Strategy 21.2.1.4.2. Product Strategy 21.2.1.4.3. Channel Strategy 21.2.2. Merit Medical Systems 21.2.2.1. Overview 21.2.2.2. Product Portfolio 21.2.2.3. Profitability by Market Segments (Product / Channel / Region) 21.2.2.4. Strategy Overview 21.2.2.4.1. Marketing Strategy 21.2.2.4.2. Product Strategy 21.2.2.4.3. Channel Strategy 21.2.3. Biosense Webster, Inc 21.2.3.1. Overview 21.2.3.2. Product Portfolio 21.2.3.3. Profitability by Market Segments (Product / Channel / Region) 21.2.3.4. Strategy Overview 21.2.3.4.1. Marketing Strategy 21.2.3.4.2. Product Strategy 21.2.3.4.3. Channel Strategy 21.2.4. Teleflex Incorporated 21.2.4.1. Overview 21.2.4.2. Product Portfolio 21.2.4.3. Profitability by Market Segments (Product / Channel / Region) 21.2.4.4. Strategy Overview 21.2.4.4.1. Marketing Strategy 21.2.4.4.2. Product Strategy 21.2.4.4.3. Channel Strategy 21.2.5. Boston Scientific Corporation 21.2.5.1. Overview 21.2.5.2. Product Portfolio 21.2.5.3. Profitability by Market Segments (Product / Channel / Region) 21.2.5.4. Strategy Overview 21.2.5.4.1. Marketing Strategy 21.2.5.4.2. Product Strategy 21.2.5.4.3. Channel Strategy 21.2.6. Biomerics LLC 21.2.6.1. Overview 21.2.6.2. Product Portfolio 21.2.6.3. Profitability by Market Segments (Product / Channel / Region) 21.2.6.4. Strategy Overview 21.2.6.4.1. Marketing Strategy 21.2.6.4.2. Product Strategy 21.2.6.4.3. Channel Strategy 21.2.7. OSYPKA AG 21.2.7.1. Overview 21.2.7.2. Product Portfolio 21.2.7.3. Profitability by Market Segments (Product / Channel / Region) 21.2.7.4. Strategy Overview 21.2.7.4.1. Marketing Strategy 21.2.7.4.2. Product Strategy 21.2.7.4.3. Channel Strategy 21.2.8. Abbott 21.2.8.1. Overview 21.2.8.2. Product Portfolio 21.2.8.3. Profitability by Market Segments (Product / Channel / Region) 21.2.8.4. Strategy Overview 21.2.8.4.1. Marketing Strategy 21.2.8.4.2. Product Strategy 21.2.8.4.3. Channel Strategy 21.2.9. Japan Lifeline Co. 21.2.9.1. Overview 21.2.9.2. Product Portfolio 21.2.9.3. Profitability by Market Segments (Product / Channel / Region) 21.2.9.4. Strategy Overview 21.2.9.4.1. Marketing Strategy 21.2.9.4.2. Product Strategy 21.2.9.4.3. Channel Strategy 21.2.10. CathRx Ltd 21.2.10.1. Overview 21.2.10.2. Product Portfolio 21.2.10.3. Profitability by Market Segments (Product / Channel / Region) 21.2.10.4. Strategy Overview 21.2.10.4.1. Marketing Strategy 21.2.10.4.2. Product Strategy 21.2.10.4.3. Channel Strategy 21.2.11. Biotronik SE & Co. KG. 21.2.11.1. Overview 21.2.11.2. Product Portfolio 21.2.11.3. Profitability by Market Segments (Product / Channel / Region) 21.2.11.4. Strategy Overview 21.2.11.4.1. Marketing Strategy 21.2.11.4.2. Product Strategy 21.2.11.4.3. Channel Strategy 22. Assumptions and Acronyms Used 23. Research Methodology
Don't pay for what you don't need
Customize your report by selecting specific countries or regions and save 30%!
List of Tables
Table 01: Key Cardiovascular Deals In Recent Years: Consolidation Table 02: Key M&A Activity in Industry Table 03: Coding and reimbursement - Physician services Table 03: Average Selling Price (US$), By Product Type Table 04: Coding and reimbursement - Image Acquisition Procedures Table 05: Coding and reimbursement - Outpatient Facility Services & Inpatient Facility Services Table 06: Analysis of key patents issued by leading manufacturers in the industry Table 07: Key Procedure Statistics, By Region in 2021 Table 08: Global Market Analysis by Volume (Units) Historical, 2014 to 2021, By Product Type Table 09: Global Market Analysis by Volume (Units) Forecast 2022 to 2029, By Product Type Table 10: Global Market Value Analysis (US$) 2014 to 2021 and Forecast 2022 to 2029, By Product Type Table 11: Global Market Volume Analysis (Units) 2014 to 2021, By Product Type Table 12: Global Market Volume Analysis (Units) Forecast 2022 to 2029, By Product Type Table 13: Global Market Volume Analysis 2014 to 2021 and Forecast 2022 to 2029, By Application Table 14: Global Market Volume Analysis 2014 to 2021 and Forecast 2022 to 2029, By Application Table 15: Global Market Analysis by Value US$ 2014 to 2021 and Forecast 2022 to 2029, By End User Table 16: Global Market Analysis by Value US$ 2014 to 2021 and Forecast 2022 to 2029, By Region Table 17: North America Market Size (US$ Million) Analysis 2014 to 2021 and Forecast 2022 to 2029, By Country Table 18: North America Market Size (US$ Million) Analysis 2014 to 2021 and Forecast 2022 to 2029, By Product Type Table 19: North America Market Analysis by Volume (Units) Historical 2014 to 2021, By Application Table 20: North America Market Analysis by Volume (Units) Forecast 2022 to 2029, By Application Table 21: North America Market Size (US$ Million) Analysis 2014 to 2021 and Forecast 2022 to 2029, By End User Table 22: Latin America Market Size (US$ Million) Analysis 2014 to 2021 and Forecast 2022 to 2029, By Country Table 23: Latin America Market Size (US$ Million) Analysis 2014 to 2021 and Forecast 2022 to 2029, By Product Type Table 24: Latin America Market Analysis by Volume (Units) Historical 2014 to 2021, By Application Table 25: Latin America Market Analysis by Volume (Units) Forecast 2022 to 2029, By Application Table 26: Latin America Market Size (US$ Million) Analysis 2014 to 2021 and Forecast 2022 to 2029, By End User Table 27: Europe Market Size (US$ Million) Analysis 2014 to 2021 and Forecast 2022 to 2029, By Country Table 28: Europe Market Size (US$ Million) Analysis 2014 to 2021 and Forecast 2022 to 2029, By Product Type Table 29: Europe Market Analysis by Volume (Units) Historical 2014 to 2021, By Application Table 30: Europe Market Analysis by Volume (Units) Forecast 2022 to 2029, By Application Table 31: Europe Market Size (US$ Million) Analysis 2014 to 2021 and Forecast 2022 to 2029, By End User Table 32: South Asia Market Size (US$ Million) Analysis 2014 to 2021 and Forecast 2022 to 2029, By Country Table 33: South Asia Market Size (US$ Million) Analysis 2014 to 2021 and Forecast 2022 to 2029, By Product Type Table 34: South Asia Market Analysis by Volume (Units) Historical 2014 to 2021, By Application Table 35: South Asia Market Analysis by Volume (Units) Forecast 2022 to 2029, By Application Table 36: South Asia Market Size (US$ Million) Analysis 2014 to 2021 and Forecast 2022 to 2029, By End User Table 37: East Asia Market Size (US$ Million) Analysis 2014 to 2021 and Forecast 2022 to 2029, By Country Table 38: East Asia Market Size (US$ Million) Analysis 2014 to 2021 and Forecast 2022 to 2029, By Product Type Table 39: East Asia Market Analysis by Volume (Units) Historical 2014 to 2021, By Application Table 40: East Asia Market Analysis by Volume (Units) Forecast 2022 to 2029, By Application Table 41: East Asia Market Size (US$ Million) Analysis 2014 to 2021 and Forecast 2022 to 2029, By End User Table 42: Oceania Market Size (US$ Million) Analysis 2014 to 2021 and Forecast 2022 to 2029, By Country Table 43: Oceania Market Size (US$ Million) Analysis 2014 to 2021 and Forecast 2022 to 2029, By Product Type Table 44: Latin America Average Selling Price (US$), By Product Type Table 44: Oceania Market Analysis by Volume (Units) Historical 2014 to 2021, By Application Table 45: Oceania Market Analysis by Volume (Units) Forecast 2022 to 2029, By Application Table 46: Oceania Market Size (US$ Million) Analysis 2014 to 2021 and Forecast 2022 to 2029, By End User Table 47: MEA Market Size (US$ Million) Analysis 2014 to 2021 and Forecast 2022 to 2029, By Country Table 48: MEA Market Size (US$ Million) Analysis 2014 to 2021 and Forecast 2022 to 2029, By Product Type Table 49: MEA Market Analysis by Volume (Units) Historical 2014 to 2021, By Application Table 50: MEA Market Analysis by Volume (Units) Forecast 2022 to 2029, By Application Table 51: MEA Market Size (US$ Million) Analysis 2014 to 2021 and Forecast 2022 to 2029, By End User Table 52: India Market Size (US$ Million) Analysis 2014 to 2021 and Forecast 2022 to 2029, By Product Type Table 53: India Market Analysis by Volume (Units) Historical 2014 to 2021, By Application Table 54: India Market Analysis by Volume (Units) Forecast 2022 to 2029, By Application Table 55: India Market Size (US$ Million) Analysis 2014 to 2021 and Forecast 2022 to 2029, By End User Table 56: Brazil Market Size (US$ Million) Analysis 2014 to 2021 and Forecast 2022 to 2029, By Product Type Table 57: Brazil Market Analysis by Volume (Units) Historical 2014 to 2021, By Application Table 58: Brazil Market Analysis by Volume (Units) Forecast 2022 to 2029, By Application Table 59: Brazil Market Size (US$ Million) Analysis 2014 to 2021 and Forecast 2022 to 2029, By End User Table 60: China Market Size (US$ Million) Analysis 2014 to 2021 and Forecast 2022 to 2029, By Product Type Table 61: China Market Analysis by Volume (Units) Historical 2014 to 2021, By Application Table 62: China Market Analysis by Volume (Units) Forecast 2022 to 2029, By Application Table 63: China Market Size (US$ Million) Analysis 2014 to 2021 and Forecast 2022 to 2029, By End User
List of Charts
Figure 01: Number of patents granted from the year 2014 to 2021 Figure 02: Number of patents filed or created from the year 2014 to 2021 Figure 03: Average Selling Price (The US$), By Product Type Figure 04: Global Market Value (The US$ Million) 2014 to 2029 Figure 05: Global Market Absolute $ Opportunity (The US$ Million), 2014 to 2021 Figure 06: Global Market Absolute $ Opportunity (The US$ Million), 2022 to 2029 Figure 07: Global Market The US$ Million, by Product Type, 2022E Figure 08: Global Market Share%, by Product Type, 2022E Figure 09: Global Market Share%, by Product Type, 2029F Figure 10: Global Market Attractiveness Analysis, By Product Type Figure 11: Global Market The US$ Million, by Application, 2022E Figure 12: Global Market Share% by Value, by Application, 2022E Figure 13: Global Market Share% by Value, by Application, 2029F Figure 14: Global Market Attractiveness Analysis, By Application Figure 15: Global Market The US$ Million, by End The USAer, 2022E Figure 16: Global Market Share% by Value, by End The USAer, 2022E Figure 17: Global Market Share% by Value, by End The USAer, 2029F Figure 18: Global Market Attractiveness Analysis, By End The USAer Figure 19: Global Market The US$ Million, by Region, 2022E Figure 20: Global Market Share%, by Region, 2022E Figure 21: Global Market Share%, by Region, 2029F Figure 22: Global Market Attractiveness Analysis, By Region Figure 23: North America Market Share%, by Product Type, 2022E Figure 24: North America Market Share%, by Application, 2022E Figure 25: North America Market Share%, by End The User, 2022E Figure 26: North America Market Share%, by Country, 2022E Figure 27: North America Market Size (The US$ Million) Analysis, 2014 to 2021 Figure 28: North America Market Value (The US$ Million) & Y-o-Y Growth (%), 2022 to 2029 Figure 29: North America Average Selling Price (The US$), By Product Type Figure 30: The USA Market Size (The US$ Million) Analysis, 2014 to 2021 Figure 31: The USA Market Value (The US$ Million) & Y-o-Y Growth (%), 2022 to 2029 Figure 32: Canada Market Size (The US$ Million) Analysis, 2014 to 2021 Figure 33: Canada Market Value (The US$ Million) & Y-o-Y Growth (%), 2022 to 2029 Figure 34: North America Market Attractiveness Analysis, By Product Type Figure 35: North America Market Attractiveness Analysis, By End The USAer Figure 36: North America Market Attractiveness Analysis, By Application Figure 37: North America Market Attractiveness Analysis, By Country Figure 38: Latin America Market Share%, by Product Type, 2022E Figure 39: Latin America Market Share%, by Application, 2022E Figure 40: Latin America Market Share%, by End The USAer, 2022E Figure 41: Latin America Market Share%, by Country, 2022E Figure 42: Latin America Market Size (The US$ Million) Analysis, 2014 to 2021 Figure 43: Latin America Market Value (The US$ Million) & Y-o-Y Growth (%), 2022 to 2029 Figure 45: Brazil Market Size (The US$ Million) Analysis, 2014 to 2021 Figure 46: Brazil Market Value (The US$ Million) & Y-o-Y Growth (%), 2022 to 2029 Figure 47: Mexico Market Size (The US$ Million) Analysis, 2014 to 2021 Figure 48: Mexico Market Value (The US$ Million) & Y-o-Y Growth (%), 2022 to 2029 Figure 49: Rest of Latin America Market Size (The US$ Million) Analysis, 2014 to 2021 Figure 50: Rest of Latin America Market Size (The US$ Million) Analysis, 2014 to 2021 Figure 51: Latin America Market Attractiveness Analysis, By Product Type Figure 52: Latin America Market Attractiveness Analysis, By End The USAer Figure 53: Latin America Market Attractiveness Analysis, By Application Figure 54: Latin America Market Attractiveness Analysis, By Country Figure 55: Europe Market Share%, by Product Type, 2022E Figure 56: Europe Market Share%, by Application, 2022E Figure 57: Europe Market Share%, by End The USAer, 2022E Figure 58: Europe Market Share%, by Country, 2022E Figure 59: Europe Market Size (The US$ Million) Analysis, 2014 to 2021 Figure 60: Europe Market Value (The US$ Million) & Y-o-Y Growth (%), 2022 to 2029 Figure 62: Germany Market Size (The US$ Million) Analysis, 2014 to 2021 Figure 63: Germany Market Value (The US$ Million) & Y-o-Y Growth (%), 2022 to 2029 Figure 64: Spain Market Size (The US$ Million) Analysis, 2014 to 2021 Figure 65: Spain Market Value (The US$ Million) & Y-o-Y Growth (%), 2022 to 2029 Figure 66: The UK Market Size (The US$ Million) Analysis, 2014 to 2021 Figure 67: The UK Market Value (The US$ Million) & Y-o-Y Growth (%), 2022 to 2029 Figure 68: Italy Market Size (The US$ Million) Analysis, 2014 to 2021 Figure 69: Italy Market Value (The US$ Million) & Y-o-Y Growth (%), 2022 to 2029 Figure 70: France Market Size (The US$ Million) Analysis, 2014 to 2021 Figure 71: France Market Value (The US$ Million) & Y-o-Y Growth (%), 2022 to 2029 Figure 72: BENELUX Market Size (The US$ Million) Analysis, 2014 to 2021 Figure 73: BENELUX Market Value (The US$ Million) & Y-o-Y Growth (%), 2022 to 2029 Figure 74: RThe USAsia Market Size (The US$ Million) Analysis, 2014 to 2021 Figure 75: RThe USAsia Market Value (The US$ Million) & Y-o-Y Growth (%), 2022 to 2029 Figure 76: Rest of Europe Market Size (The US$ Million) Analysis, 2014 to 2021 Figure 77: Rest of Europe Market Value (The US$ Million) & Y-o-Y Growth (%), 2022 to 2029 Figure 78: Europe Market Attractiveness Analysis, By Product Type Figure 79: Europe Market Attractiveness Analysis, By End The USAer Figure 80: Europe Market Attractiveness Analysis, By Application Figure 81: Europe Market Attractiveness Analysis, By Country Figure 82: South Asia Market Share%, by Product Type, 2022E Figure 83: South Asia Market Share%, by Application, 2022E Figure 84: South Asia Market Share%, by End The USAer, 2022E Figure 85: South Asia Market Share%, by Country, 2022E Figure 86: South Asia Market Size (The US$ Million) Analysis, 2014 to 2021 Figure 87: South Asia Market Value (The US$ Million) & Y-o-Y Growth (%), 2022 to 2029 Figure 89: India Market Size (The US$ Million) Analysis, 2014 to 2021 Figure 90: India Market Value (The US$ Million) & Y-o-Y Growth (%), 2022 to 2029 Figure 91: Malaysia Market Size (The US$ Million) Analysis, 2014 to 2021 Figure 92: Malaysia Market Value (The US$ Million) & Y-o-Y Growth (%), 2022 to 2029 Figure 93: Indonesia Market Size (The US$ Million) Analysis, 2014 to 2021 Figure 94: Indonesia Market Value (The US$ Million) & Y-o-Y Growth (%), 2022 to 2029 Figure 95: Thailand Market Size (The US$ Million) Analysis, 2014 to 2021 Figure 96: Thailand Market Value (The US$ Million) & Y-o-Y Growth (%), 2022 to 2029 Figure 97: Rest of South Asia Market Size (The US$ Million) Analysis, 2014 to 2021 Figure 98: Rest of South Asia Market Size (The US$ Million) Analysis, 2014 to 2021 Figure 99: South Asia Market Attractiveness Analysis, By Product Type Figure 100: South Asia Market Attractiveness Analysis, By End The User Figure 101: South Asia Market Attractiveness Analysis, By Application Figure 102: South Asia Market Attractiveness Analysis, By Country Figure 103: East Asia Market Share%, by Product Type, 2022E Figure 104: East Asia Market Share%, by Application, 2022E Figure 105: East Asia Market Share%, by End The User, 2022E Figure 106: East Asia Market Share%, by Country, 2022E Figure 107: East Asia Market Size (The US$ Million) Analysis, 2014 to 2021 Figure 108: East Asia Market Value (The US$ Million) & Y-o-Y Growth (%), 2022 to 2029 Figure 110: China Market Size (The US$ Million) Analysis, 2014 to 2021 Figure 111: China Market Value (The US$ Million) & Y-o-Y Growth (%), 2022 to 2029 Figure 112: Japan Market Size (The US$ Million) Analysis, 2014 to 2021 Figure 113: Japan Market Value (The US$ Million) & Y-o-Y Growth (%), 2022 to 2029 Figure 114: South Korea Market Size (The US$ Million) Analysis, 2014 to 2021 Figure 115: South Korea Market Size (The US$ Million) Analysis, 2014 to 2021 Figure 116: East Asia Market Attractiveness Analysis, By Product Type Figure 117: East Asia Market Attractiveness Analysis, By End The User Figure 118: East Asia Market Attractiveness Analysis, By Application Figure 119: East Asia Market Attractiveness Analysis, By Country Figure 120: Oceania Market Share%, by Product Type, 2022E Figure 121: Oceania Market Share%, by Application, 2022E Figure 122: Oceania Market Share%, by End The User, 2022E Figure 123: Oceania Market Share%, by Country, 2022E Figure 124: Oceania Market Size (The US$ Million) Analysis, 2014 to 2021 Figure 125: Oceania Market Value (The US$ Million) & Y-o-Y Growth (%), 2022 to 2029 Figure 127: New Zealand Market Size (The US$ Million) Analysis, 2014 to 2021 Figure 128: New Zealand Market Value (The US$ Million) & Y-o-Y Growth (%), 2022 to 2029 Figure 129: The Australia Market Size (The US$ Million) Analysis, 2014 to 2021 Figure 130: The Australia Market Value (The US$ Million) & Y-o-Y Growth (%), 2022 to 2029 Figure 131: Oceania Market Attractiveness Analysis, By Product Type Figure 132: Oceania Market Attractiveness Analysis, By End The USAer Figure 133: Oceania Market Attractiveness Analysis, By Application Figure 134: Oceania Market Attractiveness Analysis, By Country Figure 135: MEA Market Share%, by Product Type, 2022E Figure 136: MEA Market Share%, by Application, 2022E Figure 137: MEA Market Share%, by End The User, 2022E Figure 138: MEA Market Share%, by Country, 2022E Figure 139: MEA Market Size (The US$ Million) Analysis, 2014 to 2021 Figure 140: MEA Market Value (The US$ Million) & Y-o-Y Growth (%), 2022 to 2029 Figure 142: South Africa Market Size (The US$ Million) Analysis, 2014 to 2021 Figure 143: South Africa Market Value (The US$ Million) & Y-o-Y Growth (%), 2022 to 2029 Figure 144: GCC Market Size (The US$ Million) Analysis, 2014 to 2021 Figure 145: GCC Market Value (The US$ Million) & Y-o-Y Growth (%), 2022 to 2029 Figure 146: Turkey Market Size (The US$ Million) Analysis, 2014 to 2021 Figure 147: Turkey Market Value (The US$ Million) & Y-o-Y Growth (%), 2022 to 2029 Figure 148: North Africa Market Size (The US$ Million) Analysis, 2014 to 2021 Figure 149: North Africa Market Value (The US$ Million) & Y-o-Y Growth (%), 2022 to 2029 Figure 150: Rest of MEA Market Size (The US$ Million) Analysis, 2014 to 2021 Figure 151: Rest of MEA Market Size (The US$ Million) Analysis, 2014 to 2021 Figure 152: MEA Market Attractiveness Analysis, By Product Type Figure 153: MEA Market Attractiveness Analysis, By End The User Figure 154: MEA Market Attractiveness Analysis, By Application Figure 155: MEA Market Attractiveness Analysis, By Country Figure 156: Market Value Proportion Analysis, By Key Countries, 2022E Figure 157: Global Vs. Country, Y-O-Y Growth Comparison Figure 158: Market Value Proportion Analysis, By Key Countries, 2022E Figure 158: India Market Size (The US$ Million) Analysis, 2014 to 2021 Figure 159: Global Vs. Country, Y-O-Y Growth Comparison Figure 159: India Market Value (The US$ Million) & Y-o-Y Growth (%), 2022 to 2029 Figure 161: India Market Attractiveness Analysis, By Product Type Figure 162: India Market Attractiveness Analysis, By Application Figure 163: India Market Attractiveness Analysis, By End The User Figure 164: Brazil Market size (The US$ Million) Analysis, 2014 to 2021 Figure 165: Brazil Market Value (The US$ Million) & Y-o-Y Growth (%), 2022 to 2029 Figure 167: Brazil Market Attractiveness Analysis, By Product Type Figure 168: Brazil Market Attractiveness Analysis, By Application Figure 169: Brazil Market Attractiveness Analysis, By End The User Figure 170: China Market Size (The US$ Million) Analysis, 2014 to 2021 Figure 171: China Market Value (The US$ Million) & Y-o-Y Growth (%), 2022 to 2029 Figure 173: China Market Attractiveness Analysis, By Product Type Figure 174: China Market Attractiveness Analysis, By Application Figure 175: China Market Attractiveness Analysis, By End The User
Recommendations
Explore Healthcare Insights
View Reports