Dehydrating Breather Market Outlook for 2024 to 2034

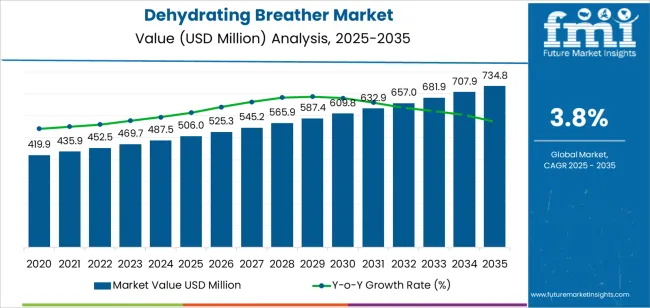
The dehydrating breather market value is estimated to be US$ 487.5 million in 2024. As power plants and renewable energy initiatives increase globally, dehydrating breathers are in greater demand to maintain the lifespan and effectiveness of transformers used at such facilities.

The total demand for dehydrating breathers is predicted to boom at a sluggish CAGR of 3.8% over the next ten years. Therefore, the dehydrating breather industry value is estimated to reach US$ 711.2 million by 2034.

Dehydrating Breather Market Trends & Analysis

  • In order to ensure that transformers operate as efficiently as possible within sustainable energy systems, many manufacturers are now designing re-generable breathers. Hence, the creation of transformer breathers with integrated desiccant materials or heating components for on-demand regeneration, which doesn't require replacement, is the new trend.
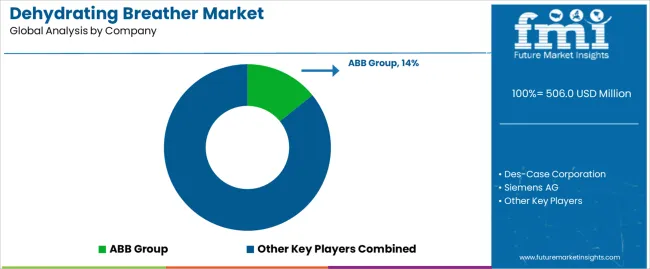
  • Including transformers in smart grid architecture has increased the demand for remote diagnostics and real-time moisture level monitoring of breather vents. ABB Group has achieved a commendable job in this endeavor by developing breathers with sensors and wireless communication modules. Dehydrating breathers equipped with remote monitoring capabilities are anticipated to further bolster the trend of real-time evaluation, maintenance, and minimizing downtime.
Report Attribute Details
Dehydrating Breather Market Size (2024) US$ 487.5 million
Market Anticipated Forecast Value (2034) US$ 711.2 million
Market Projected Growth Rate (2024 to 2034) 3.8% CAGR

Dehydrating Breather Market Historical Analysis Vs Forecast Outlook

The conventional dehydrating breather market was valued at US$ 372 million in 2019. Over the following five years, the CAGR for sales of dehydrating breathers was 5.7%. The overall market reached a valuation of US$ 465.2 million in 2023.

According to the global dehydrating breathers strategic business report, the initial outbreak caused supply chain disruptions and temporarily slowed down breather installation and maintenance operations. However, interest in smart dehydrating breathers surged during this period due to a spike in remote monitoring and maintenance solutions.

Attributes Details
Dehydrating Breather Market Value (2019) US$ 372 million
Market Revenue (2023) US$ 465.2 million
Market Historical Growth Rate (CAGR 2019 to 2023) 5.7% CAGR

Prominent Factors Fuelling the Global Dehydrating Breather Market Growth

As industrialization is rapidly increasing in Asian and Latin American economies, there is a greater need for transformers, resulting in higher sales of dehydrating breathers in many developing markets in these regions.

Vented breather applications for energy security and resilience in diverse industries, including manufacturing, construction, and information technology, are expected to expand within the breather filter market.

Industry-wide efforts to promote environmental sustainability are encouraging the reduction of dust contamination in transformers by employing better desiccant formulations and sealed system breather housings.

Likewise, the adoption of nitrogen-sealed breathers is expected to rise further by eliminating the chance of transformer oil leaks and pollution, thus keeping impurities out.

Comparative View of Adjacent Dehydrating Breather Market

The section below represents the general trends and opportunities in two other adjacent markets through 2034 for easy comparison. The sales growth in the power transformer market is expected to impact the demand for dehydrating breathers directly.

On the other hand, the robust growth of the transformer monitoring system market hints at the expected technological advancements in the dehydrating breather sector.

Dehydrating Breather Market:

Attributes Dehydrating Breather Market
CAGR (2024 to 2034) 3.8%
Growth Factor By limiting moisture intrusion and alleviating energy transmission issues, dehydrating breathers help transformers last longer
Market Opportunities The inclusion and use of wireless monitoring tools with dehydrating breathers allow for real-time evaluation, intervention, and reduction of downtime
Market Challenges The market expansion is anticipated to be hampered by fluctuations in the cost and supply of raw materials used in the making of desiccants

Power Transformer Market:

Attributes Power Transformer Market
CAGR (2024 to 2034) 5%
Growth Factor The fast growth of the power distribution networks in emerging nations with the intention to electrify rural areas rapidly
Market Opportunities There is a rise in the production and sales of low-cost transformers that can be deployed in apartments, small residential, and commercial areas
Market Challenges Strict regulations limiting the use and disposal of transformer oils are being implemented in response to the growing environmental consciousness

Transformer Monitoring System Market:

Attributes Transformer Monitoring System Market
CAGR (2024 to 2034) 8.9%
Growth Factor Transformer monitoring systems have the capacity to offer real-time data for operational safety, maintenance, and dependability
Market Opportunities Growing industrial facilities and manufacturing units require uninterrupted power supply for a range of processes
Market Challenges The higher installation and operation costs of power transformer monitoring systems are anticipated to limit market expansion

Country-wise Insights

The table below puts together the CAGRs for countries that are expected to witness higher production of dehydrating breathers during the forecast years.

Regional Market Comparison CAGR (2024 to 2034)
United States 4.2%
Japan 3.1%
United Kingdom 5.3%
South Korea 5.6 %
China 4.7%

The United States Dehydrating Breather Market Leads with Higher Installed Capacity for Energy Generation

Demand for dehydrating breathers in the United States is expected to increase at a 4.2% CAGR through 2034. The net worth of the United States market is projected to be around US$ 128.2 million by the end of the forecast period.

  • There is a greater need for dehydrating breather technology to extend the dependability and longevity of transformers and other voltage modulation equipment in the United States.
  • Upgraded industry standards in North America call for greater use of transformer venting systems to regulate moisture levels, prevent oxidation, and comply with regulations.

Expanding Renewable Energy Projects in the United Kingdom Creating Higher Demand for Breather Technology

The dehydrating breather market in the United Kingdom is expected to witness a moderate CAGR of 5.3% from 2024 to 2034. The net worth of the United Kingdom market is forecasted to be US$ 29 million in 2034.

  • Concerns regarding the longevity and efficiency of transformers are on the rise due to energy constraints following geopolitical tensions in Europe.
  • The effective operation of transformers is a prerequisite for the seamless integration of electricity from renewable energy projects into existing grids.

Dehydrating Breather Manufacturers in China Working on Utilizing Novel Desiccant Materials

The demand for dehydrating breathers is likely to surge at a 4.7% CAGR through 2034 due to expanding power transmission and distribution networks. By the end of this forecast period, the net worth of the market in China is forecasted to be US$ 113.7 million.

  • China's government is investing heavily in establishing power generation facilities across the country.
  • The development and use of bio-based desiccant materials are soaring due to the growing need for sustainable and ecologically friendly solutions.

Energy Conservation Laws in Japan are Driving Dehydrating Breather Applications

Manufacturing and utilization of dehydrating breathers in Japan are likely to increase at a CAGR of 3.1% through 2034. The overall market share of Japan is projected to be valued at US$ 62.7 million by 2034.

  • The extension of renewable energy conversion facilities for power generation is driving the demand for dehydration breather systems in Japan.
  • Stringent laws and rules pertaining to the electricity distribution sector are likely to further strengthen the silica gel breather market trends in the country.

Dehydrating Breather Sales Soaring with Rapid Industrialization and Privatization

With a projected CAGR of 5.6%, the dehydrating breather market in South Korea is expected to expand at a higher rate in the Asia Pacific region. The regional market is further projected to reach a valuation of US$ 42.1 million by the end of this forecast period.

  • Currently, installations of electric energy transformers across many privately owned industrial sectors are on the rise.
  • An increased emphasis on monitoring power transformer health to reduce energy wastage calls for greater use of moisture removal breathers.

Category-wise Insights

Power Generation or the Utility Sector creates the Maximum Demand for Desiccant Breathers

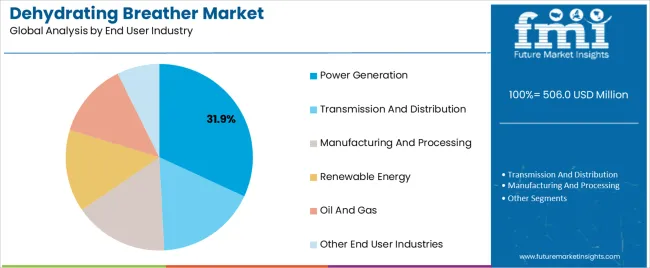
The power generation sector is expected to hold a significant market share in 2024, making it the top end user industry category in the dehydrating breather market. Over the projected years, this segment is likely to inflate at a CAGR of 3.3%, according to the market analysis.

Attributes Details
Top End User Industry Type or Segment Power Generation
Market Segment Growth Rate from 2024 to 2034 3.3% CAGR
Market Segment Growth Rate from 2019 to 2023 5.3% CAGR
  • The presence of electricity transmission lines in harsh environments makes moisture-absorption breathers crucial for the power generation sector by preserving the longevity of transformers.
  • Dehydrating breathers are gaining more traction in the power generation sector with the increase in renewable energy projects across the globe.

Silica Gel Dominates due to outstanding Moisture Absorption Characteristics

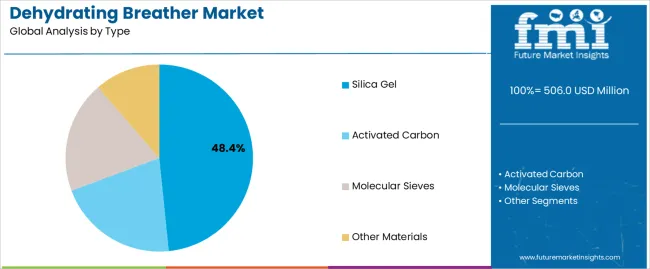
Silica gel is the most commonly used material type in dehydrating breathers, capturing more than 50% of the conventional dehydrating breather market size. This segment is anticipated to expand further with a CAGR of 3.6% between 2024 and 2034.

Attributes Details
Top Material Type or segment Silica Gel
Market Segment Growth Rate from 2024 to 2034 3.6% CAGR
Market Segment Growth Rate from 2019 to 2023 5.5% CAGR
  • Silica gel remains a popular option in the dehumidifying breather market for a variety of applications due to its ease of procurement and comparatively lower environmental risks compared to other choices.
  • Improved thermal stability of silica gel formulations is being developed to provide increased temperature tolerance in transformers that operate in harsh environments.
  • The share of the molecular sieves segment, however, is also growing at a faster rate owing to its improved particle filtering capacities over standard materials.

Competitive Landscape for Dehydrating Breather Market

Conventional dehydrating breather industry players are enhancing pressure swing adsorption (PSA) cycles to remove moisture more effectively while using less energy. New market players are utilizing 3D printing technology to produce breather housings, resulting in adaptable breather designs with maximum moisture collection and airflow efficiency.

Recent Developments in the Dehydrating Breather Market

  • In September 2022, Cable Systems Limited introduced the HB desiccant breather, constructed from high-strength polycarbonate with the additional protection of a polyethylene-coated metal screen. Its identical die-cast end plates are sealed in position to form a very strong unit, making it ideal for a wide range of transformer sizes.
  • In September 2019, Maschinenfabrik Reinhausen GmbH introduced the MTRAB 2.5, a new generation of dehydrating breathers designed to assist clients in lowering equipment life-cycle costs. It is also designed to overcome the difficulties posed by continuously rising requirements, such as longer working durations and higher current densities.

Key Players Profiled in the Dehydrating Breather Market Report

  • Des-Case Corporation
  • ABB Group
  • Siemens AG
  • Hubbell Incorporated
  • Eaton Corporation
  • Maschinenfabrik Reinhausen GmbH

Dehydrating Breather Market Report Scope

Attribute Details
Estimated Market Size (2024) US$ 487.5 million
Projected Market Size (2034) US$ 711.2 million
Anticipated Growth Rate (2024 to 2034) 3.8%
Forecast Period 2024 to 2034
Historical Data Available for 2019 to 2023
Market Analysis US$ million or billion for Value and Units for Volume
Key Regions Covered North America, Latin America, Europe, Middle East & Africa (MEA), East Asia, South Asia and Oceania
Key Countries Covered United States, Canada, Brazil, Mexico, Germany, Spain, Italy, France, United Kingdom, Russia, China, India, Australia & New Zealand, GCC Countries, and South Africa
Key Segments Covered By Material Type, By Application, By End User Industry, and By Region
Key Companies Profiled
  • Des-Case Corporation
  • ABB Group
  • Siemens AG
  • Hubbell Incorporated
  • Eaton Corporation
  • Maschinenfabrik Reinhausen GmbH
Report Coverage Market Forecast, Company Share Analysis, Competition Intelligence, DROT Analysis, Market Dynamics and Challenges, and Strategic Growth Initiatives
Customization & Pricing Available upon Request

Key Segments Covered by Dehydrating Breather Industry Survey Report

By Material Type:

  • Silica Gel
  • Activated Carbon
  • Molecular Sieves
  • Other Materials

By Application:

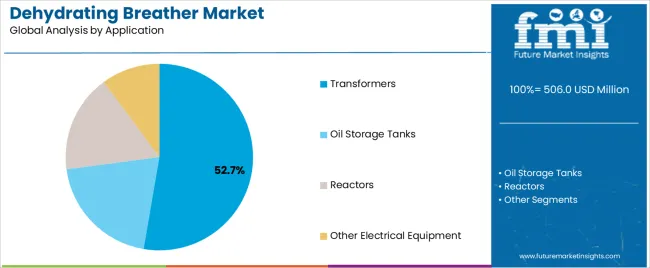
  • Transformers
  • Oil Storage Tanks
  • Reactors
  • Other Electrical Equipment

By End User Industry:

  • Power Generation
  • Transmission and Distribution
  • Manufacturing and Processing
  • Renewable Energy
  • Oil and Gas
  • Other End User Industries

By Region:

  • North America Market
  • Latin America Market
  • Europe Market
  • East Asia Market
  • South Asia and Pacific Market
  • Middle East and Africa (MEA) Market

Table of Content

1. Executive Summary

    1.1. Global Market Outlook

    1.2. Demand-side Trends

    1.3. Supply-side Trends

    1.4. Technology Roadmap Analysis

    1.5. Analysis and Recommendations

2. Market Overview

    2.1. Market Coverage / Taxonomy

    2.2. Market Definition / Scope / Limitations

3. Market Background

    3.1. Market Dynamics

        3.1.1. Drivers

        3.1.2. Restraints

        3.1.3. Opportunity

        3.1.4. Trends

    3.2. Scenario Forecast

        3.2.1. Demand in Optimistic Scenario

        3.2.2. Demand in Likely Scenario

        3.2.3. Demand in Conservative Scenario

    3.3. Opportunity Map Analysis

    3.4. Product Life Cycle Analysis

    3.5. Supply Chain Analysis

        3.5.1. Supply Side Participants and their Roles

            3.5.1.1. Producers

            3.5.1.2. Mid-Level Participants (Traders/ Agents/ Brokers)

            3.5.1.3. Wholesalers and Distributors

        3.5.2. Value Added and Value Created at Node in the Supply Chain

        3.5.3. List of Raw Material Suppliers

        3.5.4. List of Existing and Potential Buyer’s

    3.6. Investment Feasibility Matrix

    3.7. Value Chain Analysis

        3.7.1. Profit Margin Analysis

        3.7.2. Wholesalers and Distributors

        3.7.3. Retailers

    3.8. PESTLE and Porter’s Analysis

    3.9. Regulatory Landscape

        3.9.1. By Key Regions

        3.9.2. By Key Countries

    3.10. Regional Parent Market Outlook

    3.11. Production and Consumption Statistics

    3.12. Import and Export Statistics

4. Global Market Analysis 2019 to 2023 and Forecast, 2024 to 2034

    4.1. Historical Market Size Value (US$ Million) & Volume (Units) Analysis, 2019 to 2023

    4.2. Current and Future Market Size Value (US$ Million) & Volume (Units) Projections, 2024 to 2034

        4.2.1. Y-o-Y Growth Trend Analysis

        4.2.2. Absolute $ Opportunity Analysis

5. Global Market Analysis 2019 to 2023 and Forecast 2024 to 2034, By Material Type

    5.1. Introduction / Key Findings

    5.2. Historical Market Size Value (US$ Million) & Volume (Units) Analysis By Material Type, 2019 to 2023

    5.3. Current and Future Market Size Value (US$ Million) & Volume (Units) Analysis and Forecast By Material Type, 2024 to 2034

        5.3.1. Silica Gel

        5.3.2. Activated Carbon

        5.3.3. Molecular Sieves

        5.3.4. Others

    5.4. Y-o-Y Growth Trend Analysis By Material Type, 2019 to 2023

    5.5. Absolute $ Opportunity Analysis By Material Type, 2024 to 2034

6. Global Market Analysis 2019 to 2023 and Forecast 2024 to 2034, By Application

    6.1. Introduction / Key Findings

    6.2. Historical Market Size Value (US$ Million) & Volume (Units) Analysis By Application, 2019 to 2023

    6.3. Current and Future Market Size Value (US$ Million) & Volume (Units) Analysis and Forecast By Application, 2024 to 2034

        6.3.1. Oil Storage Tanks

        6.3.2. Reactors

        6.3.3. Transformers

        6.3.4. Other Electrical Equipment

    6.4. Y-o-Y Growth Trend Analysis By Application, 2019 to 2023

    6.5. Absolute $ Opportunity Analysis By Application, 2024 to 2034

7. Global Market Analysis 2019 to 2023 and Forecast 2024 to 2034, By End-User Industry

    7.1. Introduction / Key Findings

    7.2. Historical Market Size Value (US$ Million) & Volume (Units) Analysis By End-User Industry, 2019 to 2023

    7.3. Current and Future Market Size Value (US$ Million) & Volume (Units) Analysis and Forecast By End-User Industry, 2024 to 2034

        7.3.1. Power Generation

        7.3.2. Transmission and Distribution

        7.3.3. Manufacturing and Processing

        7.3.4. Renewable Energy

        7.3.5. Oil and Gas

        7.3.6. Others

    7.4. Y-o-Y Growth Trend Analysis By End-User Industry, 2019 to 2023

    7.5. Absolute $ Opportunity Analysis By End-User Industry, 2024 to 2034

8. Global Market Analysis 2019 to 2023 and Forecast 2024 to 2034, By Region

    8.1. Introduction

    8.2. Historical Market Size Value (US$ Million) & Volume (Units) Analysis By Region, 2019 to 2023

    8.3. Current Market Size Value (US$ Million) & Volume (Units) Analysis and Forecast By Region, 2024 to 2034

        8.3.1. North America

        8.3.2. Latin America

        8.3.3. Western Europe

        8.3.4. Eastern Europe

        8.3.5. South Asia and Pacific

        8.3.6. East Asia

        8.3.7. Middle East and Africa

    8.4. Market Attractiveness Analysis By Region

9. North America Market Analysis 2019 to 2023 and Forecast 2024 to 2034, By Country

    9.1. Historical Market Size Value (US$ Million) & Volume (Units) Trend Analysis By Market Taxonomy, 2019 to 2023

    9.2. Market Size Value (US$ Million) & Volume (Units) Forecast By Market Taxonomy, 2024 to 2034

        9.2.1. By Country

            9.2.1.1. USA

            9.2.1.2. Canada

        9.2.2. By Material Type

        9.2.3. By Application

        9.2.4. By End-User Industry

    9.3. Market Attractiveness Analysis

        9.3.1. By Country

        9.3.2. By Material Type

        9.3.3. By Application

        9.3.4. By End-User Industry

    9.4. Key Takeaways

10. Latin America Market Analysis 2019 to 2023 and Forecast 2024 to 2034, By Country

    10.1. Historical Market Size Value (US$ Million) & Volume (Units) Trend Analysis By Market Taxonomy, 2019 to 2023

    10.2. Market Size Value (US$ Million) & Volume (Units) Forecast By Market Taxonomy, 2024 to 2034

        10.2.1. By Country

            10.2.1.1. Brazil

            10.2.1.2. Mexico

            10.2.1.3. Rest of Latin America

        10.2.2. By Material Type

        10.2.3. By Application

        10.2.4. By End-User Industry

    10.3. Market Attractiveness Analysis

        10.3.1. By Country

        10.3.2. By Material Type

        10.3.3. By Application

        10.3.4. By End-User Industry

    10.4. Key Takeaways

11. Western Europe Market Analysis 2019 to 2023 and Forecast 2024 to 2034, By Country

    11.1. Historical Market Size Value (US$ Million) & Volume (Units) Trend Analysis By Market Taxonomy, 2019 to 2023

    11.2. Market Size Value (US$ Million) & Volume (Units) Forecast By Market Taxonomy, 2024 to 2034

        11.2.1. By Country

            11.2.1.1. Germany

            11.2.1.2. UK

            11.2.1.3. France

            11.2.1.4. Spain

            11.2.1.5. Italy

            11.2.1.6. Rest of Western Europe

        11.2.2. By Material Type

        11.2.3. By Application

        11.2.4. By End-User Industry

    11.3. Market Attractiveness Analysis

        11.3.1. By Country

        11.3.2. By Material Type

        11.3.3. By Application

        11.3.4. By End-User Industry

    11.4. Key Takeaways

12. Eastern Europe Market Analysis 2019 to 2023 and Forecast 2024 to 2034, By Country

    12.1. Historical Market Size Value (US$ Million) & Volume (Units) Trend Analysis By Market Taxonomy, 2019 to 2023

    12.2. Market Size Value (US$ Million) & Volume (Units) Forecast By Market Taxonomy, 2024 to 2034

        12.2.1. By Country

            12.2.1.1. Poland

            12.2.1.2. Russia

            12.2.1.3. Czech Republic

            12.2.1.4. Romania

            12.2.1.5. Rest of Eastern Europe

        12.2.2. By Material Type

        12.2.3. By Application

        12.2.4. By End-User Industry

    12.3. Market Attractiveness Analysis

        12.3.1. By Country

        12.3.2. By Material Type

        12.3.3. By Application

        12.3.4. By End-User Industry

    12.4. Key Takeaways

13. South Asia and Pacific Market Analysis 2019 to 2023 and Forecast 2024 to 2034, By Country

    13.1. Historical Market Size Value (US$ Million) & Volume (Units) Trend Analysis By Market Taxonomy, 2019 to 2023

    13.2. Market Size Value (US$ Million) & Volume (Units) Forecast By Market Taxonomy, 2024 to 2034

        13.2.1. By Country

            13.2.1.1. India

            13.2.1.2. Bangladesh

            13.2.1.3. Australia

            13.2.1.4. New Zealand

            13.2.1.5. Rest of South Asia and Pacific

        13.2.2. By Material Type

        13.2.3. By Application

        13.2.4. By End-User Industry

    13.3. Market Attractiveness Analysis

        13.3.1. By Country

        13.3.2. By Material Type

        13.3.3. By Application

        13.3.4. By End-User Industry

    13.4. Key Takeaways

14. East Asia Market Analysis 2019 to 2023 and Forecast 2024 to 2034, By Country

    14.1. Historical Market Size Value (US$ Million) & Volume (Units) Trend Analysis By Market Taxonomy, 2019 to 2023

    14.2. Market Size Value (US$ Million) & Volume (Units) Forecast By Market Taxonomy, 2024 to 2034

        14.2.1. By Country

            14.2.1.1. China

            14.2.1.2. Japan

            14.2.1.3. South Korea

        14.2.2. By Material Type

        14.2.3. By Application

        14.2.4. By End-User Industry

    14.3. Market Attractiveness Analysis

        14.3.1. By Country

        14.3.2. By Material Type

        14.3.3. By Application

        14.3.4. By End-User Industry

    14.4. Key Takeaways

15. Middle East and Africa Market Analysis 2019 to 2023 and Forecast 2024 to 2034, By Country

    15.1. Historical Market Size Value (US$ Million) & Volume (Units) Trend Analysis By Market Taxonomy, 2019 to 2023

    15.2. Market Size Value (US$ Million) & Volume (Units) Forecast By Market Taxonomy, 2024 to 2034

        15.2.1. By Country

            15.2.1.1. GCC Countries

            15.2.1.2. South Africa

            15.2.1.3. Israel

            15.2.1.4. Rest of MEA

        15.2.2. By Material Type

        15.2.3. By Application

        15.2.4. By End-User Industry

    15.3. Market Attractiveness Analysis

        15.3.1. By Country

        15.3.2. By Material Type

        15.3.3. By Application

        15.3.4. By End-User Industry

    15.4. Key Takeaways

16. Key Countries Market Analysis

    16.1. USA

        16.1.1. Pricing Analysis

        16.1.2. Market Share Analysis, 2023

            16.1.2.1. By Material Type

            16.1.2.2. By Application

            16.1.2.3. By End-User Industry

    16.2. Canada

        16.2.1. Pricing Analysis

        16.2.2. Market Share Analysis, 2023

            16.2.2.1. By Material Type

            16.2.2.2. By Application

            16.2.2.3. By End-User Industry

    16.3. Brazil

        16.3.1. Pricing Analysis

        16.3.2. Market Share Analysis, 2023

            16.3.2.1. By Material Type

            16.3.2.2. By Application

            16.3.2.3. By End-User Industry

    16.4. Mexico

        16.4.1. Pricing Analysis

        16.4.2. Market Share Analysis, 2023

            16.4.2.1. By Material Type

            16.4.2.2. By Application

            16.4.2.3. By End-User Industry

    16.5. Germany

        16.5.1. Pricing Analysis

        16.5.2. Market Share Analysis, 2023

            16.5.2.1. By Material Type

            16.5.2.2. By Application

            16.5.2.3. By End-User Industry

    16.6. UK

        16.6.1. Pricing Analysis

        16.6.2. Market Share Analysis, 2023

            16.6.2.1. By Material Type

            16.6.2.2. By Application

            16.6.2.3. By End-User Industry

    16.7. France

        16.7.1. Pricing Analysis

        16.7.2. Market Share Analysis, 2023

            16.7.2.1. By Material Type

            16.7.2.2. By Application

            16.7.2.3. By End-User Industry

    16.8. Spain

        16.8.1. Pricing Analysis

        16.8.2. Market Share Analysis, 2023

            16.8.2.1. By Material Type

            16.8.2.2. By Application

            16.8.2.3. By End-User Industry

    16.9. Italy

        16.9.1. Pricing Analysis

        16.9.2. Market Share Analysis, 2023

            16.9.2.1. By Material Type

            16.9.2.2. By Application

            16.9.2.3. By End-User Industry

    16.10. Poland

        16.10.1. Pricing Analysis

        16.10.2. Market Share Analysis, 2023

            16.10.2.1. By Material Type

            16.10.2.2. By Application

            16.10.2.3. By End-User Industry

    16.11. Russia

        16.11.1. Pricing Analysis

        16.11.2. Market Share Analysis, 2023

            16.11.2.1. By Material Type

            16.11.2.2. By Application

            16.11.2.3. By End-User Industry

    16.12. Czech Republic

        16.12.1. Pricing Analysis

        16.12.2. Market Share Analysis, 2023

            16.12.2.1. By Material Type

            16.12.2.2. By Application

            16.12.2.3. By End-User Industry

    16.13. Romania

        16.13.1. Pricing Analysis

        16.13.2. Market Share Analysis, 2023

            16.13.2.1. By Material Type

            16.13.2.2. By Application

            16.13.2.3. By End-User Industry

    16.14. India

        16.14.1. Pricing Analysis

        16.14.2. Market Share Analysis, 2023

            16.14.2.1. By Material Type

            16.14.2.2. By Application

            16.14.2.3. By End-User Industry

    16.15. Bangladesh

        16.15.1. Pricing Analysis

        16.15.2. Market Share Analysis, 2023

            16.15.2.1. By Material Type

            16.15.2.2. By Application

            16.15.2.3. By End-User Industry

    16.16. Australia

        16.16.1. Pricing Analysis

        16.16.2. Market Share Analysis, 2023

            16.16.2.1. By Material Type

            16.16.2.2. By Application

            16.16.2.3. By End-User Industry

    16.17. New Zealand

        16.17.1. Pricing Analysis

        16.17.2. Market Share Analysis, 2023

            16.17.2.1. By Material Type

            16.17.2.2. By Application

            16.17.2.3. By End-User Industry

    16.18. China

        16.18.1. Pricing Analysis

        16.18.2. Market Share Analysis, 2023

            16.18.2.1. By Material Type

            16.18.2.2. By Application

            16.18.2.3. By End-User Industry

    16.19. Japan

        16.19.1. Pricing Analysis

        16.19.2. Market Share Analysis, 2023

            16.19.2.1. By Material Type

            16.19.2.2. By Application

            16.19.2.3. By End-User Industry

    16.20. South Korea

        16.20.1. Pricing Analysis

        16.20.2. Market Share Analysis, 2023

            16.20.2.1. By Material Type

            16.20.2.2. By Application

            16.20.2.3. By End-User Industry

    16.21. GCC Countries

        16.21.1. Pricing Analysis

        16.21.2. Market Share Analysis, 2023

            16.21.2.1. By Material Type

            16.21.2.2. By Application

            16.21.2.3. By End-User Industry

    16.22. South Africa

        16.22.1. Pricing Analysis

        16.22.2. Market Share Analysis, 2023

            16.22.2.1. By Material Type

            16.22.2.2. By Application

            16.22.2.3. By End-User Industry

    16.23. Israel

        16.23.1. Pricing Analysis

        16.23.2. Market Share Analysis, 2023

            16.23.2.1. By Material Type

            16.23.2.2. By Application

            16.23.2.3. By End-User Industry

17. Market Structure Analysis

    17.1. Competition Dashboard

    17.2. Competition Benchmarking

    17.3. Market Share Analysis of Top Players

        17.3.1. By Regional

        17.3.2. By Material Type

        17.3.3. By Application

        17.3.4. By End-User Industry

18. Competition Analysis

    18.1. Competition Deep Dive

        18.1.1. Des-Case Corporation

            18.1.1.1. Overview

            18.1.1.2. Product Portfolio

            18.1.1.3. Profitability by Market Segments

            18.1.1.4. Sales Footprint

            18.1.1.5. Strategy Overview

                18.1.1.5.1. Marketing Strategy

                18.1.1.5.2. Product Strategy

                18.1.1.5.3. Channel Strategy

        18.1.2. ABB Group

            18.1.2.1. Overview

            18.1.2.2. Product Portfolio

            18.1.2.3. Profitability by Market Segments

            18.1.2.4. Sales Footprint

            18.1.2.5. Strategy Overview

                18.1.2.5.1. Marketing Strategy

                18.1.2.5.2. Product Strategy

                18.1.2.5.3. Channel Strategy

        18.1.3. Siemens AG

            18.1.3.1. Overview

            18.1.3.2. Product Portfolio

            18.1.3.3. Profitability by Market Segments

            18.1.3.4. Sales Footprint

            18.1.3.5. Strategy Overview

                18.1.3.5.1. Marketing Strategy

                18.1.3.5.2. Product Strategy

                18.1.3.5.3. Channel Strategy

        18.1.4. Hubbell Incorporated

            18.1.4.1. Overview

            18.1.4.2. Product Portfolio

            18.1.4.3. Profitability by Market Segments

            18.1.4.4. Sales Footprint

            18.1.4.5. Strategy Overview

                18.1.4.5.1. Marketing Strategy

                18.1.4.5.2. Product Strategy

                18.1.4.5.3. Channel Strategy

        18.1.5. Eaton Corporation

            18.1.5.1. Overview

            18.1.5.2. Product Portfolio

            18.1.5.3. Profitability by Market Segments

            18.1.5.4. Sales Footprint

            18.1.5.5. Strategy Overview

                18.1.5.5.1. Marketing Strategy

                18.1.5.5.2. Product Strategy

                18.1.5.5.3. Channel Strategy

        18.1.6. Maschinenfabrik Reinhausen GmbH

            18.1.6.1. Overview

            18.1.6.2. Product Portfolio

            18.1.6.3. Profitability by Market Segments

            18.1.6.4. Sales Footprint

            18.1.6.5. Strategy Overview

                18.1.6.5.1. Marketing Strategy

                18.1.6.5.2. Product Strategy

                18.1.6.5.3. Channel Strategy

        18.1.7. Parker-Hannifin Corporation

            18.1.7.1. Overview

            18.1.7.2. Product Portfolio

            18.1.7.3. Profitability by Market Segments

            18.1.7.4. Sales Footprint

            18.1.7.5. Strategy Overview

                18.1.7.5.1. Marketing Strategy

                18.1.7.5.2. Product Strategy

                18.1.7.5.3. Channel Strategy

        18.1.8. Qualitrol Corporation

            18.1.8.1. Overview

            18.1.8.2. Product Portfolio

            18.1.8.3. Profitability by Market Segments

            18.1.8.4. Sales Footprint

            18.1.8.5. Strategy Overview

                18.1.8.5.1. Marketing Strategy

                18.1.8.5.2. Product Strategy

                18.1.8.5.3. Channel Strategy

        18.1.9. Smith Flow Control

            18.1.9.1. Overview

            18.1.9.2. Product Portfolio

            18.1.9.3. Profitability by Market Segments

            18.1.9.4. Sales Footprint

            18.1.9.5. Strategy Overview

                18.1.9.5.1. Marketing Strategy

                18.1.9.5.2. Product Strategy

                18.1.9.5.3. Channel Strategy

        18.1.10. Siemens Gamesa Renewable Energy

            18.1.10.1. Overview

            18.1.10.2. Product Portfolio

            18.1.10.3. Profitability by Market Segments

            18.1.10.4. Sales Footprint

            18.1.10.5. Strategy Overview

                18.1.10.5.1. Marketing Strategy

                18.1.10.5.2. Product Strategy

                18.1.10.5.3. Channel Strategy

19. Assumptions & Acronyms Used

20. Research Methodology

List of Tables

Table 1: Global Market Value (US$ Million) Forecast by Region, 2019 to 2034

Table 2: Global Market Volume (Units) Forecast by Region, 2019 to 2034

Table 3: Global Market Value (US$ Million) Forecast by Material Type, 2019 to 2034

Table 4: Global Market Volume (Units) Forecast by Material Type, 2019 to 2034

Table 5: Global Market Value (US$ Million) Forecast by Application, 2019 to 2034

Table 6: Global Market Volume (Units) Forecast by Application, 2019 to 2034

Table 7: Global Market Value (US$ Million) Forecast by End-User Industry, 2019 to 2034

Table 8: Global Market Volume (Units) Forecast by End-User Industry, 2019 to 2034

Table 9: North America Market Value (US$ Million) Forecast by Country, 2019 to 2034

Table 10: North America Market Volume (Units) Forecast by Country, 2019 to 2034

Table 11: North America Market Value (US$ Million) Forecast by Material Type, 2019 to 2034

Table 12: North America Market Volume (Units) Forecast by Material Type, 2019 to 2034

Table 13: North America Market Value (US$ Million) Forecast by Application, 2019 to 2034

Table 14: North America Market Volume (Units) Forecast by Application, 2019 to 2034

Table 15: North America Market Value (US$ Million) Forecast by End-User Industry, 2019 to 2034

Table 16: North America Market Volume (Units) Forecast by End-User Industry, 2019 to 2034

Table 17: Latin America Market Value (US$ Million) Forecast by Country, 2019 to 2034

Table 18: Latin America Market Volume (Units) Forecast by Country, 2019 to 2034

Table 19: Latin America Market Value (US$ Million) Forecast by Material Type, 2019 to 2034

Table 20: Latin America Market Volume (Units) Forecast by Material Type, 2019 to 2034

Table 21: Latin America Market Value (US$ Million) Forecast by Application, 2019 to 2034

Table 22: Latin America Market Volume (Units) Forecast by Application, 2019 to 2034

Table 23: Latin America Market Value (US$ Million) Forecast by End-User Industry, 2019 to 2034

Table 24: Latin America Market Volume (Units) Forecast by End-User Industry, 2019 to 2034

Table 25: Western Europe Market Value (US$ Million) Forecast by Country, 2019 to 2034

Table 26: Western Europe Market Volume (Units) Forecast by Country, 2019 to 2034

Table 27: Western Europe Market Value (US$ Million) Forecast by Material Type, 2019 to 2034

Table 28: Western Europe Market Volume (Units) Forecast by Material Type, 2019 to 2034

Table 29: Western Europe Market Value (US$ Million) Forecast by Application, 2019 to 2034

Table 30: Western Europe Market Volume (Units) Forecast by Application, 2019 to 2034

Table 31: Western Europe Market Value (US$ Million) Forecast by End-User Industry, 2019 to 2034

Table 32: Western Europe Market Volume (Units) Forecast by End-User Industry, 2019 to 2034

Table 33: Eastern Europe Market Value (US$ Million) Forecast by Country, 2019 to 2034

Table 34: Eastern Europe Market Volume (Units) Forecast by Country, 2019 to 2034

Table 35: Eastern Europe Market Value (US$ Million) Forecast by Material Type, 2019 to 2034

Table 36: Eastern Europe Market Volume (Units) Forecast by Material Type, 2019 to 2034

Table 37: Eastern Europe Market Value (US$ Million) Forecast by Application, 2019 to 2034

Table 38: Eastern Europe Market Volume (Units) Forecast by Application, 2019 to 2034

Table 39: Eastern Europe Market Value (US$ Million) Forecast by End-User Industry, 2019 to 2034

Table 40: Eastern Europe Market Volume (Units) Forecast by End-User Industry, 2019 to 2034

Table 41: South Asia and Pacific Market Value (US$ Million) Forecast by Country, 2019 to 2034

Table 42: South Asia and Pacific Market Volume (Units) Forecast by Country, 2019 to 2034

Table 43: South Asia and Pacific Market Value (US$ Million) Forecast by Material Type, 2019 to 2034

Table 44: South Asia and Pacific Market Volume (Units) Forecast by Material Type, 2019 to 2034

Table 45: South Asia and Pacific Market Value (US$ Million) Forecast by Application, 2019 to 2034

Table 46: South Asia and Pacific Market Volume (Units) Forecast by Application, 2019 to 2034

Table 47: South Asia and Pacific Market Value (US$ Million) Forecast by End-User Industry, 2019 to 2034

Table 48: South Asia and Pacific Market Volume (Units) Forecast by End-User Industry, 2019 to 2034

Table 49: East Asia Market Value (US$ Million) Forecast by Country, 2019 to 2034

Table 50: East Asia Market Volume (Units) Forecast by Country, 2019 to 2034

Table 51: East Asia Market Value (US$ Million) Forecast by Material Type, 2019 to 2034

Table 52: East Asia Market Volume (Units) Forecast by Material Type, 2019 to 2034

Table 53: East Asia Market Value (US$ Million) Forecast by Application, 2019 to 2034

Table 54: East Asia Market Volume (Units) Forecast by Application, 2019 to 2034

Table 55: East Asia Market Value (US$ Million) Forecast by End-User Industry, 2019 to 2034

Table 56: East Asia Market Volume (Units) Forecast by End-User Industry, 2019 to 2034

Table 57: Middle East and Africa Market Value (US$ Million) Forecast by Country, 2019 to 2034

Table 58: Middle East and Africa Market Volume (Units) Forecast by Country, 2019 to 2034

Table 59: Middle East and Africa Market Value (US$ Million) Forecast by Material Type, 2019 to 2034

Table 60: Middle East and Africa Market Volume (Units) Forecast by Material Type, 2019 to 2034

Table 61: Middle East and Africa Market Value (US$ Million) Forecast by Application, 2019 to 2034

Table 62: Middle East and Africa Market Volume (Units) Forecast by Application, 2019 to 2034

Table 63: Middle East and Africa Market Value (US$ Million) Forecast by End-User Industry, 2019 to 2034

Table 64: Middle East and Africa Market Volume (Units) Forecast by End-User Industry, 2019 to 2034

List of Figures

Figure 1: Global Market Value (US$ Million) by Material Type, 2024 to 2034

Figure 2: Global Market Value (US$ Million) by Application, 2024 to 2034

Figure 3: Global Market Value (US$ Million) by End-User Industry, 2024 to 2034

Figure 4: Global Market Value (US$ Million) by Region, 2024 to 2034

Figure 5: Global Market Value (US$ Million) Analysis by Region, 2019 to 2034

Figure 6: Global Market Volume (Units) Analysis by Region, 2019 to 2034

Figure 7: Global Market Value Share (%) and BPS Analysis by Region, 2024 to 2034

Figure 8: Global Market Y-o-Y Growth (%) Projections by Region, 2024 to 2034

Figure 9: Global Market Value (US$ Million) Analysis by Material Type, 2019 to 2034

Figure 10: Global Market Volume (Units) Analysis by Material Type, 2019 to 2034

Figure 11: Global Market Value Share (%) and BPS Analysis by Material Type, 2024 to 2034

Figure 12: Global Market Y-o-Y Growth (%) Projections by Material Type, 2024 to 2034

Figure 13: Global Market Value (US$ Million) Analysis by Application, 2019 to 2034

Figure 14: Global Market Volume (Units) Analysis by Application, 2019 to 2034

Figure 15: Global Market Value Share (%) and BPS Analysis by Application, 2024 to 2034

Figure 16: Global Market Y-o-Y Growth (%) Projections by Application, 2024 to 2034

Figure 17: Global Market Value (US$ Million) Analysis by End-User Industry, 2019 to 2034

Figure 18: Global Market Volume (Units) Analysis by End-User Industry, 2019 to 2034

Figure 19: Global Market Value Share (%) and BPS Analysis by End-User Industry, 2024 to 2034

Figure 20: Global Market Y-o-Y Growth (%) Projections by End-User Industry, 2024 to 2034

Figure 21: Global Market Attractiveness by Material Type, 2024 to 2034

Figure 22: Global Market Attractiveness by Application, 2024 to 2034

Figure 23: Global Market Attractiveness by End-User Industry, 2024 to 2034

Figure 24: Global Market Attractiveness by Region, 2024 to 2034

Figure 25: North America Market Value (US$ Million) by Material Type, 2024 to 2034

Figure 26: North America Market Value (US$ Million) by Application, 2024 to 2034

Figure 27: North America Market Value (US$ Million) by End-User Industry, 2024 to 2034

Figure 28: North America Market Value (US$ Million) by Country, 2024 to 2034

Figure 29: North America Market Value (US$ Million) Analysis by Country, 2019 to 2034

Figure 30: North America Market Volume (Units) Analysis by Country, 2019 to 2034

Figure 31: North America Market Value Share (%) and BPS Analysis by Country, 2024 to 2034

Figure 32: North America Market Y-o-Y Growth (%) Projections by Country, 2024 to 2034

Figure 33: North America Market Value (US$ Million) Analysis by Material Type, 2019 to 2034

Figure 34: North America Market Volume (Units) Analysis by Material Type, 2019 to 2034

Figure 35: North America Market Value Share (%) and BPS Analysis by Material Type, 2024 to 2034

Figure 36: North America Market Y-o-Y Growth (%) Projections by Material Type, 2024 to 2034

Figure 37: North America Market Value (US$ Million) Analysis by Application, 2019 to 2034

Figure 38: North America Market Volume (Units) Analysis by Application, 2019 to 2034

Figure 39: North America Market Value Share (%) and BPS Analysis by Application, 2024 to 2034

Figure 40: North America Market Y-o-Y Growth (%) Projections by Application, 2024 to 2034

Figure 41: North America Market Value (US$ Million) Analysis by End-User Industry, 2019 to 2034

Figure 42: North America Market Volume (Units) Analysis by End-User Industry, 2019 to 2034

Figure 43: North America Market Value Share (%) and BPS Analysis by End-User Industry, 2024 to 2034

Figure 44: North America Market Y-o-Y Growth (%) Projections by End-User Industry, 2024 to 2034

Figure 45: North America Market Attractiveness by Material Type, 2024 to 2034

Figure 46: North America Market Attractiveness by Application, 2024 to 2034

Figure 47: North America Market Attractiveness by End-User Industry, 2024 to 2034

Figure 48: North America Market Attractiveness by Country, 2024 to 2034

Figure 49: Latin America Market Value (US$ Million) by Material Type, 2024 to 2034

Figure 50: Latin America Market Value (US$ Million) by Application, 2024 to 2034

Figure 51: Latin America Market Value (US$ Million) by End-User Industry, 2024 to 2034

Figure 52: Latin America Market Value (US$ Million) by Country, 2024 to 2034

Figure 53: Latin America Market Value (US$ Million) Analysis by Country, 2019 to 2034

Figure 54: Latin America Market Volume (Units) Analysis by Country, 2019 to 2034

Figure 55: Latin America Market Value Share (%) and BPS Analysis by Country, 2024 to 2034

Figure 56: Latin America Market Y-o-Y Growth (%) Projections by Country, 2024 to 2034

Figure 57: Latin America Market Value (US$ Million) Analysis by Material Type, 2019 to 2034

Figure 58: Latin America Market Volume (Units) Analysis by Material Type, 2019 to 2034

Figure 59: Latin America Market Value Share (%) and BPS Analysis by Material Type, 2024 to 2034

Figure 60: Latin America Market Y-o-Y Growth (%) Projections by Material Type, 2024 to 2034

Figure 61: Latin America Market Value (US$ Million) Analysis by Application, 2019 to 2034

Figure 62: Latin America Market Volume (Units) Analysis by Application, 2019 to 2034

Figure 63: Latin America Market Value Share (%) and BPS Analysis by Application, 2024 to 2034

Figure 64: Latin America Market Y-o-Y Growth (%) Projections by Application, 2024 to 2034

Figure 65: Latin America Market Value (US$ Million) Analysis by End-User Industry, 2019 to 2034

Figure 66: Latin America Market Volume (Units) Analysis by End-User Industry, 2019 to 2034

Figure 67: Latin America Market Value Share (%) and BPS Analysis by End-User Industry, 2024 to 2034

Figure 68: Latin America Market Y-o-Y Growth (%) Projections by End-User Industry, 2024 to 2034

Figure 69: Latin America Market Attractiveness by Material Type, 2024 to 2034

Figure 70: Latin America Market Attractiveness by Application, 2024 to 2034

Figure 71: Latin America Market Attractiveness by End-User Industry, 2024 to 2034

Figure 72: Latin America Market Attractiveness by Country, 2024 to 2034

Figure 73: Western Europe Market Value (US$ Million) by Material Type, 2024 to 2034

Figure 74: Western Europe Market Value (US$ Million) by Application, 2024 to 2034

Figure 75: Western Europe Market Value (US$ Million) by End-User Industry, 2024 to 2034

Figure 76: Western Europe Market Value (US$ Million) by Country, 2024 to 2034

Figure 77: Western Europe Market Value (US$ Million) Analysis by Country, 2019 to 2034

Figure 78: Western Europe Market Volume (Units) Analysis by Country, 2019 to 2034

Figure 79: Western Europe Market Value Share (%) and BPS Analysis by Country, 2024 to 2034

Figure 80: Western Europe Market Y-o-Y Growth (%) Projections by Country, 2024 to 2034

Figure 81: Western Europe Market Value (US$ Million) Analysis by Material Type, 2019 to 2034

Figure 82: Western Europe Market Volume (Units) Analysis by Material Type, 2019 to 2034

Figure 83: Western Europe Market Value Share (%) and BPS Analysis by Material Type, 2024 to 2034

Figure 84: Western Europe Market Y-o-Y Growth (%) Projections by Material Type, 2024 to 2034

Figure 85: Western Europe Market Value (US$ Million) Analysis by Application, 2019 to 2034

Figure 86: Western Europe Market Volume (Units) Analysis by Application, 2019 to 2034

Figure 87: Western Europe Market Value Share (%) and BPS Analysis by Application, 2024 to 2034

Figure 88: Western Europe Market Y-o-Y Growth (%) Projections by Application, 2024 to 2034

Figure 89: Western Europe Market Value (US$ Million) Analysis by End-User Industry, 2019 to 2034

Figure 90: Western Europe Market Volume (Units) Analysis by End-User Industry, 2019 to 2034

Figure 91: Western Europe Market Value Share (%) and BPS Analysis by End-User Industry, 2024 to 2034

Figure 92: Western Europe Market Y-o-Y Growth (%) Projections by End-User Industry, 2024 to 2034

Figure 93: Western Europe Market Attractiveness by Material Type, 2024 to 2034

Figure 94: Western Europe Market Attractiveness by Application, 2024 to 2034

Figure 95: Western Europe Market Attractiveness by End-User Industry, 2024 to 2034

Figure 96: Western Europe Market Attractiveness by Country, 2024 to 2034

Figure 97: Eastern Europe Market Value (US$ Million) by Material Type, 2024 to 2034

Figure 98: Eastern Europe Market Value (US$ Million) by Application, 2024 to 2034

Figure 99: Eastern Europe Market Value (US$ Million) by End-User Industry, 2024 to 2034

Figure 100: Eastern Europe Market Value (US$ Million) by Country, 2024 to 2034

Figure 101: Eastern Europe Market Value (US$ Million) Analysis by Country, 2019 to 2034

Figure 102: Eastern Europe Market Volume (Units) Analysis by Country, 2019 to 2034

Figure 103: Eastern Europe Market Value Share (%) and BPS Analysis by Country, 2024 to 2034

Figure 104: Eastern Europe Market Y-o-Y Growth (%) Projections by Country, 2024 to 2034

Figure 105: Eastern Europe Market Value (US$ Million) Analysis by Material Type, 2019 to 2034

Figure 106: Eastern Europe Market Volume (Units) Analysis by Material Type, 2019 to 2034

Figure 107: Eastern Europe Market Value Share (%) and BPS Analysis by Material Type, 2024 to 2034

Figure 108: Eastern Europe Market Y-o-Y Growth (%) Projections by Material Type, 2024 to 2034

Figure 109: Eastern Europe Market Value (US$ Million) Analysis by Application, 2019 to 2034

Figure 110: Eastern Europe Market Volume (Units) Analysis by Application, 2019 to 2034

Figure 111: Eastern Europe Market Value Share (%) and BPS Analysis by Application, 2024 to 2034

Figure 112: Eastern Europe Market Y-o-Y Growth (%) Projections by Application, 2024 to 2034

Figure 113: Eastern Europe Market Value (US$ Million) Analysis by End-User Industry, 2019 to 2034

Figure 114: Eastern Europe Market Volume (Units) Analysis by End-User Industry, 2019 to 2034

Figure 115: Eastern Europe Market Value Share (%) and BPS Analysis by End-User Industry, 2024 to 2034

Figure 116: Eastern Europe Market Y-o-Y Growth (%) Projections by End-User Industry, 2024 to 2034

Figure 117: Eastern Europe Market Attractiveness by Material Type, 2024 to 2034

Figure 118: Eastern Europe Market Attractiveness by Application, 2024 to 2034

Figure 119: Eastern Europe Market Attractiveness by End-User Industry, 2024 to 2034

Figure 120: Eastern Europe Market Attractiveness by Country, 2024 to 2034

Figure 121: South Asia and Pacific Market Value (US$ Million) by Material Type, 2024 to 2034

Figure 122: South Asia and Pacific Market Value (US$ Million) by Application, 2024 to 2034

Figure 123: South Asia and Pacific Market Value (US$ Million) by End-User Industry, 2024 to 2034

Figure 124: South Asia and Pacific Market Value (US$ Million) by Country, 2024 to 2034

Figure 125: South Asia and Pacific Market Value (US$ Million) Analysis by Country, 2019 to 2034

Figure 126: South Asia and Pacific Market Volume (Units) Analysis by Country, 2019 to 2034

Figure 127: South Asia and Pacific Market Value Share (%) and BPS Analysis by Country, 2024 to 2034

Figure 128: South Asia and Pacific Market Y-o-Y Growth (%) Projections by Country, 2024 to 2034

Figure 129: South Asia and Pacific Market Value (US$ Million) Analysis by Material Type, 2019 to 2034

Figure 130: South Asia and Pacific Market Volume (Units) Analysis by Material Type, 2019 to 2034

Figure 131: South Asia and Pacific Market Value Share (%) and BPS Analysis by Material Type, 2024 to 2034

Figure 132: South Asia and Pacific Market Y-o-Y Growth (%) Projections by Material Type, 2024 to 2034

Figure 133: South Asia and Pacific Market Value (US$ Million) Analysis by Application, 2019 to 2034

Figure 134: South Asia and Pacific Market Volume (Units) Analysis by Application, 2019 to 2034

Figure 135: South Asia and Pacific Market Value Share (%) and BPS Analysis by Application, 2024 to 2034

Figure 136: South Asia and Pacific Market Y-o-Y Growth (%) Projections by Application, 2024 to 2034

Figure 137: South Asia and Pacific Market Value (US$ Million) Analysis by End-User Industry, 2019 to 2034

Figure 138: South Asia and Pacific Market Volume (Units) Analysis by End-User Industry, 2019 to 2034

Figure 139: South Asia and Pacific Market Value Share (%) and BPS Analysis by End-User Industry, 2024 to 2034

Figure 140: South Asia and Pacific Market Y-o-Y Growth (%) Projections by End-User Industry, 2024 to 2034

Figure 141: South Asia and Pacific Market Attractiveness by Material Type, 2024 to 2034

Figure 142: South Asia and Pacific Market Attractiveness by Application, 2024 to 2034

Figure 143: South Asia and Pacific Market Attractiveness by End-User Industry, 2024 to 2034

Figure 144: South Asia and Pacific Market Attractiveness by Country, 2024 to 2034

Figure 145: East Asia Market Value (US$ Million) by Material Type, 2024 to 2034

Figure 146: East Asia Market Value (US$ Million) by Application, 2024 to 2034

Figure 147: East Asia Market Value (US$ Million) by End-User Industry, 2024 to 2034

Figure 148: East Asia Market Value (US$ Million) by Country, 2024 to 2034

Figure 149: East Asia Market Value (US$ Million) Analysis by Country, 2019 to 2034

Figure 150: East Asia Market Volume (Units) Analysis by Country, 2019 to 2034

Figure 151: East Asia Market Value Share (%) and BPS Analysis by Country, 2024 to 2034

Figure 152: East Asia Market Y-o-Y Growth (%) Projections by Country, 2024 to 2034

Figure 153: East Asia Market Value (US$ Million) Analysis by Material Type, 2019 to 2034

Figure 154: East Asia Market Volume (Units) Analysis by Material Type, 2019 to 2034

Figure 155: East Asia Market Value Share (%) and BPS Analysis by Material Type, 2024 to 2034

Figure 156: East Asia Market Y-o-Y Growth (%) Projections by Material Type, 2024 to 2034

Figure 157: East Asia Market Value (US$ Million) Analysis by Application, 2019 to 2034

Figure 158: East Asia Market Volume (Units) Analysis by Application, 2019 to 2034

Figure 159: East Asia Market Value Share (%) and BPS Analysis by Application, 2024 to 2034

Figure 160: East Asia Market Y-o-Y Growth (%) Projections by Application, 2024 to 2034

Figure 161: East Asia Market Value (US$ Million) Analysis by End-User Industry, 2019 to 2034

Figure 162: East Asia Market Volume (Units) Analysis by End-User Industry, 2019 to 2034

Figure 163: East Asia Market Value Share (%) and BPS Analysis by End-User Industry, 2024 to 2034

Figure 164: East Asia Market Y-o-Y Growth (%) Projections by End-User Industry, 2024 to 2034

Figure 165: East Asia Market Attractiveness by Material Type, 2024 to 2034

Figure 166: East Asia Market Attractiveness by Application, 2024 to 2034

Figure 167: East Asia Market Attractiveness by End-User Industry, 2024 to 2034

Figure 168: East Asia Market Attractiveness by Country, 2024 to 2034

Figure 169: Middle East and Africa Market Value (US$ Million) by Material Type, 2024 to 2034

Figure 170: Middle East and Africa Market Value (US$ Million) by Application, 2024 to 2034

Figure 171: Middle East and Africa Market Value (US$ Million) by End-User Industry, 2024 to 2034

Figure 172: Middle East and Africa Market Value (US$ Million) by Country, 2024 to 2034

Figure 173: Middle East and Africa Market Value (US$ Million) Analysis by Country, 2019 to 2034

Figure 174: Middle East and Africa Market Volume (Units) Analysis by Country, 2019 to 2034

Figure 175: Middle East and Africa Market Value Share (%) and BPS Analysis by Country, 2024 to 2034

Figure 176: Middle East and Africa Market Y-o-Y Growth (%) Projections by Country, 2024 to 2034

Figure 177: Middle East and Africa Market Value (US$ Million) Analysis by Material Type, 2019 to 2034

Figure 178: Middle East and Africa Market Volume (Units) Analysis by Material Type, 2019 to 2034

Figure 179: Middle East and Africa Market Value Share (%) and BPS Analysis by Material Type, 2024 to 2034

Figure 180: Middle East and Africa Market Y-o-Y Growth (%) Projections by Material Type, 2024 to 2034

Figure 181: Middle East and Africa Market Value (US$ Million) Analysis by Application, 2019 to 2034

Figure 182: Middle East and Africa Market Volume (Units) Analysis by Application, 2019 to 2034

Figure 183: Middle East and Africa Market Value Share (%) and BPS Analysis by Application, 2024 to 2034

Figure 184: Middle East and Africa Market Y-o-Y Growth (%) Projections by Application, 2024 to 2034

Figure 185: Middle East and Africa Market Value (US$ Million) Analysis by End-User Industry, 2019 to 2034

Figure 186: Middle East and Africa Market Volume (Units) Analysis by End-User Industry, 2019 to 2034

Figure 187: Middle East and Africa Market Value Share (%) and BPS Analysis by End-User Industry, 2024 to 2034

Figure 188: Middle East and Africa Market Y-o-Y Growth (%) Projections by End-User Industry, 2024 to 2034

Figure 189: Middle East and Africa Market Attractiveness by Material Type, 2024 to 2034

Figure 190: Middle East and Africa Market Attractiveness by Application, 2024 to 2034

Figure 191: Middle East and Africa Market Attractiveness by End-User Industry, 2024 to 2034

Figure 192: Middle East and Africa Market Attractiveness by Country, 2024 to 2034

Frequently Asked Questions

How Big is the Dehydrating Breather Market Currently?

The market is estimated to be valued at US$ 487.5 million in 2024.

What is the Growth Outlook of the Dehydrating Breather Market?

The market is on track to develop at a CAGR of 3.8% during the forecast period.

What is the projected Value of Dehydrating Breather Market by 2034?

The market is forecasted to be valued at US$ 711.2 million by 2034.

What was the Historical Size of the Dehydrating Breather Market?

The market was valued at US$ 372 million in 2019 and US$ 465.2 million in 2023.

Which Country Dominates the Global Dehydrating Breather Market?

The United States dominates the market and is projected to retain its dominance, registering a 4.2% CAGR through 2034.

Which Regional Dehydrating Breather Market has the Highest Growth Potential?

South Korea is estimated to witness a CAGR of 5.6% in sales of dehydrating breathers through 2034.

Explore Similar Insights

Future Market Insights

Dehydrating Breather Market