eSIM Subscription Market Outlook (2023 to 2033)

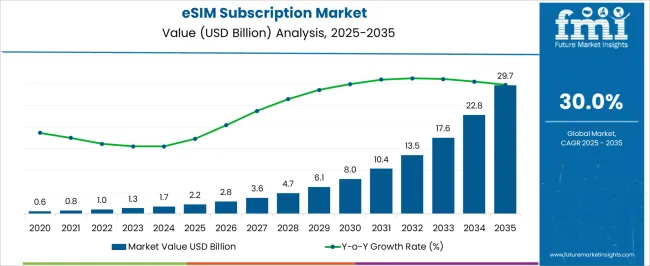
With a projected CAGR of 30% from 2023 to 2033, the global eSIM subscription market is poised to initiate a new era of telecommunication services and smart gadgets. As per the eSIM subscription market analysis report released by FMI, the net worth of the market is expected to grow from its 2023 valuation of US$ 980 Million to US$ 13,510 Million by 2033.

It is predicted that eSIM would completely change how consumer goods and gadgets are used. Given the numerous benefits made available by the execution of eSIM subscription in smart devices, which include relatively simple device setup instead of having to incorporate or switch a physical SIM card, enhanced reliability and privacy, sleek design for an elegant look, and most importantly eliminating the necessity of a connector,

Smartphone manufacturers are gradually incorporating eSIM since it takes up less space as they attempt to develop somewhat slimmer cell phones. For this reason, it is also anticipated that eSIM would revolutionize several other consumer electronics devices which can be inferred from the growing popularity of Samsung galaxy watch eSIM subscriptions. Among the benefits driving the adoption of eSIM subscriptions in consumer electronic applications to include high dependability, greater safety, and enhanced connectivity.

As per this market report, in the course of the next five years, over five billion eSIM phones are predicted to be delivered worldwide. Furthermore, eSIM subscription support is anticipated to be available in 25% to 30% of devices in the near future, as said by a renowned digital solutions company Giesecke + Devrient (G&D) of Germany.

The growth and demand for eSIM subscriptions were constrained by poor compatibility and high costs associated with eSIM 4G services. Likewise, the higher price of android phones with eSIM even in comparison to dual SIM iPhone 12 is another challenge for the eSIM subscription market expansion. Moreover, a majority of service providers charge exorbitantly high for switching out of a physical SIM card to avail of a prepaid eSIM service, leaving many potential consumers uninterested.

Attributes Details
eSIM Subscription Market Share (2023) US$ 748 Million
eSIM Subscription Market Size Value (2023) US$ 980 Million
eSIM Subscription Market Size Value (2033) US$ 13,510 Million
eSIM Subscription Market Growth Rate (2023 to 2033) 30%

Don't pay for what you don't need

Customize your report by selecting specific countries or regions and save 30%!

Market Opportunities for eSIM Subscription Providers are Growing Exponentially

The eSIM business model is intricate and involves a number of partners. Stakeholders must coordinate and collaborate to set standards for economies of scale, connectivity, and IoT technologies, such as M2M interactions and universal cellular networks, in order to integrate embedded SIMs over a wide range of goods successfully. So many International bodies, such as the European ETSI and the GSMA, are concentrating on developing standards on both technical and operational facets to address this issue that is poised to further augment the market and adoption of eSIM subscriptions. Mobile Network Operators (MNOs) are also nowadays offering eSIM for international travel to securely regulate end-user cellular subscriptions from a distance.

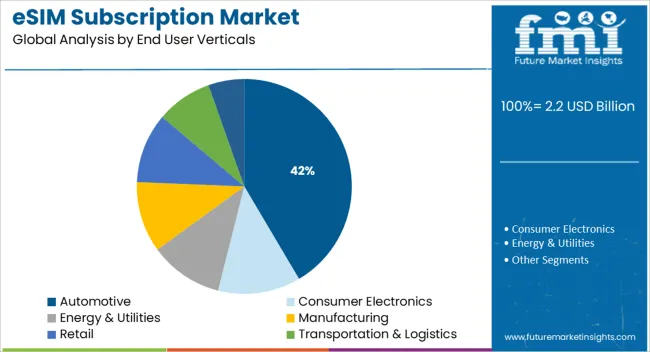
Additionally, the demand for eSIM subscriptions in the automobile sector following the concept of linked cars is emerging as a new opportunity for the market players. The use of online eSIM in the automotive sector is anticipated to greatly simplify maneuvering and obtaining real-time data ultimately promoting the growth of the eSIM subscription numbers.

Other than that, the growing competition among market leaders in order to provide internet services at a reasonable price, they have begun to spend extensively in the eSIM data-only services category. This, in turn, is projected to further boost the eSIM subscription market opportunities in the coming days.
Category-wise Insights

eSIM Subscriptions for Mobile to Mobile Applications is the Major Focus of Present Day Market Players

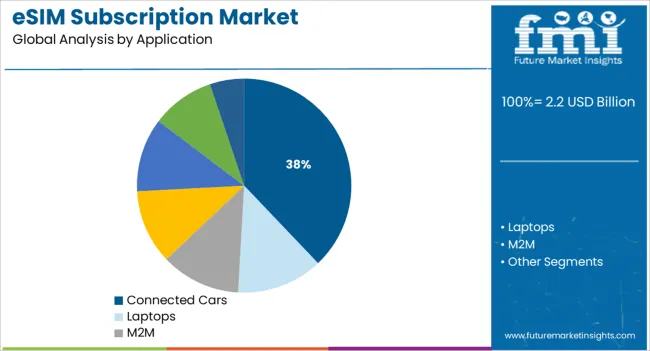
The M2M eSIM subscription category made up 50% of the overall market share in 2022 and is anticipated to register an impressive CAGR of 9.7% during the forecast years. This segment is growing as a result of the expanding usage of eSIM digital technology in the automotive sector for M2M communication in smart cities.

Contrarily, during the course of the forecast years, the consumer electronics market segment is anticipated to register the highest CAGR of 12%. This application segment continues to be one of the key factors influencing growth, expansion, and revolution in a number of technological areas.

Connectivity Solution Remains the Crucial Factor for Global eSIM Subscription Market Growth

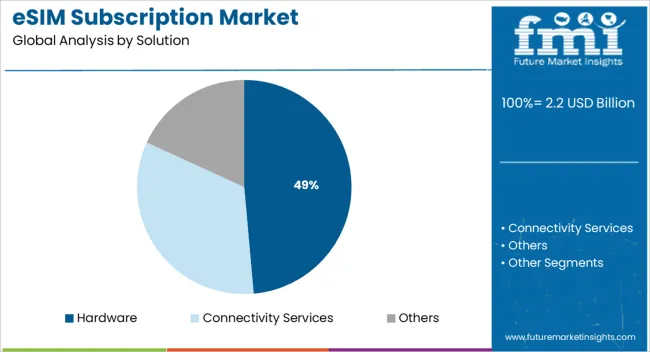
The connectivity solution segment, which led the market during the previous surveyed years, is anticipated to grow at the same pace throughout the forecast years as well. The increased usage of eSIM for M2M connections, which is anticipated to generate revenue for telecom companies through subscription services, can be regarded as the major cause of this rapid rise.

Until now, a very small number of eSIM chipset manufacturers, including NXP Semiconductors, STMicroelectronics, and Infineon Technologies AG, control a sizable portion of the hardware segment's income.

Sudip Saha
Sudip Saha

Principal Consultant

Talk to Analyst

Find your sweet spots for generating winning opportunities in this market.

Comparative View of Adjacent Cheese Market

eSIM Subscription Market:

Attributes eSIM Subscription Market
CAGR (2023 to 2033) 30%
Market Value (2023) US$ 980 Million
Growth Factor Growing emphasis on remote SIM provisioning for M2M connectivity, and supportive governmental policies for it.
Future Opportunities Wide application and use of IoT technology devices at homes as well as industries to increase the demand for eSIM subscription services.
Market Trends Market players are mostly concentrating on creating cutting-edge, economical technology and solutions to enhance the user experience and create brand value.

Near Field Communication Market:

Attributes Near Field Communication Market
CAGR (2023 to 2033) 14%
Market Value (2023) US$ 25 Billion
Growth Factor The growing use of smartphones and portable pay terminals across all economies at e-commerce platforms as well as retail shops.
Future Opportunities Increased government spending on the development of smart devices and reliable pay channels for fee collection and general purposes.
Market Trends Industry players are largely concentrating on establishing long-term partnerships with suitable telecom service providers to make their products acceptable in a wide range of applications.

IoT Microcontroller Market:

Attributes IoT Microcontroller Market
CAGR (2023 to 2033) 12.5%
Market Value (2023) US$ 5.6 Billion
Growth Factor The rising popularity of smart home device usage coupled with improvements in low power Microcontroller (MCU) technology.
Future Opportunities The proliferation of industrial as well as commercial IoT connections across several sectors including the newly industrializing economies.
Market Trends Europe and North America regional market players are driving the market by revolutionizing the concepts like big data analytics, AI, robotics, etc.

Country-wise Insights

North America and European Countries are the first to use the eSIM digital technology.
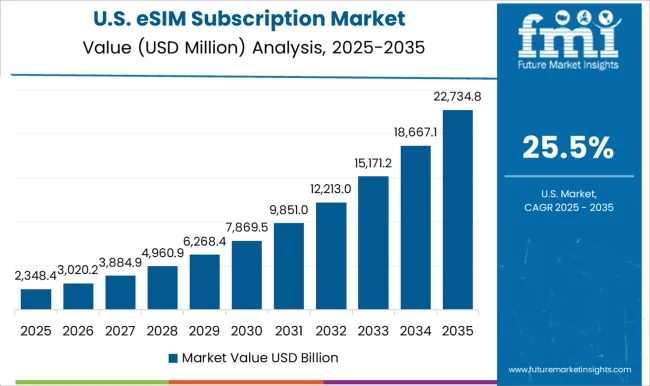
The USA Still Leads the eSIM Technology and its Market Trends

As per the recently released market survey reports, by registering the fastest CAGR in the last decade, the USA eSIM subscription market held the leading position in comparison to other countries. According to the records, it contributes to almost 40% of the global market revenue in the present year 2023. This rise can be attributed to the country's rapid technical improvements and the widespread presence of wireless carriers.
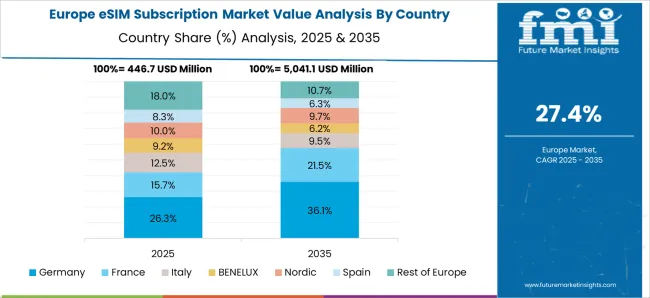
Europe has already got a Well Established eSIM Subscription Market

By the virtue of the presence of many significant original equipment manufacturers, including Giesecke & Devrient Mobile Security GmbH, STMicroelectronics, NXP Semiconductors N.V., and others, Europe, with a market value of US$2,070.3 in 2021, is expected to continue as a leading region for the eSIM subscription. Moreover, the Eurolink prepaid regional eSIM services are quite popular in European countries constituting a significant portion of the studied market.

China Emerging as the Dominant Player in the Global eSIM Subscription Market

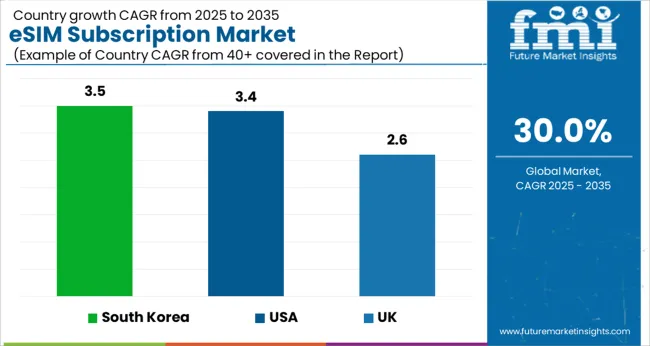
The greatest CAGR is anticipated for the eSIM subscription market in APAC mostly between 2022 and 2028. As the rate of smartphone adoption is increasing gradually in this area, and it is clear that three of the top five smartphone user base nations worldwide, including Australia, Singapore, and South Korea, are located in APAC, China's eSIM subscription market would emerge as the top country.

Throughout the projected period, the China eSIM subscription Market is anticipated to register a CAGR of 8.5% and emerge as a lucrative market for global players. Leading smartphone manufacturers in the country like Huawei and OnePlus Electronics have introduced eSIM mobile phones, gaining traction in the eSIM subscription business and establishing eSIM as the standard SIM technology in adjacent countries as well.

India is turning out to be a Very Attractive Option for Global eSIM Subscription Service Providers

In present times, a number of OEMs are creating eSIM solutions and assembling collaborative development teams from across the landscape in nations like China and India in order to forge strong demand for eSIM subscriptions. The international player IDEMIA has also recently constructed a new facility in India, which is anticipated to enhance the adoption of eSIM for travel purposes by denizens and international tourists.

This country has also witnessed a sharp rise in the use of linked smart gadgets and vehicles in the last two decades. Moreover, with the recent boom in providing digital services by telecom operators, the unlimited data eSIM is getting popular and is anticipated to boost the eSIM subscription market trends and opportunities as a result of all these variables.
Get the data you need at a Fraction of the cost

Personalize your report by choosing insights you need
and save 40%!

Competitive Landscape

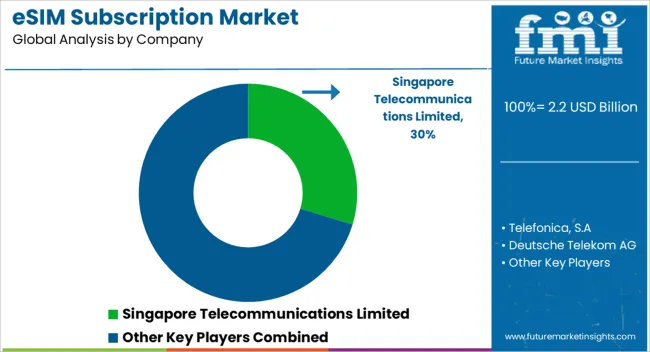
The eSIM subscription market study report by FMI Research indicates that G+D and Thales are at the present years continue to be the leading players in the global market. They also lead in a lot of key metrics, including OS, portability, and privacy that have surfaced as major concerns besides price and service for consumers in the present times. As per the market survey reports, almost 35% of all eSIM for Samsung watch wearables, as well as over a million eSIM phones and tablets, are enabled by Giesecke+Devrient Mobile Security GmbH.

However, recently entered market participants like IDEMIA have taken the lead and offer extensive eSIM enabling capabilities along with its own embedded secure products of eUICC and iUICC operating systems, as well as by creating products for its users such as automotive, and IoT applications. Since a lot of businesses are concentrating on the creation of cutting-edge, and economical solutions and technology, it is projected that the rivalry between eSIM subscription market players is anticipated to become even fiercer in the coming days.

Another of the firms advancing the strongest within the eSIM subscription market space is Kigen, which is now placed fourth by the market statistics reports. In particular, it tops the ranking in terms of firmware, adherence & compliance, and privacy protection. Other than that, Dark horses Truphone, VALID and Oasis Smart SIM, Workz, and RedTea Mobile are some of the new eSIM subscription market participants that are well-positioned too to build on their strengths and compete with the market's top players.

Key Players Profiled in the eSIM Subscription Market Report

  • Infineon Technologies AG.
  • NXP Semiconductors N.V.
  • STMicroelectronics
  • Deutsche Telekom AG
  • Giesecke+Devrient Mobile Security GmbH
  • Gemalto NV
  • ARM Holdings

Key Segments

By Solution:

  • Hardware
  • Connectivity Services
  • Others

By Application:

  • Connected Cars
  • Laptops
  • M2M
  • Smartphones
  • Tablets
  • Wearables
  • Others (Drones, Smart Meters, Smart Grids)

By End User Verticals:

  • Automotive
  • Consumer Electronics
  • Energy & Utilities
  • Manufacturing
  • Retail
  • Transportation & Logistics
  • Others

By Region:

  • North America
  • Latin America
  • Europe
  • Asia Pacific
  • Middle East and Africa (MEA)

Frequently Asked Questions

What is the Growth Outlook of the eSIM Subscription Market?

The global eSIM subscription market is to grow at a CAGR of 30% during the forecast period.

What is the projected Value of eSIM Subscription Market By 2032?

The global eSIM subscription market is predicted to be valued at US$ 13,510 Million by 2033.

What was the Historical Size of the eSIM Subscription Market?

The global eSIM subscription market was valued at US$ 748 Million in 2023.

Which Country is the largest Share Holder in the eSIM Subscription Market?

The USA accounts for the largest revenue share of the eSIM subscription market.

Which Country has the Highest Growth Potential in the eSIM Subscription Market?

China is predicted to witness the highest CAGR of 8.5% in the eSIM subscription market.

Table of Content
1. Executive Summary | eSIM Subscription Market

    1.1. Global Market Outlook

    1.2. Demand-side Trends

    1.3. Supply-side Trends

    1.4. Technology Roadmap Analysis

    1.5. Analysis and Recommendations

2. Market Overview

    2.1. Market Coverage / Taxonomy

    2.2. Market Definition / Scope / Limitations

3. Market Background

    3.1. Market Dynamics

        3.1.1. Drivers

        3.1.2. Restraints

        3.1.3. Opportunity

        3.1.4. Trends

    3.2. Scenario Forecast

        3.2.1. Demand in Optimistic Scenario

        3.2.2. Demand in Likely Scenario

        3.2.3. Demand in Conservative Scenario

    3.3. Opportunity Map Analysis

    3.4. Investment Feasibility Matrix

    3.5. PESTLE and Porter’s Analysis

    3.6. Regulatory Landscape

        3.6.1. By Key Regions

        3.6.2. By Key Countries

    3.7. Regional Parent Market Outlook

4. Global Market Analysis 2017 to 2021 and Forecast, 2022 to 2032

    4.1. Historical Market Size Value (US$ Million) Analysis, 2017 to 2021

    4.2. Current and Future Market Size Value (US$ Million) Projections, 2022 to 2032

        4.2.1. Y-o-Y Growth Trend Analysis

        4.2.2. Absolute $ Opportunity Analysis

5. Global Market Analysis 2017 to 2021 and Forecast 2022 to 2032, By Vertical

    5.1. Introduction / Key Findings

    5.2. Historical Market Size Value (US$ Million) Analysis By Vertical, 2017 to 2021

    5.3. Current and Future Market Size Value (US$ Million) Analysis and Forecast By Vertical, 2022 to 2032

        5.3.1. Manufacturing

        5.3.2. Consumer Electronics

        5.3.3. Energy and Utilities

    5.4. Y-o-Y Growth Trend Analysis By Vertical, 2017 to 2021

    5.5. Absolute $ Opportunity Analysis By Vertical, 2022 to 2032

6. Global Market Analysis 2017 to 2021 and Forecast 2022 to 2032, By Component

    6.1. Introduction / Key Findings

    6.2. Historical Market Size Value (US$ Million) Analysis By Component, 2017 to 2021

    6.3. Current and Future Market Size Value (US$ Million) Analysis and Forecast By Component, 2022 to 2032

        6.3.1. Hardware

        6.3.2. Connectivity Services

    6.4. Y-o-Y Growth Trend Analysis By Component, 2017 to 2021

    6.5. Absolute $ Opportunity Analysis By Component, 2022 to 2032

7. Global Market Analysis 2017 to 2021 and Forecast 2022 to 2032, By Application

    7.1. Introduction / Key Findings

    7.2. Historical Market Size Value (US$ Million) Analysis By Application, 2017 to 2021

    7.3. Current and Future Market Size Value (US$ Million) Analysis and Forecast By Application, 2022 to 2032

        7.3.1. Smartphones

        7.3.2. Connected Cars

        7.3.3. M2M

        7.3.4. Laptops

    7.4. Y-o-Y Growth Trend Analysis By Application, 2017 to 2021

    7.5. Absolute $ Opportunity Analysis By Application, 2022 to 2032

8. Global Market Analysis 2017 to 2021 and Forecast 2022 to 2032, By Region

    8.1. Introduction

    8.2. Historical Market Size Value (US$ Million) Analysis By Region, 2017 to 2021

    8.3. Current Market Size Value (US$ Million) Analysis and Forecast By Region, 2022 to 2032

        8.3.1. North America

        8.3.2. Latin America

        8.3.3. Europe

        8.3.4. South Asia

        8.3.5. East Asia

        8.3.6. Oceania

        8.3.7. Middle East and Africa(MEA)

    8.4. Market Attractiveness Analysis By Region

9. North America Market Analysis 2017 to 2021 and Forecast 2022 to 2032, By Country

    9.1. Historical Market Size Value (US$ Million) Trend Analysis By Market Taxonomy, 2017 to 2021

    9.2. Market Size Value (US$ Million) Forecast By Market Taxonomy, 2022 to 2032

        9.2.1. By Country

            9.2.1.1. USA

            9.2.1.2. Canada

        9.2.2. By Vertical

        9.2.3. By Component

        9.2.4. By Application

    9.3. Market Attractiveness Analysis

        9.3.1. By Country

        9.3.2. By Vertical

        9.3.3. By Component

        9.3.4. By Application

    9.4. Key Takeaways

10. Latin America Market Analysis 2017 to 2021 and Forecast 2022 to 2032, By Country

    10.1. Historical Market Size Value (US$ Million) Trend Analysis By Market Taxonomy, 2017 to 2021

    10.2. Market Size Value (US$ Million) Forecast By Market Taxonomy, 2022 to 2032

        10.2.1. By Country

            10.2.1.1. Brazil

            10.2.1.2. Mexico

            10.2.1.3. Rest of Latin America

        10.2.2. By Vertical

        10.2.3. By Component

        10.2.4. By Application

    10.3. Market Attractiveness Analysis

        10.3.1. By Country

        10.3.2. By Vertical

        10.3.3. By Component

        10.3.4. By Application

    10.4. Key Takeaways

11. Europe Market Analysis 2017 to 2021 and Forecast 2022 to 2032, By Country

    11.1. Historical Market Size Value (US$ Million) Trend Analysis By Market Taxonomy, 2017 to 2021

    11.2. Market Size Value (US$ Million) Forecast By Market Taxonomy, 2022 to 2032

        11.2.1. By Country

            11.2.1.1. Germany

            11.2.1.2. United Kingdom

            11.2.1.3. France

            11.2.1.4. Spain

            11.2.1.5. Italy

            11.2.1.6. Rest of Europe

        11.2.2. By Vertical

        11.2.3. By Component

        11.2.4. By Application

    11.3. Market Attractiveness Analysis

        11.3.1. By Country

        11.3.2. By Vertical

        11.3.3. By Component

        11.3.4. By Application

    11.4. Key Takeaways

12. South Asia Market Analysis 2017 to 2021 and Forecast 2022 to 2032, By Country

    12.1. Historical Market Size Value (US$ Million) Trend Analysis By Market Taxonomy, 2017 to 2021

    12.2. Market Size Value (US$ Million) Forecast By Market Taxonomy, 2022 to 2032

        12.2.1. By Country

            12.2.1.1. India

            12.2.1.2. Malaysia

            12.2.1.3. Singapore

            12.2.1.4. Thailand

            12.2.1.5. Rest of South Asia

        12.2.2. By Vertical

        12.2.3. By Component

        12.2.4. By Application

    12.3. Market Attractiveness Analysis

        12.3.1. By Country

        12.3.2. By Vertical

        12.3.3. By Component

        12.3.4. By Application

    12.4. Key Takeaways

13. East Asia Market Analysis 2017 to 2021 and Forecast 2022 to 2032, By Country

    13.1. Historical Market Size Value (US$ Million) Trend Analysis By Market Taxonomy, 2017 to 2021

    13.2. Market Size Value (US$ Million) Forecast By Market Taxonomy, 2022 to 2032

        13.2.1. By Country

            13.2.1.1. China

            13.2.1.2. Japan

            13.2.1.3. South Korea

        13.2.2. By Vertical

        13.2.3. By Component

        13.2.4. By Application

    13.3. Market Attractiveness Analysis

        13.3.1. By Country

        13.3.2. By Vertical

        13.3.3. By Component

        13.3.4. By Application

    13.4. Key Takeaways

14. Oceania Market Analysis 2017 to 2021 and Forecast 2022 to 2032, By Country

    14.1. Historical Market Size Value (US$ Million) Trend Analysis By Market Taxonomy, 2017 to 2021

    14.2. Market Size Value (US$ Million) Forecast By Market Taxonomy, 2022 to 2032

        14.2.1. By Country

            14.2.1.1. Australia

            14.2.1.2. New Zealand

        14.2.2. By Vertical

        14.2.3. By Component

        14.2.4. By Application

    14.3. Market Attractiveness Analysis

        14.3.1. By Country

        14.3.2. By Vertical

        14.3.3. By Component

        14.3.4. By Application

    14.4. Key Takeaways

15. MEA Market Analysis 2017 to 2021 and Forecast 2022 to 2032, By Country

    15.1. Historical Market Size Value (US$ Million) Trend Analysis By Market Taxonomy, 2017 to 2021

    15.2. Market Size Value (US$ Million) Forecast By Market Taxonomy, 2022 to 2032

        15.2.1. By Country

            15.2.1.1. GCC Countries

            15.2.1.2. South Africa

            15.2.1.3. Israel

            15.2.1.4. Rest of Middle East and Africa(MEA)

        15.2.2. By Vertical

        15.2.3. By Component

        15.2.4. By Application

    15.3. Market Attractiveness Analysis

        15.3.1. By Country

        15.3.2. By Vertical

        15.3.3. By Component

        15.3.4. By Application

    15.4. Key Takeaways

16. Key Countries Market Analysis

    16.1. USA

        16.1.1. Pricing Analysis

        16.1.2. Market Share Analysis, 2021

            16.1.2.1. By Vertical

            16.1.2.2. By Component

            16.1.2.3. By Application

    16.2. Canada

        16.2.1. Pricing Analysis

        16.2.2. Market Share Analysis, 2021

            16.2.2.1. By Vertical

            16.2.2.2. By Component

            16.2.2.3. By Application

    16.3. Brazil

        16.3.1. Pricing Analysis

        16.3.2. Market Share Analysis, 2021

            16.3.2.1. By Vertical

            16.3.2.2. By Component

            16.3.2.3. By Application

    16.4. Mexico

        16.4.1. Pricing Analysis

        16.4.2. Market Share Analysis, 2021

            16.4.2.1. By Vertical

            16.4.2.2. By Component

            16.4.2.3. By Application

    16.5. Germany

        16.5.1. Pricing Analysis

        16.5.2. Market Share Analysis, 2021

            16.5.2.1. By Vertical

            16.5.2.2. By Component

            16.5.2.3. By Application

    16.6. United Kingdom

        16.6.1. Pricing Analysis

        16.6.2. Market Share Analysis, 2021

            16.6.2.1. By Vertical

            16.6.2.2. By Component

            16.6.2.3. By Application

    16.7. France

        16.7.1. Pricing Analysis

        16.7.2. Market Share Analysis, 2021

            16.7.2.1. By Vertical

            16.7.2.2. By Component

            16.7.2.3. By Application

    16.8. Spain

        16.8.1. Pricing Analysis

        16.8.2. Market Share Analysis, 2021

            16.8.2.1. By Vertical

            16.8.2.2. By Component

            16.8.2.3. By Application

    16.9. Italy

        16.9.1. Pricing Analysis

        16.9.2. Market Share Analysis, 2021

            16.9.2.1. By Vertical

            16.9.2.2. By Component

            16.9.2.3. By Application

    16.10. India

        16.10.1. Pricing Analysis

        16.10.2. Market Share Analysis, 2021

            16.10.2.1. By Vertical

            16.10.2.2. By Component

            16.10.2.3. By Application

    16.11. Malaysia

        16.11.1. Pricing Analysis

        16.11.2. Market Share Analysis, 2021

            16.11.2.1. By Vertical

            16.11.2.2. By Component

            16.11.2.3. By Application

    16.12. Singapore

        16.12.1. Pricing Analysis

        16.12.2. Market Share Analysis, 2021

            16.12.2.1. By Vertical

            16.12.2.2. By Component

            16.12.2.3. By Application

    16.13. Thailand

        16.13.1. Pricing Analysis

        16.13.2. Market Share Analysis, 2021

            16.13.2.1. By Vertical

            16.13.2.2. By Component

            16.13.2.3. By Application

    16.14. China

        16.14.1. Pricing Analysis

        16.14.2. Market Share Analysis, 2021

            16.14.2.1. By Vertical

            16.14.2.2. By Component

            16.14.2.3. By Application

    16.15. Japan

        16.15.1. Pricing Analysis

        16.15.2. Market Share Analysis, 2021

            16.15.2.1. By Vertical

            16.15.2.2. By Component

            16.15.2.3. By Application

    16.16. South Korea

        16.16.1. Pricing Analysis

        16.16.2. Market Share Analysis, 2021

            16.16.2.1. By Vertical

            16.16.2.2. By Component

            16.16.2.3. By Application

    16.17. Australia

        16.17.1. Pricing Analysis

        16.17.2. Market Share Analysis, 2021

            16.17.2.1. By Vertical

            16.17.2.2. By Component

            16.17.2.3. By Application

    16.18. New Zealand

        16.18.1. Pricing Analysis

        16.18.2. Market Share Analysis, 2021

            16.18.2.1. By Vertical

            16.18.2.2. By Component

            16.18.2.3. By Application

    16.19. GCC Countries

        16.19.1. Pricing Analysis

        16.19.2. Market Share Analysis, 2021

            16.19.2.1. By Vertical

            16.19.2.2. By Component

            16.19.2.3. By Application

    16.20. South Africa

        16.20.1. Pricing Analysis

        16.20.2. Market Share Analysis, 2021

            16.20.2.1. By Vertical

            16.20.2.2. By Component

            16.20.2.3. By Application

    16.21. Israel

        16.21.1. Pricing Analysis

        16.21.2. Market Share Analysis, 2021

            16.21.2.1. By Vertical

            16.21.2.2. By Component

            16.21.2.3. By Application

17. Market Structure Analysis

    17.1. Competition Dashboard

    17.2. Competition Benchmarking

    17.3. Market Share Analysis of Top Players

        17.3.1. By Regional

        17.3.2. By Vertical

        17.3.3. By Component

        17.3.4. By Application

18. Competition Analysis

    18.1. Competition Deep Dive

        18.1.1. Singapore Telecommunications Limited

            18.1.1.1. Overview

            18.1.1.2. Product Portfolio

            18.1.1.3. Profitability by Market Segments

            18.1.1.4. Sales Footprint

            18.1.1.5. Strategy Overview

                18.1.1.5.1. Marketing Strategy

        18.1.2. Telefonica, S.A

            18.1.2.1. Overview

            18.1.2.2. Product Portfolio

            18.1.2.3. Profitability by Market Segments

            18.1.2.4. Sales Footprint

            18.1.2.5. Strategy Overview

                18.1.2.5.1. Marketing Strategy

        18.1.3. Deutsche Telekom AG

            18.1.3.1. Overview

            18.1.3.2. Product Portfolio

            18.1.3.3. Profitability by Market Segments

            18.1.3.4. Sales Footprint

            18.1.3.5. Strategy Overview

                18.1.3.5.1. Marketing Strategy

        18.1.4. NTT DOCOMO INC

            18.1.4.1. Overview

            18.1.4.2. Product Portfolio

            18.1.4.3. Profitability by Market Segments

            18.1.4.4. Sales Footprint

            18.1.4.5. Strategy Overview

                18.1.4.5.1. Marketing Strategy

        18.1.5. Giesecke & Devrient GmbH

            18.1.5.1. Overview

            18.1.5.2. Product Portfolio

            18.1.5.3. Profitability by Market Segments

            18.1.5.4. Sales Footprint

            18.1.5.5. Strategy Overview

                18.1.5.5.1. Marketing Strategy

        18.1.6. STMicroelectronics 

            18.1.6.1. Overview

            18.1.6.2. Product Portfolio

            18.1.6.3. Profitability by Market Segments

            18.1.6.4. Sales Footprint

            18.1.6.5. Strategy Overview

                18.1.6.5.1. Marketing Strategy

        18.1.7. Infineon Technologies AG

            18.1.7.1. Overview

            18.1.7.2. Product Portfolio

            18.1.7.3. Profitability by Market Segments

            18.1.7.4. Sales Footprint

            18.1.7.5. Strategy Overview

                18.1.7.5.1. Marketing Strategy

        18.1.8. NXP Semiconductors N.V

            18.1.8.1. Overview

            18.1.8.2. Product Portfolio

            18.1.8.3. Profitability by Market Segments

            18.1.8.4. Sales Footprint

            18.1.8.5. Strategy Overview

                18.1.8.5.1. Marketing Strategy

        18.1.9. Gemalto NV

            18.1.9.1. Overview

            18.1.9.2. Product Portfolio

            18.1.9.3. Profitability by Market Segments

            18.1.9.4. Sales Footprint

            18.1.9.5. Strategy Overview

                18.1.9.5.1. Marketing Strategy

        18.1.10. Sierra Wireless

            18.1.10.1. Overview

            18.1.10.2. Product Portfolio

            18.1.10.3. Profitability by Market Segments

            18.1.10.4. Sales Footprint

            18.1.10.5. Strategy Overview

                18.1.10.5.1. Marketing Strategy

19. Assumptions & Acronyms Used

20. Research Methodology
Recommendations

Technology

Subscription and Billing Management Market

August 2022

REP-GB-15516

July 2023

315 pages

Technology

FWA Subscription

November 2022

REP-GB-15862

306 pages

Explore Technology Insights

View Reports