The FWA Subscription Market is estimated to be valued at USD 53.7 billion in 2025 and is projected to reach USD 305.9 billion by 2035, registering a compound annual growth rate (CAGR) of 19.0% over the forecast period.
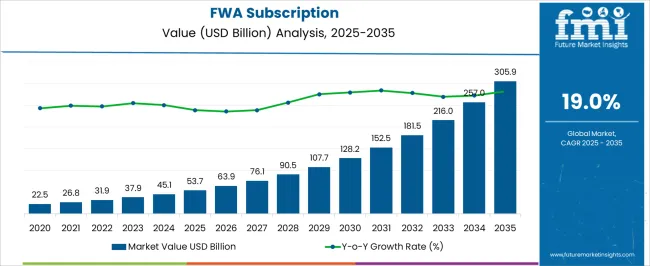
| Metric | Value |
|---|---|
| FWA Subscription Estimated Value in (2025 E) | USD 53.7 billion |
| FWA Subscription Forecast Value in (2035 F) | USD 305.9 billion |
| Forecast CAGR (2025 to 2035) | 19.0% |
The fixed wireless access subscription market is experiencing notable expansion as a result of growing demand for high speed connectivity in underserved and remote areas, increasing reliance on data intensive applications, and accelerated 5G rollout globally. Fixed wireless solutions offer a cost effective and rapidly deployable alternative to traditional wired infrastructure, enabling broadband access without extensive fiber or cable installations.
Telecom operators are actively leveraging FWA to bridge connectivity gaps, especially in residential zones and emerging markets. Advances in network infrastructure, customer premises equipment, and spectrum availability are enhancing service reliability and download speeds.
Furthermore, enterprise and industrial adoption of FWA is increasing as businesses seek scalable and secure connectivity options. The market outlook remains promising with continued investment in 5G technology, spectrum licensing, and government backed digital inclusion initiatives aimed at expanding internet penetration.
The market is segmented by End-User and Application and region. By End-User, the market is divided into Residential, Commercial, Industrial, and Government. In terms of Application, the market is classified into Internet of Things (IoT), Broadband Internet, Pay TV, and Others. Regionally, the market is classified into North America, Latin America, Western Europe, Eastern Europe, Balkan & Baltic Countries, Russia & Belarus, Central Asia, East Asia, South Asia & Pacific, and the Middle East & Africa.
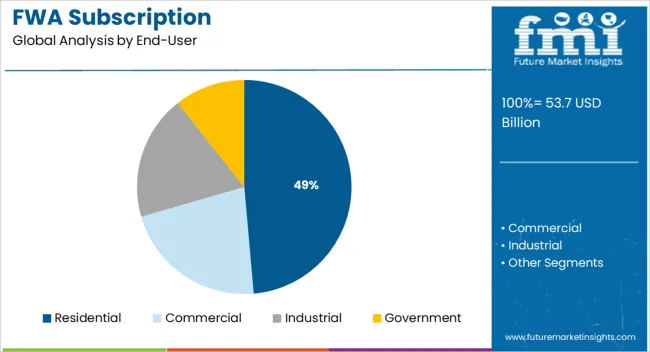
The residential segment is expected to account for 48.60% of total FWA subscription revenue by 2025, making it the largest end user group. This dominance is being driven by the growing need for reliable home broadband services to support remote work, virtual learning, streaming, and smart home applications.
The pandemic accelerated digital dependence within households, intensifying demand for high speed and stable internet connections. Fixed wireless access offers a viable solution where fiber rollout is limited or economically unfeasible.
Its ease of deployment and cost efficiency have encouraged adoption among households, particularly in suburban and rural areas. As broadband becomes essential for daily life and entertainment, the residential segment continues to lead FWA adoption trends.
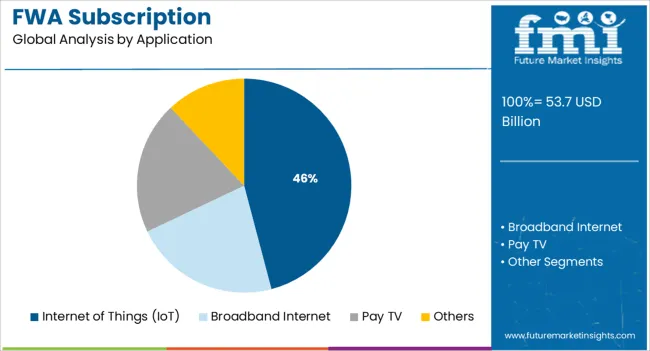
The internet of things application segment is projected to contribute 45.90% of total FWA subscription revenue by 2025, positioning it as a leading application area. This growth is attributed to the rapid expansion of connected devices and the need for consistent low latency communication across distributed environments.
Fixed wireless access offers a reliable backbone for IoT networks across sectors such as smart agriculture, manufacturing, logistics, and urban infrastructure. Its ability to support device density and flexible deployment in diverse terrains makes it a preferred connectivity solution for IoT use cases.
Additionally, integration with edge computing and network slicing in 5G environments is enhancing performance and data processing efficiency. These advantages are solidifying FWA’s role in supporting the evolving demands of the internet of things landscape.
Due to its wireless nature, FWA can cut down on the significant up-front costs and time required to get clearances, dig trenches, lay last-mile fiber, and deploy technician-installed equipment at homes and companies. Further lowering costs, operators may frequently implement FWA utilizing their current mobile wireless networks and fiber backhaul equipment.
Additionally, operators now have modern strategies and tools at their disposal (such as tiny cells and site densification) that will enable them to handle situations in which demand exceeds supply.
FWA subscription growth has implications for several key companies in the market. Most clearly, network operators have a chance to employ FWA as an additional source of income.
Even while FWA subscriptions are currently less lucrative than mobile, most wireless networks, except those in the densest metropolitan areas, are underused. Thus, adding FWA service to this idle capacity might increase profits.
The increasing rivalry from mobile network operators, who are combining 5G FWA with mobile subscriptions to draw in new clients and promote stickiness, should also be taken into consideration by cable providers.
Although wired connections, when available, nearly always offer a more dependable connection than wireless choices, 5G FWA does not now represent an existential threat to cable. However, if its economics and convenience of use continue to advance, this might change.
The commercial feasibility of FWA subscriptions is rising quickly. In addition to its increasing popularity as a wired connection replacement, it may be the most practical and cost-effective alternative for introducing the internet to both underdeveloped regions and competitive markets because of its excellent cost and quality profile.
Due to this, FWA subscriptions may very well play a significant part in increasing internet accessibility while providing telecom sector companies with new income, growth, and innovation opportunities - possibly resulting in a win-win situation for everyone.
| Report Attribute | Details |
|---|---|
| FWA Subscription Value (2025) | USD 53.7 billion |
| FWA Subscription Anticipated Value (2035) | USD 305.9 billion |
| FWA Subscription CAGR (2025 to 2035) | 19.0% |
As per Future Market Insights, the FWA subscription revenues increased from USD 45.1.0 million in 2024 to USD 45.1.0 million in 2024, growing at a CAGR of 50%.
With the proliferation of linked gadgets, the demand for internet access across diverse homes has been rising. By 2025, there are likely to be more than 50 billion linked gadgets, according to research.
Many emerging economies are adopting wearable technology, which increases the demand for greater wireless internet access. The constantly evolving standards for enhancing the characteristics of fixed wireless access have been some of the key drivers promoting the development of wireless technology throughout the years.
Additionally, as wireless broadband technology has steadily advanced over the past ten years, it has kept up with improvements in standards established by the Institute of Electrical and Electronics Engineers (IEEE).
These factors are anticipated to give momentum to the number of FWA subscribers which are anticipated to grow at a CAGR of 55% to reach a valuation of USD 14,422.74 million by 2035.
Due to increased broadband connectivity in homes and for individuals, it is anticipated that the household application category would show the highest adoption.
Fixed Wireless Access, often known as FWA, uses wireless mobile network technology rather than fixed lines to give internet access to residences. The necessity for a constant flow of data and the internet has grown over time as a result of people's increased use of the internet and mobile devices.
In particular for residential consumers, a subscription for fixed wireless access is a great choice since it offers users speeds at affordable prices with no installation hassles. Additionally, the construction of fixed broadband infrastructure is not economically feasible in many developing nations.
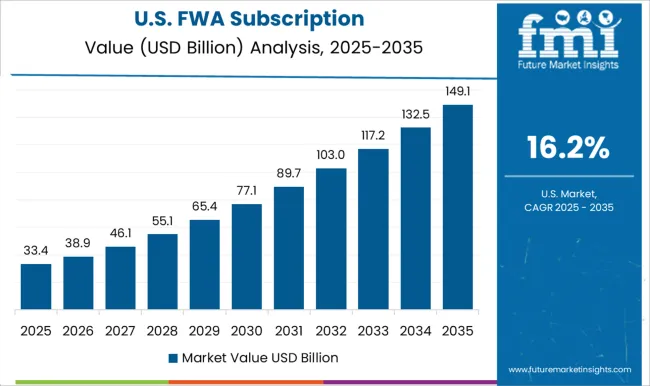
Active Engagement of Market Participants to Increase Regional Subscribers in the USA
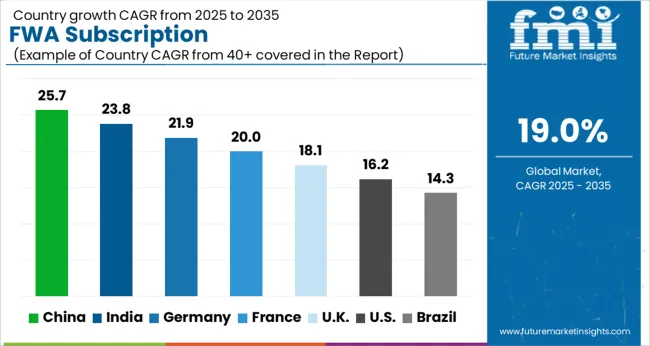
In the United States, the revenue from FWA subscribers is anticipated to be worth USD 53.7 million in 2025.
The study shows that the United States is expected to dominate, gathering the highest revenue from FWA subscribers during the forecast period. The United States is anticipated to dominate the market in the area over the forecast period.
The country's FWA subscription revenue is predicted to be worth USD 60.2 billion, with a CAGR of 43.3% during the projection period. The existence of well-known businesses in the area might be credited with the rising subscriptions for FWA.
Furthermore, the growth of FWA subscriptions in the projected period is anticipated to be strengthened by the increasingly beneficial measures done by businesses and the government to close the digital gap in the area.
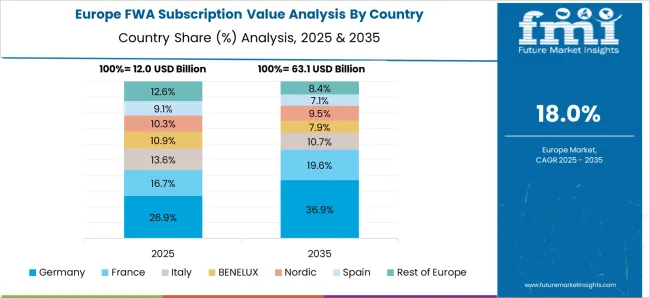
FWA Subscriptions in Germany are to expand within Europe at a rate of about 63.8% CAGR during the forecast period.
During the forecasted period, Europe is expected to grow at a rapid pace. Germany is undergoing rapid transformation in terms of industry breakthroughs and the adoption of new technology.
The adoption of cutting-edge technologies like the Internet of Things and M2M communication is anticipated to be significantly influenced by 5G networks and FWA subscriptions. They are crucial for creating smart cities and executing
Contribution of Developing Nations to Influence Preference of FWA Subscriptions
Japan and South Korea are expected to generate USD 7 billion and USD 4.4 billion, respectively, in other profitable regions. The market's expansion may be linked to the presence of the nations that are developing the quickest, including South Korea, Japan, China, and India. Smart city efforts in China, India, and other emerging countries are probably going to help fuel the market's anticipated growth for FWA subscriptions over the assessment period.
The use of contemporary technology and the expansion of several industries are transforming the region. Additionally, the regional FWA subscriptions are anticipated to grow throughout the projection period with the arrival of the Industrial Revolution 4.0.
The major companies that are likely to benefit the most from the development of 5G technology are Qualcomm, Nokia, and Ericsson.
One leader in the race is Ericsson, which has a market value of over D25 billion and is at the forefront of both investing in and developing 5G equipment.
Major mobile operators throughout the world, including SK Telecom Company Ltd. of South Korea, China Mobile (CHL) of China, Verizon, and AT&T of the United States, are all actively participating in research studies and field testing.
Additionally, companies with market capitalizations of roughly D18.5 billion and D81 billion, respectively, like Nokia and Qualcomm, Inc., are focusing their efforts on making sizeable investments in the creation of 5G infrastructure globally, which is also anticipated to have an impact on the global market.
The rise of the Internet of Things connection is expected to be mostly driven by smart homes during the coming few years, according to the most recent research from Cisco's Visual Networking Index. The company projects that the Internet of Things (IoT) or machine-to-machine connectivity will account for around half of the 53.7 billion device connections that will take place by 2025.
Nokia and Ooredoo announced in June 2024 that super-fast and dependable 4G and 5G fixed wireless (FWA) connectivity would be available across Oman. In February 2024, work to roll out the Nokia FastMile 4G FWA solution across the nation began. 15,000 households and businesses will first be linked as part of the scope of operation. Additionally, Nokia FastMile 5G FWA will shortly be installed in 3,000 residences in city centers.
Cellular, Qualcomm Technologies, Inc., Ericsson, and Inseego declared in May 2024 that they had completed a 5G extended-range milestone across a commercial network using millimeter wave (mmWave).
The longest 5G mmWave Fixed Wireless Access (FWA) connection in the United States was used to achieve this milestone at a distance of 7 km, with sustained average downlink speeds of less than 1 Gbps, sustained average uplink speeds of less than 55 Mbps, and instantaneous peak downlink speeds of more than 2 Gbps.
With the use of 5G technology and Fixed Wireless Access, TIM, Ericsson, and Qualcomm Technologies, Inc. have achieved ultra-broadband long-distance speed records in December 2024. (FWA). On the live TIM network, a speed of 1 Gbps on 26 GHz millimeter-wave (mm-wave) frequencies has been attained at a distance of 6.5 kilometers from the site (1Gbps using UDP protocol, 700Mbps Speedtest Ookla TCP).
Some of the Major Players Providing FWA Subscription are:
| Attribute | Details |
|---|---|
| Forecast period | 2025 to 2035 |
| Historical data available for | 2020 to 2025 |
| Market analysis | USD million in value |
| Key regions covered |
North America; Europe; Asian Pacific |
| Key countries covered |
USA, Germany, France, Italy, Canada, The UK, Spain, China, India, Australia |
| Key segments covered |
Application, End-use, Region |
| Key companies profiled |
Samsung; Qualcomm Technologies; Nokia Corporation; Mimosa Networks; Huawei; Verizon Communications; Ericsson; Arqiva; Cellular South |
The global FWA subscription is estimated to be valued at USD 53.7 billion in 2025.
The market size for the FWA subscription is projected to reach USD 305.9 billion by 2035.
The FWA subscription is expected to grow at a 19.0% CAGR between 2025 and 2035.
The key product types in FWA subscription are residential, commercial, industrial and government.
In terms of application, internet of things (iot) segment to command 45.9% share in the FWA subscription in 2025.


Our Research Products

The "Full Research Suite" delivers actionable market intel, deep dives on markets or technologies, so clients act faster, cut risk, and unlock growth.

The Leaderboard benchmarks and ranks top vendors, classifying them as Established Leaders, Leading Challengers, or Disruptors & Challengers.

Locates where complements amplify value and substitutes erode it, forecasting net impact by horizon

We deliver granular, decision-grade intel: market sizing, 5-year forecasts, pricing, adoption, usage, revenue, and operational KPIs—plus competitor tracking, regulation, and value chains—across 60 countries broadly.

Spot the shifts before they hit your P&L. We track inflection points, adoption curves, pricing moves, and ecosystem plays to show where demand is heading, why it is changing, and what to do next across high-growth markets and disruptive tech

Real-time reads of user behavior. We track shifting priorities, perceptions of today’s and next-gen services, and provider experience, then pace how fast tech moves from trial to adoption, blending buyer, consumer, and channel inputs with social signals (#WhySwitch, #UX).

Partner with our analyst team to build a custom report designed around your business priorities. From analysing market trends to assessing competitors or crafting bespoke datasets, we tailor insights to your needs.
Supplier Intelligence
Discovery & Profiling
Capacity & Footprint
Performance & Risk
Compliance & Governance
Commercial Readiness
Who Supplies Whom
Scorecards & Shortlists
Playbooks & Docs
Category Intelligence
Definition & Scope
Demand & Use Cases
Cost Drivers
Market Structure
Supply Chain Map
Trade & Policy
Operating Norms
Deliverables
Buyer Intelligence
Account Basics
Spend & Scope
Procurement Model
Vendor Requirements
Terms & Policies
Entry Strategy
Pain Points & Triggers
Outputs
Pricing Analysis
Benchmarks
Trends
Should-Cost
Indexation
Landed Cost
Commercial Terms
Deliverables
Brand Analysis
Positioning & Value Prop
Share & Presence
Customer Evidence
Go-to-Market
Digital & Reputation
Compliance & Trust
KPIs & Gaps
Outputs
Full Research Suite comprises of:
Market outlook & trends analysis
Interviews & case studies
Strategic recommendations
Vendor profiles & capabilities analysis
5-year forecasts
8 regions and 60+ country-level data splits
Market segment data splits
12 months of continuous data updates
DELIVERED AS:
PDF EXCEL ONLINE
Subscription Economy Market Size and Share Forecast Outlook 2025 to 2035
Subscription Carwash Services Market Size and Share Forecast Outlook 2025 to 2035
Subscription and Billing Management Market Insights – Forecast 2023-2033
eSIM Subscription Market Size and Share Forecast Outlook 2025 to 2035
Wine Subscription Market Analysis by Subscription Model, Wine Type, Price Tier, and Subscription Frequency and Region through 2035
Beauty Subscription Market Growth - Innovations, Trends & Forecast 2025 to 2035
Elder Care Subscription Market Size and Share Forecast Outlook 2025 to 2035
Consumer Cloud Subscription Market Size and Share Forecast Outlook 2025 to 2035

Thank you!
You will receive an email from our Business Development Manager. Please be sure to check your SPAM/JUNK folder too.
Chat With
MaRIA