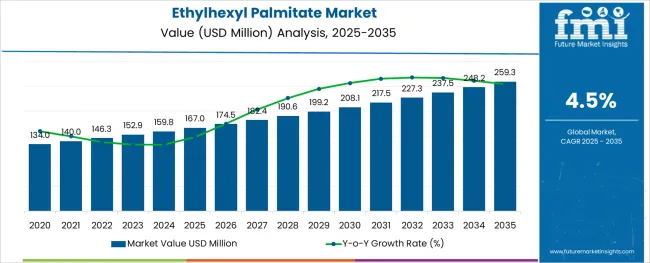
The global Ethylhexyl Palmitate Market is projected to exhibit growth at a CAGR of around 4% to 5% during the forecast period 2022 to 2032.
Growing application of ethylhexyl palmitate as pigment wetting agent, solvent, fragrance fixative, carrying agent, and emollient across the overall personal care & cosmetic industry is estimated to accelerate the sales in the global market.
Report Attribute | Details |
---|---|
Ethylhexyl Palmitate Market Projected Growth Rate (2022 to 2032) | 4% to 5% CAGR |
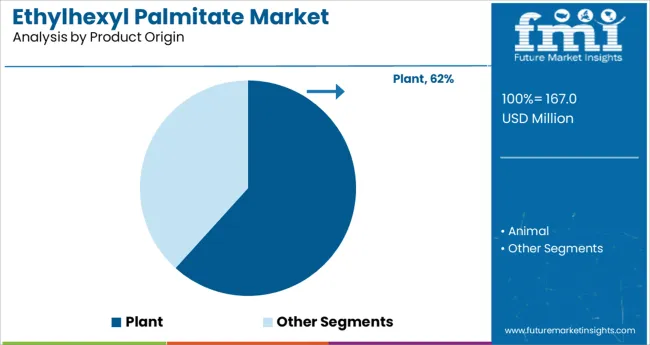
Ethylhexyl palmitate, referred to by various names such as octyl palmitate. hexadecanoic acid, 2-ethylhexyl ester, and others. It is fatty acid palmitate obtained from various types such as by a combination of palmitic acid, palm oil lipid, plant and animal life, and in smaller amounts from other fatty acids.
It is a smoothing and ester used in multiple skincare products as an ingredient to maintain the consistency and thickness of the final product.
The ethylhexyl palmitate market is largely driven by the rapid expansion of the personal care & cosmetics industry across the globe. Demand for ethylhexyl palmitate is rapidly increasing across diverse skincare sectors, owing to its favorable attributes such as moisturizing, softening & smoothening, easy skin absorption & penetration, and others.
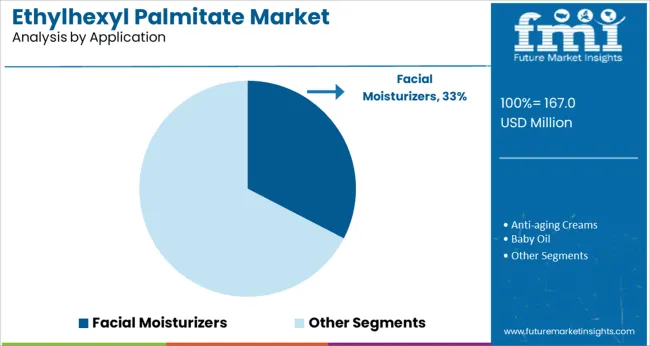
It is extensively being used as a carrying agent, solvent, wetting agent, and others for the production of various products such as foot moisturizers, sunscreens, hair removal wax, facial moisturizers, bath salts & soaks, and women’s depilatories among others.
Hence, increasing sales of these products across prominent regions such as North America, Asia Pacific, and Europe is anticipated to boost the demand for ethylhexyl palmitate in the global market.
Rising awareness regarding the adverse effects caused due to the use of ethylhexyl palmitate on the skin and hair such as irritation, acne outbreak, allergic reactions, rashes, and others is hindering the growth in the global market.
Also, high cost of ethylhexyl palmitate, due to the complex extraction process from natural sources, and availability of low-cost substitutes such as silicone are factors further hampering the demand in the market.
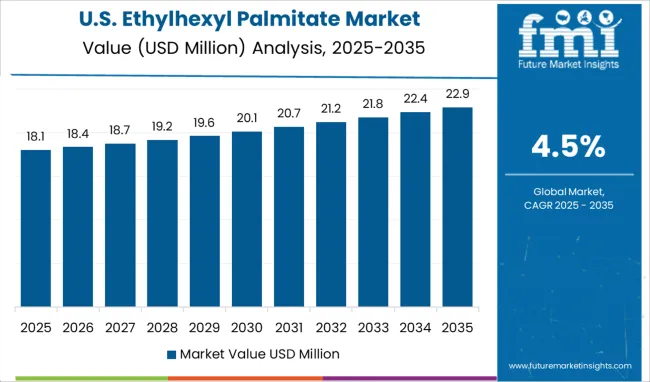
As per a study by FMI, North America is projected to account for the dominant revenue share in the global ethylhexyl palmitate market between 2022 and 2032.
With rising emphasis on the personal hygiene and increasing customer spending on enhancing body appearance and facial aesthetics, there is a rapid surge in demand for personal care & cosmetics products. Hence, key industry players are focusing on launching new products to cater to this surging demand.
For instance, in 2019, Eminence Organic Skin Care, a Canadian manufacturer of cosmetic products, announced launching a new range of products under its stonecrop collection, comprising body cream, body oil, body scrub, and others. Such new product launches are forecast to bolster the sales in the North America market.
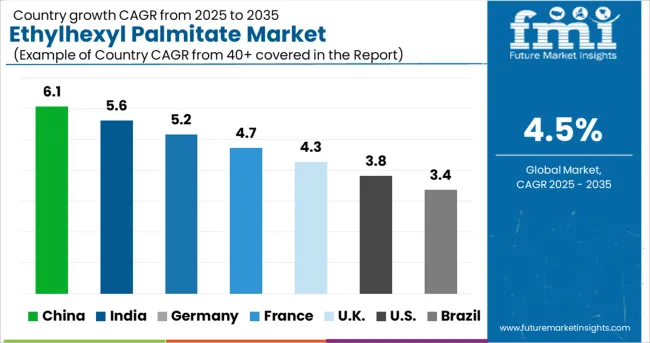
Future Market Insights states that Western Europe is anticipated to exhibit growth at a rapid CAGR in the global ethylhexyl palmitate market during the forecast period 2022 to 2032.
A rapid shift in the consumer preference toward organic, and natural personal care, cosmetics, and baby care products is being witnessed across the countries such as the UK, Germany, and France among others.
This is due to rising prevalence of reactions and allergies caused because of the chemical ingredients used in products such as facial cream, baby moisturizers, hair conditioners, and many others.
Attributed to this, demand for organic, herbal, and natural products is increasing at a rapid pace. As ethylhexyl palmitate is increasingly used as an organics substitute for silicone during the production of natural products, this rise in demand for organics skincare products is expected to favor the growth in the Western Europe market.
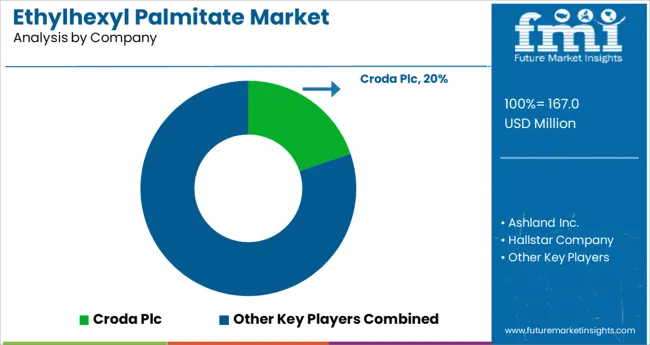
Some of the leading players in the ethylhexyl palmitate market are Universal Preserve-A-Chem Inc., Esters and Solvents LLP., Shanghai Smart Chemicals Co. Ltd., Making Cosmetics, Trivent Chemicals, BOC Sciences, Bruchem, Inc., Acme Hardesty, Parchem, Qingzhou Ailitong Chemicals Co, Ltd., Hanianzhongxin Chemicals Co, Ltd., and others.
The market is highly competitive, attributed to presence of a large number of participants and increasing adoption of production capacity expansion, collaboration, mergers & acquisitions strategies for expanding their market share.
Report Attribute | Details |
---|---|
Growth Rate | CAGR of 4% to 5% from 2022 to 2032 |
Base Year for Estimation | 2021 |
Historical Data | 2015 to 2020 |
Forecast Period | 2022 to 2032 |
Quantitative Units | Revenue in USD Million and CAGR from 2022 to 2032 |
Report Coverage | Revenue Forecast, Volume Forecast, Company Ranking, Competitive Landscape, Growth Factors, Trends and Pricing Analysis |
Segments Covered | Product Origin, Product Packaging, Application, End Use, Region |
Countries Covered | North America; Latin America; Europe; East Asia; South Asia; Oceania; Middle East and Africa |
Key Companies Profiled | Universal Preserve-A-Chem Inc.; Esters and Solvents LLP.; Shanghai Smart Chemicals Co. Ltd.; Making Cosmetics; Trivent Chemicals; BOC Sciences, Bruchem, Inc.; Acme Hardesty; Parchem; Qingzhou Ailitong Chemicals Co, Ltd.; Hanianzhongxin Chemicals Co, Ltd.; Others |
Customization | Available Upon Request |
Table 1: Global Ethylhexyl Palmitate Market Value (US$ Mn) Forecast by Region, 2017-2032
Table 2: Global Ethylhexyl Palmitate Market Volume (MT) Forecast by Region, 2017-2032
Table 3: Global Ethylhexyl Palmitate Market Value (US$ Mn) Forecast by Form, 2017-2032
Table 4: Global Ethylhexyl Palmitate Market Volume (MT) Forecast by Form, 2017-2032
Table 5: Global Ethylhexyl Palmitate Market Value (US$ Mn) Forecast by End-use, 2017-2032
Table 6: Global Ethylhexyl Palmitate Market Volume (MT) Forecast by End-use, 2017-2032
Table 7: Global Ethylhexyl Palmitate Market Value (US$ Mn) Forecast by Functionality, 2017-2032
Table 8: Global Ethylhexyl Palmitate Market Volume (MT) Forecast by Functionality, 2017-2032
Table 9: North America Ethylhexyl Palmitate Market Value (US$ Mn) Forecast by Country, 2017-2032
Table 10: North America Ethylhexyl Palmitate Market Volume (MT) Forecast by Country, 2017-2032
Table 11: North America Ethylhexyl Palmitate Market Value (US$ Mn) Forecast by Form, 2017-2032
Table 12: North America Ethylhexyl Palmitate Market Volume (MT) Forecast by Form, 2017-2032
Table 13: North America Ethylhexyl Palmitate Market Value (US$ Mn) Forecast by End-use, 2017-2032
Table 14: North America Ethylhexyl Palmitate Market Volume (MT) Forecast by End-use, 2017-2032
Table 15: North America Ethylhexyl Palmitate Market Value (US$ Mn) Forecast by Functionality, 2017-2032
Table 16: North America Ethylhexyl Palmitate Market Volume (MT) Forecast by Functionality, 2017-2032
Table 17: Latin America Ethylhexyl Palmitate Market Value (US$ Mn) Forecast by Country, 2017-2032
Table 18: Latin America Ethylhexyl Palmitate Market Volume (MT) Forecast by Country, 2017-2032
Table 19: Latin America Ethylhexyl Palmitate Market Value (US$ Mn) Forecast by Form, 2017-2032
Table 20: Latin America Ethylhexyl Palmitate Market Volume (MT) Forecast by Form, 2017-2032
Table 21: Latin America Ethylhexyl Palmitate Market Value (US$ Mn) Forecast by End-use, 2017-2032
Table 22: Latin America Ethylhexyl Palmitate Market Volume (MT) Forecast by End-use, 2017-2032
Table 23: Latin America Ethylhexyl Palmitate Market Value (US$ Mn) Forecast by Functionality, 2017-2032
Table 24: Latin America Ethylhexyl Palmitate Market Volume (MT) Forecast by Functionality, 2017-2032
Table 25: Europe Ethylhexyl Palmitate Market Value (US$ Mn) Forecast by Country, 2017-2032
Table 26: Europe Ethylhexyl Palmitate Market Volume (MT) Forecast by Country, 2017-2032
Table 27: Europe Ethylhexyl Palmitate Market Value (US$ Mn) Forecast by Form, 2017-2032
Table 28: Europe Ethylhexyl Palmitate Market Volume (MT) Forecast by Form, 2017-2032
Table 29: Europe Ethylhexyl Palmitate Market Value (US$ Mn) Forecast by End-use, 2017-2032
Table 30: Europe Ethylhexyl Palmitate Market Volume (MT) Forecast by End-use, 2017-2032
Table 31: Europe Ethylhexyl Palmitate Market Value (US$ Mn) Forecast by Functionality, 2017-2032
Table 32: Europe Ethylhexyl Palmitate Market Volume (MT) Forecast by Functionality, 2017-2032
Table 33: East Asia Ethylhexyl Palmitate Market Value (US$ Mn) Forecast by Country, 2017-2032
Table 34: East Asia Ethylhexyl Palmitate Market Volume (MT) Forecast by Country, 2017-2032
Table 35: East Asia Ethylhexyl Palmitate Market Value (US$ Mn) Forecast by Form, 2017-2032
Table 36: East Asia Ethylhexyl Palmitate Market Volume (MT) Forecast by Form, 2017-2032
Table 37: East Asia Ethylhexyl Palmitate Market Value (US$ Mn) Forecast by End-use, 2017-2032
Table 38: East Asia Ethylhexyl Palmitate Market Volume (MT) Forecast by End-use, 2017-2032
Table 39: East Asia Ethylhexyl Palmitate Market Value (US$ Mn) Forecast by Functionality, 2017-2032
Table 40: East Asia Ethylhexyl Palmitate Market Volume (MT) Forecast by Functionality, 2017-2032
Table 41: South Asia & Pacific Ethylhexyl Palmitate Market Value (US$ Mn) Forecast by Country, 2017-2032
Table 42: South Asia & Pacific Ethylhexyl Palmitate Market Volume (MT) Forecast by Country, 2017-2032
Table 43: South Asia & Pacific Ethylhexyl Palmitate Market Value (US$ Mn) Forecast by Form, 2017-2032
Table 44: South Asia & Pacific Ethylhexyl Palmitate Market Volume (MT) Forecast by Form, 2017-2032
Table 45: South Asia & Pacific Ethylhexyl Palmitate Market Value (US$ Mn) Forecast by End-use, 2017-2032
Table 46: South Asia & Pacific Ethylhexyl Palmitate Market Volume (MT) Forecast by End-use, 2017-2032
Table 47: South Asia & Pacific Ethylhexyl Palmitate Market Value (US$ Mn) Forecast by Functionality, 2017-2032
Table 48: South Asia & Pacific Ethylhexyl Palmitate Market Volume (MT) Forecast by Functionality, 2017-2032
Table 49: MEA Ethylhexyl Palmitate Market Value (US$ Mn) Forecast by Country, 2017-2032
Table 50: MEA Ethylhexyl Palmitate Market Volume (MT) Forecast by Country, 2017-2032
Table 51: MEA Ethylhexyl Palmitate Market Value (US$ Mn) Forecast by Form, 2017-2032
Table 52: MEA Ethylhexyl Palmitate Market Volume (MT) Forecast by Form, 2017-2032
Table 53: MEA Ethylhexyl Palmitate Market Value (US$ Mn) Forecast by End-use, 2017-2032
Table 54: MEA Ethylhexyl Palmitate Market Volume (MT) Forecast by End-use, 2017-2032
Table 55: MEA Ethylhexyl Palmitate Market Value (US$ Mn) Forecast by Functionality, 2017-2032
Table 56: MEA Ethylhexyl Palmitate Market Volume (MT) Forecast by Functionality, 2017-2032
Figure 1: Global Ethylhexyl Palmitate Market Value (US$ Mn) by Form, 2022-2032
Figure 2: Global Ethylhexyl Palmitate Market Value (US$ Mn) by End-use, 2022-2032
Figure 3: Global Ethylhexyl Palmitate Market Value (US$ Mn) by Functionality, 2022-2032
Figure 4: Global Ethylhexyl Palmitate Market Value (US$ Mn) by Region, 2022-2032
Figure 5: Global Ethylhexyl Palmitate Market Value (US$ Mn) Analysis by Region, 2017-2032
Figure 6: Global Ethylhexyl Palmitate Market Volume (MT) Analysis by Region, 2017-2032
Figure 7: Global Ethylhexyl Palmitate Market Value Share (%) and BPS Analysis by Region, 2022-2032
Figure 8: Global Ethylhexyl Palmitate Market Y-o-Y Growth (%) Projections by Region, 2022-2032
Figure 9: Global Ethylhexyl Palmitate Market Value (US$ Mn) Analysis by Form, 2017-2032
Figure 10: Global Ethylhexyl Palmitate Market Volume (MT) Analysis by Form, 2017-2032
Figure 11: Global Ethylhexyl Palmitate Market Value Share (%) and BPS Analysis by Form, 2022-2032
Figure 12: Global Ethylhexyl Palmitate Market Y-o-Y Growth (%) Projections by Form, 2022-2032
Figure 13: Global Ethylhexyl Palmitate Market Value (US$ Mn) Analysis by End-use, 2017-2032
Figure 14: Global Ethylhexyl Palmitate Market Volume (MT) Analysis by End-use, 2017-2032
Figure 15: Global Ethylhexyl Palmitate Market Value Share (%) and BPS Analysis by End-use, 2022-2032
Figure 16: Global Ethylhexyl Palmitate Market Y-o-Y Growth (%) Projections by End-use, 2022-2032
Figure 17: Global Ethylhexyl Palmitate Market Value (US$ Mn) Analysis by Functionality, 2017-2032
Figure 18: Global Ethylhexyl Palmitate Market Volume (MT) Analysis by Functionality, 2017-2032
Figure 19: Global Ethylhexyl Palmitate Market Value Share (%) and BPS Analysis by Functionality, 2022-2032
Figure 20: Global Ethylhexyl Palmitate Market Y-o-Y Growth (%) Projections by Functionality, 2022-2032
Figure 21: Global Ethylhexyl Palmitate Market Attractiveness by Form, 2022-2032
Figure 22: Global Ethylhexyl Palmitate Market Attractiveness by End-use, 2022-2032
Figure 23: Global Ethylhexyl Palmitate Market Attractiveness by Functionality, 2022-2032
Figure 24: Global Ethylhexyl Palmitate Market Attractiveness by Region, 2022-2032
Figure 25: North America Ethylhexyl Palmitate Market Value (US$ Mn) by Form, 2022-2032
Figure 26: North America Ethylhexyl Palmitate Market Value (US$ Mn) by End-use, 2022-2032
Figure 27: North America Ethylhexyl Palmitate Market Value (US$ Mn) by Functionality, 2022-2032
Figure 28: North America Ethylhexyl Palmitate Market Value (US$ Mn) by Country, 2022-2032
Figure 29: North America Ethylhexyl Palmitate Market Value (US$ Mn) Analysis by Country, 2017-2032
Figure 30: North America Ethylhexyl Palmitate Market Volume (MT) Analysis by Country, 2017-2032
Figure 31: North America Ethylhexyl Palmitate Market Value Share (%) and BPS Analysis by Country, 2022-2032
Figure 32: North America Ethylhexyl Palmitate Market Y-o-Y Growth (%) Projections by Country, 2022-2032
Figure 33: North America Ethylhexyl Palmitate Market Value (US$ Mn) Analysis by Form, 2017-2032
Figure 34: North America Ethylhexyl Palmitate Market Volume (MT) Analysis by Form, 2017-2032
Figure 35: North America Ethylhexyl Palmitate Market Value Share (%) and BPS Analysis by Form, 2022-2032
Figure 36: North America Ethylhexyl Palmitate Market Y-o-Y Growth (%) Projections by Form, 2022-2032
Figure 37: North America Ethylhexyl Palmitate Market Value (US$ Mn) Analysis by End-use, 2017-2032
Figure 38: North America Ethylhexyl Palmitate Market Volume (MT) Analysis by End-use, 2017-2032
Figure 39: North America Ethylhexyl Palmitate Market Value Share (%) and BPS Analysis by End-use, 2022-2032
Figure 40: North America Ethylhexyl Palmitate Market Y-o-Y Growth (%) Projections by End-use, 2022-2032
Figure 41: North America Ethylhexyl Palmitate Market Value (US$ Mn) Analysis by Functionality, 2017-2032
Figure 42: North America Ethylhexyl Palmitate Market Volume (MT) Analysis by Functionality, 2017-2032
Figure 43: North America Ethylhexyl Palmitate Market Value Share (%) and BPS Analysis by Functionality, 2022-2032
Figure 44: North America Ethylhexyl Palmitate Market Y-o-Y Growth (%) Projections by Functionality, 2022-2032
Figure 45: North America Ethylhexyl Palmitate Market Attractiveness by Form, 2022-2032
Figure 46: North America Ethylhexyl Palmitate Market Attractiveness by End-use, 2022-2032
Figure 47: North America Ethylhexyl Palmitate Market Attractiveness by Functionality, 2022-2032
Figure 48: North America Ethylhexyl Palmitate Market Attractiveness by Country, 2022-2032
Figure 49: Latin America Ethylhexyl Palmitate Market Value (US$ Mn) by Form, 2022-2032
Figure 50: Latin America Ethylhexyl Palmitate Market Value (US$ Mn) by End-use, 2022-2032
Figure 51: Latin America Ethylhexyl Palmitate Market Value (US$ Mn) by Functionality, 2022-2032
Figure 52: Latin America Ethylhexyl Palmitate Market Value (US$ Mn) by Country, 2022-2032
Figure 53: Latin America Ethylhexyl Palmitate Market Value (US$ Mn) Analysis by Country, 2017-2032
Figure 54: Latin America Ethylhexyl Palmitate Market Volume (MT) Analysis by Country, 2017-2032
Figure 55: Latin America Ethylhexyl Palmitate Market Value Share (%) and BPS Analysis by Country, 2022-2032
Figure 56: Latin America Ethylhexyl Palmitate Market Y-o-Y Growth (%) Projections by Country, 2022-2032
Figure 57: Latin America Ethylhexyl Palmitate Market Value (US$ Mn) Analysis by Form, 2017-2032
Figure 58: Latin America Ethylhexyl Palmitate Market Volume (MT) Analysis by Form, 2017-2032
Figure 59: Latin America Ethylhexyl Palmitate Market Value Share (%) and BPS Analysis by Form, 2022-2032
Figure 60: Latin America Ethylhexyl Palmitate Market Y-o-Y Growth (%) Projections by Form, 2022-2032
Figure 61: Latin America Ethylhexyl Palmitate Market Value (US$ Mn) Analysis by End-use, 2017-2032
Figure 62: Latin America Ethylhexyl Palmitate Market Volume (MT) Analysis by End-use, 2017-2032
Figure 63: Latin America Ethylhexyl Palmitate Market Value Share (%) and BPS Analysis by End-use, 2022-2032
Figure 64: Latin America Ethylhexyl Palmitate Market Y-o-Y Growth (%) Projections by End-use, 2022-2032
Figure 65: Latin America Ethylhexyl Palmitate Market Value (US$ Mn) Analysis by Functionality, 2017-2032
Figure 66: Latin America Ethylhexyl Palmitate Market Volume (MT) Analysis by Functionality, 2017-2032
Figure 67: Latin America Ethylhexyl Palmitate Market Value Share (%) and BPS Analysis by Functionality, 2022-2032
Figure 68: Latin America Ethylhexyl Palmitate Market Y-o-Y Growth (%) Projections by Functionality, 2022-2032
Figure 69: Latin America Ethylhexyl Palmitate Market Attractiveness by Form, 2022-2032
Figure 70: Latin America Ethylhexyl Palmitate Market Attractiveness by End-use, 2022-2032
Figure 71: Latin America Ethylhexyl Palmitate Market Attractiveness by Functionality, 2022-2032
Figure 72: Latin America Ethylhexyl Palmitate Market Attractiveness by Country, 2022-2032
Figure 73: Europe Ethylhexyl Palmitate Market Value (US$ Mn) by Form, 2022-2032
Figure 74: Europe Ethylhexyl Palmitate Market Value (US$ Mn) by End-use, 2022-2032
Figure 75: Europe Ethylhexyl Palmitate Market Value (US$ Mn) by Functionality, 2022-2032
Figure 76: Europe Ethylhexyl Palmitate Market Value (US$ Mn) by Country, 2022-2032
Figure 77: Europe Ethylhexyl Palmitate Market Value (US$ Mn) Analysis by Country, 2017-2032
Figure 78: Europe Ethylhexyl Palmitate Market Volume (MT) Analysis by Country, 2017-2032
Figure 79: Europe Ethylhexyl Palmitate Market Value Share (%) and BPS Analysis by Country, 2022-2032
Figure 80: Europe Ethylhexyl Palmitate Market Y-o-Y Growth (%) Projections by Country, 2022-2032
Figure 81: Europe Ethylhexyl Palmitate Market Value (US$ Mn) Analysis by Form, 2017-2032
Figure 82: Europe Ethylhexyl Palmitate Market Volume (MT) Analysis by Form, 2017-2032
Figure 83: Europe Ethylhexyl Palmitate Market Value Share (%) and BPS Analysis by Form, 2022-2032
Figure 84: Europe Ethylhexyl Palmitate Market Y-o-Y Growth (%) Projections by Form, 2022-2032
Figure 85: Europe Ethylhexyl Palmitate Market Value (US$ Mn) Analysis by End-use, 2017-2032
Figure 86: Europe Ethylhexyl Palmitate Market Volume (MT) Analysis by End-use, 2017-2032
Figure 87: Europe Ethylhexyl Palmitate Market Value Share (%) and BPS Analysis by End-use, 2022-2032
Figure 88: Europe Ethylhexyl Palmitate Market Y-o-Y Growth (%) Projections by End-use, 2022-2032
Figure 89: Europe Ethylhexyl Palmitate Market Value (US$ Mn) Analysis by Functionality, 2017-2032
Figure 90: Europe Ethylhexyl Palmitate Market Volume (MT) Analysis by Functionality, 2017-2032
Figure 91: Europe Ethylhexyl Palmitate Market Value Share (%) and BPS Analysis by Functionality, 2022-2032
Figure 92: Europe Ethylhexyl Palmitate Market Y-o-Y Growth (%) Projections by Functionality, 2022-2032
Figure 93: Europe Ethylhexyl Palmitate Market Attractiveness by Form, 2022-2032
Figure 94: Europe Ethylhexyl Palmitate Market Attractiveness by End-use, 2022-2032
Figure 95: Europe Ethylhexyl Palmitate Market Attractiveness by Functionality, 2022-2032
Figure 96: Europe Ethylhexyl Palmitate Market Attractiveness by Country, 2022-2032
Figure 97: East Asia Ethylhexyl Palmitate Market Value (US$ Mn) by Form, 2022-2032
Figure 98: East Asia Ethylhexyl Palmitate Market Value (US$ Mn) by End-use, 2022-2032
Figure 99: East Asia Ethylhexyl Palmitate Market Value (US$ Mn) by Functionality, 2022-2032
Figure 100: East Asia Ethylhexyl Palmitate Market Value (US$ Mn) by Country, 2022-2032
Figure 101: East Asia Ethylhexyl Palmitate Market Value (US$ Mn) Analysis by Country, 2017-2032
Figure 102: East Asia Ethylhexyl Palmitate Market Volume (MT) Analysis by Country, 2017-2032
Figure 103: East Asia Ethylhexyl Palmitate Market Value Share (%) and BPS Analysis by Country, 2022-2032
Figure 104: East Asia Ethylhexyl Palmitate Market Y-o-Y Growth (%) Projections by Country, 2022-2032
Figure 105: East Asia Ethylhexyl Palmitate Market Value (US$ Mn) Analysis by Form, 2017-2032
Figure 106: East Asia Ethylhexyl Palmitate Market Volume (MT) Analysis by Form, 2017-2032
Figure 107: East Asia Ethylhexyl Palmitate Market Value Share (%) and BPS Analysis by Form, 2022-2032
Figure 108: East Asia Ethylhexyl Palmitate Market Y-o-Y Growth (%) Projections by Form, 2022-2032
Figure 109: East Asia Ethylhexyl Palmitate Market Value (US$ Mn) Analysis by End-use, 2017-2032
Figure 110: East Asia Ethylhexyl Palmitate Market Volume (MT) Analysis by End-use, 2017-2032
Figure 111: East Asia Ethylhexyl Palmitate Market Value Share (%) and BPS Analysis by End-use, 2022-2032
Figure 112: East Asia Ethylhexyl Palmitate Market Y-o-Y Growth (%) Projections by End-use, 2022-2032
Figure 113: East Asia Ethylhexyl Palmitate Market Value (US$ Mn) Analysis by Functionality, 2017-2032
Figure 114: East Asia Ethylhexyl Palmitate Market Volume (MT) Analysis by Functionality, 2017-2032
Figure 115: East Asia Ethylhexyl Palmitate Market Value Share (%) and BPS Analysis by Functionality, 2022-2032
Figure 116: East Asia Ethylhexyl Palmitate Market Y-o-Y Growth (%) Projections by Functionality, 2022-2032
Figure 117: East Asia Ethylhexyl Palmitate Market Attractiveness by Form, 2022-2032
Figure 118: East Asia Ethylhexyl Palmitate Market Attractiveness by End-use, 2022-2032
Figure 119: East Asia Ethylhexyl Palmitate Market Attractiveness by Functionality, 2022-2032
Figure 120: East Asia Ethylhexyl Palmitate Market Attractiveness by Country, 2022-2032
Figure 121: South Asia & Pacific Ethylhexyl Palmitate Market Value (US$ Mn) by Form, 2022-2032
Figure 122: South Asia & Pacific Ethylhexyl Palmitate Market Value (US$ Mn) by End-use, 2022-2032
Figure 123: South Asia & Pacific Ethylhexyl Palmitate Market Value (US$ Mn) by Functionality, 2022-2032
Figure 124: South Asia & Pacific Ethylhexyl Palmitate Market Value (US$ Mn) by Country, 2022-2032
Figure 125: South Asia & Pacific Ethylhexyl Palmitate Market Value (US$ Mn) Analysis by Country, 2017-2032
Figure 126: South Asia & Pacific Ethylhexyl Palmitate Market Volume (MT) Analysis by Country, 2017-2032
Figure 127: South Asia & Pacific Ethylhexyl Palmitate Market Value Share (%) and BPS Analysis by Country, 2022-2032
Figure 128: South Asia & Pacific Ethylhexyl Palmitate Market Y-o-Y Growth (%) Projections by Country, 2022-2032
Figure 129: South Asia & Pacific Ethylhexyl Palmitate Market Value (US$ Mn) Analysis by Form, 2017-2032
Figure 130: South Asia & Pacific Ethylhexyl Palmitate Market Volume (MT) Analysis by Form, 2017-2032
Figure 131: South Asia & Pacific Ethylhexyl Palmitate Market Value Share (%) and BPS Analysis by Form, 2022-2032
Figure 132: South Asia & Pacific Ethylhexyl Palmitate Market Y-o-Y Growth (%) Projections by Form, 2022-2032
Figure 133: South Asia & Pacific Ethylhexyl Palmitate Market Value (US$ Mn) Analysis by End-use, 2017-2032
Figure 134: South Asia & Pacific Ethylhexyl Palmitate Market Volume (MT) Analysis by End-use, 2017-2032
Figure 135: South Asia & Pacific Ethylhexyl Palmitate Market Value Share (%) and BPS Analysis by End-use, 2022-2032
Figure 136: South Asia & Pacific Ethylhexyl Palmitate Market Y-o-Y Growth (%) Projections by End-use, 2022-2032
Figure 137: South Asia & Pacific Ethylhexyl Palmitate Market Value (US$ Mn) Analysis by Functionality, 2017-2032
Figure 138: South Asia & Pacific Ethylhexyl Palmitate Market Volume (MT) Analysis by Functionality, 2017-2032
Figure 139: South Asia & Pacific Ethylhexyl Palmitate Market Value Share (%) and BPS Analysis by Functionality, 2022-2032
Figure 140: South Asia & Pacific Ethylhexyl Palmitate Market Y-o-Y Growth (%) Projections by Functionality, 2022-2032
Figure 141: South Asia & Pacific Ethylhexyl Palmitate Market Attractiveness by Form, 2022-2032
Figure 142: South Asia & Pacific Ethylhexyl Palmitate Market Attractiveness by End-use, 2022-2032
Figure 143: South Asia & Pacific Ethylhexyl Palmitate Market Attractiveness by Functionality, 2022-2032
Figure 144: South Asia & Pacific Ethylhexyl Palmitate Market Attractiveness by Country, 2022-2032
Figure 145: MEA Ethylhexyl Palmitate Market Value (US$ Mn) by Form, 2022-2032
Figure 146: MEA Ethylhexyl Palmitate Market Value (US$ Mn) by End-use, 2022-2032
Figure 147: MEA Ethylhexyl Palmitate Market Value (US$ Mn) by Functionality, 2022-2032
Figure 148: MEA Ethylhexyl Palmitate Market Value (US$ Mn) by Country, 2022-2032
Figure 149: MEA Ethylhexyl Palmitate Market Value (US$ Mn) Analysis by Country, 2017-2032
Figure 150: MEA Ethylhexyl Palmitate Market Volume (MT) Analysis by Country, 2017-2032
Figure 151: MEA Ethylhexyl Palmitate Market Value Share (%) and BPS Analysis by Country, 2022-2032
Figure 152: MEA Ethylhexyl Palmitate Market Y-o-Y Growth (%) Projections by Country, 2022-2032
Figure 153: MEA Ethylhexyl Palmitate Market Value (US$ Mn) Analysis by Form, 2017-2032
Figure 154: MEA Ethylhexyl Palmitate Market Volume (MT) Analysis by Form, 2017-2032
Figure 155: MEA Ethylhexyl Palmitate Market Value Share (%) and BPS Analysis by Form, 2022-2032
Figure 156: MEA Ethylhexyl Palmitate Market Y-o-Y Growth (%) Projections by Form, 2022-2032
Figure 157: MEA Ethylhexyl Palmitate Market Value (US$ Mn) Analysis by End-use, 2017-2032
Figure 158: MEA Ethylhexyl Palmitate Market Volume (MT) Analysis by End-use, 2017-2032
Figure 159: MEA Ethylhexyl Palmitate Market Value Share (%) and BPS Analysis by End-use, 2022-2032
Figure 160: MEA Ethylhexyl Palmitate Market Y-o-Y Growth (%) Projections by End-use, 2022-2032
Figure 161: MEA Ethylhexyl Palmitate Market Value (US$ Mn) Analysis by Functionality, 2017-2032
Figure 162: MEA Ethylhexyl Palmitate Market Volume (MT) Analysis by Functionality, 2017-2032
Figure 163: MEA Ethylhexyl Palmitate Market Value Share (%) and BPS Analysis by Functionality, 2022-2032
Figure 164: MEA Ethylhexyl Palmitate Market Y-o-Y Growth (%) Projections by Functionality, 2022-2032
Figure 165: MEA Ethylhexyl Palmitate Market Attractiveness by Form, 2022-2032
Figure 166: MEA Ethylhexyl Palmitate Market Attractiveness by End-use, 2022-2032
Figure 167: MEA Ethylhexyl Palmitate Market Attractiveness by Functionality, 2022-2032
Figure 168: MEA Ethylhexyl Palmitate Market Attractiveness by Country, 2022-2032
FMI projects the demand for ethylhexyl palmitate market to expand at 4% to 5% value CAGR over the forecast period 2022 to 2032
The ethylhexyl palmitate market is dominated by North America, and this trend is projected to continue for the assessment period.
Universal Preserve-A-Chem Inc., Esters and Solvents LLP., Shanghai Smart Chemicals Co. Ltd., Making Cosmetics, Trivent Chemicals, BOC Sciences, Bruchem, Inc., Acme Hardesty, Parchem, Qingzhou Ailitong Chemicals Co, Ltd., Hanianzhongxin Chemicals Co, Ltd., and others are some key ethylhexyl palmitate manufacturer.
Explore Similar Insights
Thank you!
You will receive an email from our Business Development Manager. Please be sure to check your SPAM/JUNK folder too.