Cetyl Palmitate Market Forecast and Outlook 2025 to 2035

The cetyl palmitate market is estimated to be valued at USD 381.0 million in 2025. It is projected to reach USD 537.4 million by 2035, registering a compound annual growth rate (CAGR) of 3.5% over the forecast period. The market is projected to add an absolute dollar opportunity of USD 156.0 million over the forecast period, reflecting a 1.41 times growth at a CAGR of 3.5%.
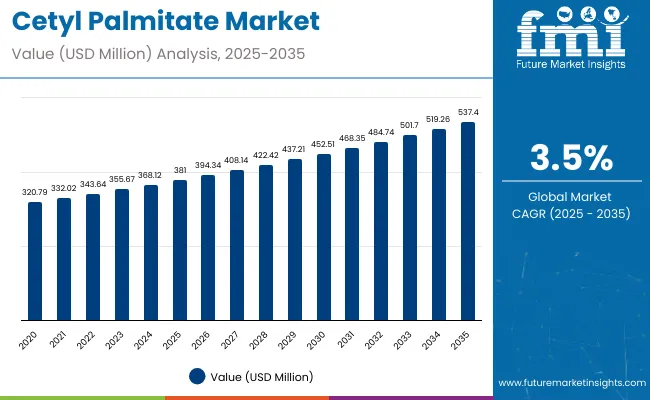
Quick Stats for Cetyl Palmitate Market

  • Cetyl Palmitate Market Value (2025): USD 381.0 million
  • Cetyl Palmitate Market Forecast Value (2035): USD 537.4 million
  • Cetyl Palmitate Market Forecast CAGR: 3.5%
  • Leading Segment in Cetyl Palmitate Market in 2025: Shampoos & Conditioners (60% market share)
  • Key Growth Regions in Cetyl Palmitate Market: North America, Europe, Asia-Pacific
  • Top Key Players in Cetyl Palmitate Market: Sigma-Aldrich Co. LLC, Fine Organics, Kraft Chemical Company, Hallstar, Croda International Plc, BASF SE, Caesar & Loretz, Haihang Industry, Hangzhou Dayangchem, KHBoddin, Mosselman, Evonik Industries, Oleon NV, BioCell Technology, Taiwan Njc Corporation, DeWolf Chemical (an Azelis Americas company), Ashland

Cetyl Almitate Market

Metric Value
Estimated Size (2025E) USD 381.0 million
Projected Value (2035F) USD 537.4 million
CAGR (2025 to 2035) 3.5%

The market’s expansion is expected to be driven by rising consumer preference for naturally derived emollients and emulsifiers in cosmetic and personal care products, including creams, lotions, and hair care formulations.

By 2030, the market is projected to reach approximately USD 452.5 million, representing an incremental value of USD 71.5 million over the first half of the decade. Between 2030 and 2035, the market is expected to grow further to USD 537.4 million, adding another USD 84.9 million, indicating a moderately back-loaded growth trend driven by the rising adoption of natural ingredients and innovative product formulations in the personal care and cosmetics industries.

Companies such as Sigma-Aldrich Co. LLC., Fine Organics, Kraft Chemical Company, and Croda International are advancing their competitive positions through investment in research and development for high-purity cetyl palmitate derivatives. Strategic partnerships, eco-friendly sourcing practices, and regulatory compliance are enabling expansion into premium cosmetics, skincare, and hair care formulations, strengthening product portfolios and market presence globally.

The cetyl palmitate market accounts for a modest yet notable share across its parent markets, reflecting its niche yet essential role in various industries. Within the specialty chemicals market, it represents approximately 2.5% of total value, while in the cosmetic ingredients market, it holds around 4.2% due to its widespread use as an emollient. In the personal care ingredients segment, its share is estimated at 3.8%, and about 1.9% in the industrial lubricants market. The pharmaceutical excipients market sees a 2.3% share, while in food additives, it accounts for roughly 1.5%. In the oleochemicals sector, its presence is approximately 3.1%.

The market is witnessing growth due to increased demand for naturally derived, biodegradable emollients in cosmetic and personal care products. Innovations are focused on eco-friendly sourcing from plant oils, improving product stability and texture, and reducing environmental impact. Developments include advanced formulation technologies, enhanced bioavailability, and multifunctional applications in creams, lotions, and hair care. Regulatory approvals for naturally derived ingredients in Europe and North America also support expansion. Current trends highlight clean-label formulations, cruelty-free certifications, and the integration of cetyl palmitate into organic and vegan personal care products, driving global adoption.

Why is the Cetyl Palmitate Market Growing?

The cetyl palmitate market is being driven by rising consumer demand for naturally derived, biodegradable ingredients in cosmetic and personal care products. Its emollient and emulsifying properties make it highly suitable for creams, lotions, and hair care formulations, offering smooth texture, improved skin hydration, and product stability.

Increasing awareness of clean-label and cruelty-free products is further supporting adoption, particularly in premium skincare, organic cosmetics, and personal hygiene categories. Regulatory approvals in regions such as North America and Europe for naturally sourced esters are also fostering market expansion.

As sustainable and eco-friendly personal care trends gain momentum, manufacturers are prioritizing ingredient safety, multifunctionality, and high-performance formulations. With consumer focus on natural and effective skincare solutions, cetyl palmitate is increasingly integrated across cosmetic and personal care applications, ensuring steady growth in both emerging and developed markets globally.

Cetyl Palmitate Market Analysis by Top Investment Segment

The market is segmented by product type, hair type, application, distribution channel, and region. By product type, the market is divided into shampoos & conditioners, creams & lotions, lipsticks & balms. By hair type, the market is classified into emulsifier, stabilizer, and skin conditioner. By application, the market is bifurcated into cosmetics and personal care, and the pharmaceutical industry. Based on distribution channel, the market is bifurcated into online and offline. Regionally, the market is classified into North America, Europe, Asia-Pacific, Latin America, Japan and the Middle East & Africa.
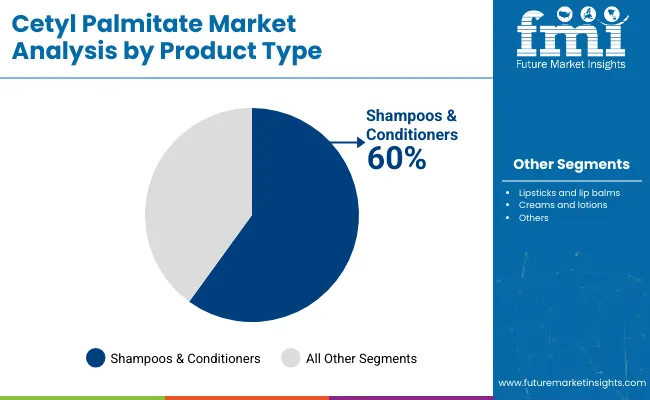
By Product Type, Shampoos & Conditioners Segment Accounts for 60% of the Market Share

Cetyl Almitate Market By Product

The shampoos & conditioners segment holds a commanding 60% share of the product type category, primarily due to cetyl palmitate’s superior emollient and conditioning properties that enhance hair texture, manageability, and shine. It is widely incorporated into formulations to deliver smoothness and softness, particularly in premium and organic hair care products.

Increasing consumer demand for naturally derived ingredients and multifunctional products is accelerating the adoption of cetyl palmitate in shampoos and conditioners. The ingredient’s ability to improve lather, viscosity, and overall sensory experience makes it a preferred choice for formulators seeking high-performance, eco-friendly hair care solutions.

Companies are investing in R&D to optimize cetyl palmitate concentrations for diverse hair types, including dry, damaged, and color-treated hair, ensuring both efficacy and compliance with regulatory and sustainability standards. This segment is poised to maintain robust growth, supported by rising awareness of hair wellness and clean-label preferences.
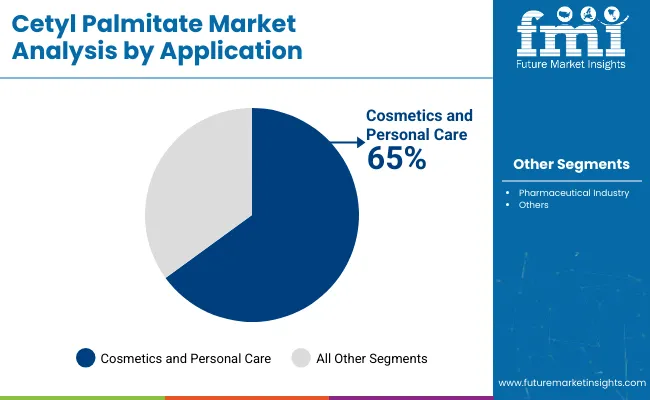
By Application, Cosmetics and Personal Care Segment Accounts for 65% of the Market Share

Cetyl Almitate Market By Application

Cosmetics and personal care remain the leading application segment, commanding 65% of the market share, as cetyl palmitate is extensively used in creams, lotions, body butters, and serums. Its emollient, moisturizing, and skin-conditioning properties make it indispensable for formulations that require smooth texture, enhanced spreadability, and skin hydration.

The surge in demand for clean-label, vegan, and cruelty-free cosmetic products has further strengthened cetyl palmitate’s adoption. Its compatibility with other natural ingredients and stability in diverse formulations allows manufacturers to meet consumer expectations for high-quality, sustainable personal care solutions.

Ongoing product innovations, including multifunctional skincare offerings and enhanced bioavailability technologies, are driving investment in this segment. Regulatory approvals for naturally sourced esters in key markets such as North America and Europe also support continued growth, positioning cosmetics and personal care as a core driver for the cetyl palmitate market from 2025 to 2035.

What are the Drivers, Restraints, and Key Trends of the Cetyl Palmitate Market?

In 2025, global cetyl palmitate demand is projected to reach USD 381.0 million, driven by its broad applications in cosmetics, personal care, and hair care formulations. Its emollient, moisturizing, and stabilizing properties make it a preferred choice in creams, lotions, shampoos, conditioners, and serums. Manufacturers are increasingly shifting toward sustainably sourced cetyl palmitate from palm and coconut oils to meet demand for natural, biodegradable, and eco-friendly ingredients. Innovations targeting skin hydration, hair conditioning, and texture enhancement are reinforcing adoption, while premium product lines integrate cetyl palmitate for smoothness, luster, and long-lasting moisture retention. North America and Europe remain key growth regions, supported by strong quality standards and high consumer spending, driving a steady CAGR of 3.5%.

Sustainability, Multi-functionality, and Premium Formulations Drive Cetyl Palmitate Adoption

Cosmetic and personal care brands are incorporating cetyl palmitate to enhance product performance, stability, and texture while aligning with clean-label, vegan, and cruelty-free trends. Its multifunctional nature allows formulators to replace multiple ingredients with a single, stable emollient, streamlining production and boosting product appeal. In premium skincare, cetyl palmitate delivers superior hydration and a smooth finish, while in hair care it improves conditioning and manageability. Formulations using sustainably sourced cetyl palmitate support eco-conscious branding, increasing adoption among leading global cosmetic houses. Collaborations between ingredient suppliers and beauty brands are producing ready-to-use, high-performance blends that reduce formulation time while maintaining consistent quality across product lines.

High Raw Material Costs, Feedstock Volatility, and Regulatory Compliance Restrict Expansion

Market growth is constrained by the elevated cost of sustainably sourced plant oils and the limited availability of high-purity cetyl palmitate. Price fluctuations in palm and coconut oil feedstocks can raise formulation costs by 10-15%, creating procurement and budget challenges for manufacturers. Regulatory compliance in North America and Europe requires extensive quality testing, extending development cycles by 3-5 weeks. Complex processing and purification requirements increase production overhead, while variability in emollient performance between batches limits scalability for cost-sensitive product ranges. These factors, combined with competition for sustainable raw materials, create entry barriers for smaller producers, tempering expansion despite strong demand for multifunctional cosmetic ingredients.
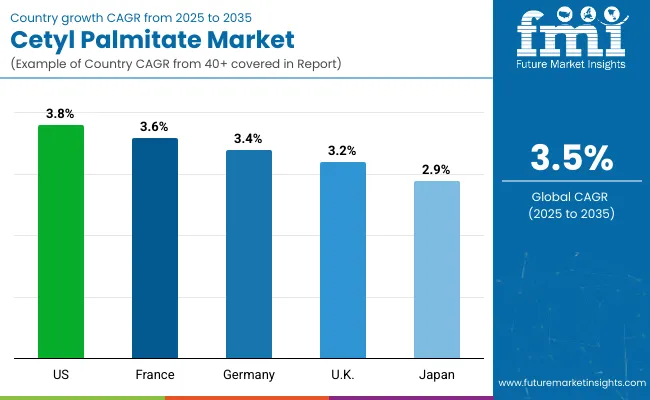
Cetyl Palmitate Market Analysis by Top Countries

Cetyl Almitate Market By Country

Countries CAGR (2025 to 2035)
USA 3.8%
France 3.6%
Germany 3.4%
UK 3.2%
Japan 2.9%

The cetyl palmitate market exhibits varying growth dynamics across leading countries, reflecting differences in regulatory frameworks, consumer preferences, and industry maturity. The USA leads with a CAGR of 3.8%, supported by high disposable income, widespread cosmetic usage, and strong adoption of natural ingredients. France and Germany follow with CAGRs of 3.6% and 3.4%, driven by stringent quality standards and increasing demand for clean-label personal care products. The UK and Japan, with CAGRs of 3.2% and 2.9%, reflect moderate growth influenced by consumer trends toward premium and sustainable formulations. These differences highlight regional opportunities for market penetration and product innovation.

The report covers an in-depth analysis of 40+ countries; five top-performing OECD countries are highlighted below.

Market Expansion in the Cetyl Palmitate Market in the USA

Revenue from cetyl palmitate in the USA is projected to rise at a CAGR of 3.8% from 2025 to 2035, led by robust demand in cosmetics, personal care, and premium hair care formulations. Increasing consumer preference for natural, biodegradable, and multifunctional ingredients is influencing product adoption, while manufacturers focus on eco-friendly sourcing and innovative formulation development. Major urban centers such as New York, Los Angeles, and Chicago serve as hubs for high-value cosmetic and personal care manufacturing, boosting demand for high-purity cetyl palmitate across diverse product categories.

Key Statistics:

  • 35% of personal care formulations include cetyl palmitate in 2025
  • $120 million invested in R&D for high-purity cetyl palmitate formulations in 2025
  • 42 cosmetic and hair care brands adopting cetyl palmitate across the USA

Market Development in the Cetyl Palmitate Market in France

The cetyl palmitate market in France is estimated to strengthen at a CAGR of 3.6% from 2025 to 2035, supported by strong demand for premium cosmetics and skincare products in Paris, Lyon, and Marseille. French consumers prioritize natural, cruelty-free, and multifunctional ingredients, prompting manufacturers to integrate cetyl palmitate into creams, lotions, and serums for improved texture and skin-conditioning benefits. Regulatory compliance with EU cosmetic standards enhances product safety and quality, ensuring sustained market growth. Partnerships between ingredient suppliers and cosmetic brands continue to strengthen France’s position in high-end cosmetic manufacturing.

Key Statistics

  • 28% of French cosmetic formulations contain cetyl palmitate in 2025
  • 18 innovation projects focusing on sustainable sourcing completed in 2025
  • 35 partnerships between ingredient suppliers and cosmetic brands established

Innovation Leadership in the Cetyl Palmitate Market in Germany

The sales of cetyl palmitate in Germany are expected to flourish at a CAGR of 3.4% from 2025 to 2035, fueled by functional and organic cosmetic innovations in Berlin, Hamburg, and Frankfurt. Manufacturers are emphasizing high-quality, naturally derived ingredients to meet the rising demand for clean-label skincare, hair care, and personal care formulations. The country’s cosmetic industry benefits from advanced processing facilities, organic certification trends, and a strong focus on sustainable sourcing, positioning Germany as a leader in natural ester innovation for premium personal care applications.

Key Statistics

  • 32% of cosmetic applications in Germany incorporate cetyl palmitate in 2025
  • 22 specialized facilities focus on natural ester processing
  • 45 R&D collaborations between ingredient and cosmetic companies

Growth Assessment for Cetyl Palmitate Market in the UK

Revenue from cetyl palmitate in the UK is projected to expand at a CAGR of 3.2% from 2025 to 2035, slightly below the global average. Consumer interest in sustainable, natural, and multifunctional ingredients is boosting demand in creams, lotions, and hair care formulations. However, limited domestic production capacity and reliance on imports post-Brexit present supply chain challenges. Despite these constraints, premium personal care brands in London, Manchester, and Edinburgh continue to adopt cetyl palmitate for high-quality product development, with investments in sustainable sourcing and eco-certifications driving growth potential.

Key Statistics

  • 25% of UK cosmetic formulations include cetyl palmitate in 2025
  • $18 million invested in sustainable sourcing projects
  • 27 personal care brands adopting cetyl palmitate across UK markets

Japan Cetyl Palmitate Market Analysis by Application

The demand for cetyl palmitate in Japan is anticipated to grow at a CAGR of 2.9% from 2025 to 2035, reflecting steady demand for high-quality skincare and premium personal care products. Urban centers such as Tokyo, Osaka, and Kyoto serve as key consumption hubs, with strong consumer preference for multifunctional, naturally derived ingredients that deliver skin-conditioning and anti-aging benefits. Domestic brands are investing in advanced formulation techniques and sustainable sourcing, supported by a cultural emphasis on quality, purity, and innovation in cosmetics.

Key Statistics
  • 22% of cosmetic and personal care formulations incorporate cetyl palmitate in 2025
  • 15 R&D projects focused on enhanced emulsification and moisturizing properties
  • $32 million invested in sustainable ingredient sourcing and certification

Competitive Landscape of the Cetyl Palmitate Market

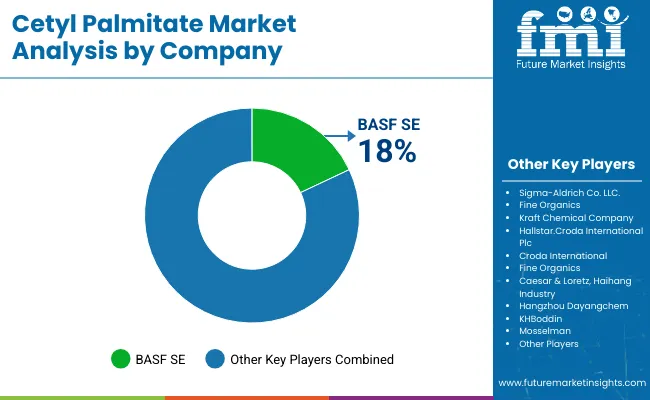
Cetyl Almitate Market By Company

The cetyl palmitate market is moderately consolidated, comprising a combination of global specialty chemical suppliers, ingredient-focused companies, and regional producers offering diverse personal care and cosmetic solutions. Leading players such as Sigma-Aldrich Co. LLC., Croda International Plc, BASF SE, and Fine Organics dominate the market, leveraging extensive R&D capabilities, global distribution networks, and strong relationships with cosmetic and personal care manufacturers. Their competitive advantage lies in high-purity cetyl palmitate production, scalable supply chains, and advanced formulation support for multifunctional products in skin care, hair care, and cosmetic applications.

Companies like Hallstar and Kraft Chemical Company differentiate themselves through product customization, regulatory compliance services, and development of multifunctional cetyl palmitate derivatives that enhance skin hydration, emolliency, and texture. These players focus on integrating eco-friendly sourcing, clean-label certifications, and stable, high-performance formulations to meet stringent consumer and regulatory demands across North America, Europe, and Asia-Pacific markets. Their strategic focus on niche applications such as organic personal care and premium hair care products positions them competitively against larger chemical suppliers.

Regional and mid-sized players such as Evonik Industries, Caesar & Loretz, Hangzhou Dayangchem, and BioCell Technology concentrate on localized production, sustainable sourcing, and specialized product offerings, enabling targeted penetration in emerging markets. Entry barriers remain significant due to high raw material costs, stringent regulatory approvals, and the technological expertise required for stable, multifunctional formulations. Market competitiveness increasingly depends on formulation innovation, purity and consistency of cetyl palmitate, sustainability practices, and strong collaboration with cosmetic and personal care manufacturers to deliver application-ready solutions across diverse product categories.

Scope of Report

Item Value
Quantitative Units USD 381.0 Million
Product Type Shampoos and Conditioners, Lipsticks and Lip Balms, Creams and Lotions.
Hair Type Emulsifier, Stabilizer, Skin Conditioner
Application Cosmetics and Personal Care, Pharmaceutical Industry
Distribution Channel Online and Offline
Regions Covered North America, Latin America, Asia Pacific, Eastern Europe, Western Europe, Japan
Country Covered United States, Canada, United Kingdom, Germany, France, China, Japan, South Korea, Brazil, Australia and 40+ countries
Key Companies Profiled Sigma-Aldrich Co. LLC, Fine Organics, Kraft Chemical Company, Hallstar, Croda International Plc, BASF SE, Caesar & Loretz, Haihang Industry, Hangzhou Dayangchem, KHBoddin, Mosselman, Evonik Industries, Oleon NV, BioCell Technology, Taiwan Njc Corporation, DeWolf Chemical (an Azelis Americas company), Ashland
Additional Attributes Dollar sales by application and purity grade, regional demand trends, competitive landscape, consumer preference shifts toward plant-derived cetyl palmitate, integration of sustainable sourcing and green chemistry practices, innovations in esterification processes, and advancements in product stability for extended shelf life across end-use industries

Key Segments

By product type:

  • Shampoos & Conditioners
  • Lipsticks and lip balms
  • Creams and lotions

By hair type:

  • Emulsifier
  • Stabilizer
  • Skin Conditioner

By Application:

  • Cosmetics And Personal Care
  • Pharmaceutical Industry

By distribution channel:

  • Online
  • Offline

By region:

  • North America
  • Latin America
  • Western Europe
  • Eastern Europe
  • East Asia
  • South Asia & Pacific
  • Middle East and Africa

Table of Content

  1. Executive Summary
    • Global Market Outlook
    • Demand-side Trends
    • Supply-side Trends
    • Technology Roadmap Analysis
    • Analysis and Recommendations
  2. Market Overview
    • Market Coverage / Taxonomy
    • Market Definition / Scope / Limitations
  3. Market Background
    • Market Dynamics
      • Drivers
      • Restraints
      • Opportunity
      • Trends
    • Scenario Forecast
      • Demand in Optimistic Scenario
      • Demand in Likely Scenario
      • Demand in Conservative Scenario
    • Opportunity Map Analysis
    • Product Life Cycle Analysis
    • Supply Chain Analysis
      • Supply Side Participants and their Roles
        • Producers
        • Mid-Level Participants (Traders/ Agents/ Brokers)
        • Wholesalers and Distributors
      • Value Added and Value Created at Node in the Supply Chain
      • List of Raw Material Suppliers
      • List of Existing and Potential Buyer’s
    • Investment Feasibility Matrix
    • Value Chain Analysis
      • Profit Margin Analysis
      • Wholesalers and Distributors
      • Retailers
    • PESTLE and Porter’s Analysis
    • Regulatory Landscape
      • By Key Regions
      • By Key Countries
    • Regional Parent Market Outlook
    • Production and Consumption Statistics
    • Import and Export Statistics
  4. Global Market Analysis 2020 to 2024 and Forecast, 2025 to 2035
    • Historical Market Size Value (USD Million) & Volume (Metric Tons) Analysis, 2020 to 2024
    • Current and Future Market Size Value (USD Million) & Volume (Metric Tons) Projections, 2025 to 2035
      • Y-o-Y Growth Trend Analysis
      • Absolute $ Opportunity Analysis
  5. Global Market Pricing Analysis 2020 to 2024 and Forecast 2025 to 2035
  6. Global Market Analysis 2020 to 2024 and Forecast 2025 to 2035, By Product Type
    • Introduction / Key Findings
    • Historical Market Size Value (USD Million) & Volume (Metric Tons) Analysis By Product Type, 2020 to 2024
    • Current and Future Market Size Value (USD Million) & Volume (Metric Tons) Analysis and Forecast By Product Type, 2025 to 2035
      • Shampoos & Conditioners
      • Lipsticks and lip balms
      • Creams and lotions
    • Y-o-Y Growth Trend Analysis By Product Type, 2020 to 2024
    • Absolute $ Opportunity Analysis By Product Type, 2025 to 2035
  7. Global Market Analysis 2020 to 2024 and Forecast 2025 to 2035, By Hair Type
    • Introduction / Key Findings
    • Historical Market Size Value (USD Million) & Volume (Metric Tons) Analysis By Hair Type, 2020 to 2024
    • Current and Future Market Size Value (USD Million) & Volume (Metric Tons) Analysis and Forecast By Hair Type, 2025 to 2035
      • Emulsifier
      • Stabilizer
      • Skin Conditioner
    • Y-o-Y Growth Trend Analysis By Hair Type, 2020 to 2024
    • Absolute $ Opportunity Analysis By Hair Type, 2025 to 2035
  8. Global Market Analysis 2020 to 2024 and Forecast 2025 to 2035, By Application
    • Introduction / Key Findings
    • Historical Market Size Value (USD Million) & Volume (Metric Tons) Analysis By Application, 2020 to 2024
    • Current and Future Market Size Value (USD Million) & Volume (Metric Tons) Analysis and Forecast By Application, 2025 to 2035
      • Cosmetics and Personal Care
      • Pharmaceutical Industry
    • Y-o-Y Growth Trend Analysis By Application, 2020 to 2024
    • Absolute $ Opportunity Analysis By Application, 2025 to 2035
  9. Global Market Analysis 2020 to 2024 and Forecast 2025 to 2035, By Distribution Channel
    • Introduction / Key Findings
    • Historical Market Size Value (USD Million) & Volume (Metric Tons) Analysis By Distribution Channel, 2020 to 2024
    • Current and Future Market Size Value (USD Million) & Volume (Metric Tons) Analysis and Forecast By Distribution Channel, 2025 to 2035
      • Online
      • Offline
    • Y-o-Y Growth Trend Analysis By Distribution Channel, 2020 to 2024
    • Absolute $ Opportunity Analysis By Distribution Channel, 2025 to 2035
  10. Global Market Analysis 2020 to 2024 and Forecast 2025 to 2035, By Region
    • Introduction
    • Historical Market Size Value (USD Million) & Volume (Metric Tons) Analysis By Region, 2020 to 2024
    • Current Market Size Value (USD Million) & Volume (Metric Tons) Analysis and Forecast By Region, 2025 to 2035
      • North America
      • Latin America
      • Western Europe
      • Eastern Europe
      • East Asia
      • South Asia & Pacific
      • Middle East and Africa
    • Market Attractiveness Analysis By Region
  11. North America Market Analysis 2020 to 2024 and Forecast 2025 to 2035, By Country
    • Historical Market Size Value (USD Million) & Volume (Metric Tons) Trend Analysis By Market Taxonomy, 2020 to 2024
    • Market Size Value (USD Million) & Volume (Metric Tons) Forecast By Market Taxonomy, 2025 to 2035
      • By Country
        • USA
        • Canada
        • Mexico
      • By Product Type
      • By Hair Type
      • By Application
      • By Distribution Channel
    • Market Attractiveness Analysis
      • By Country
      • By Product Type
      • By Hair Type
      • By Application
      • By Distribution Channel
    • Key Takeaways
  12. Latin America Market Analysis 2020 to 2024 and Forecast 2025 to 2035, By Country
    • Historical Market Size Value (USD Million) & Volume (Metric Tons) Trend Analysis By Market Taxonomy, 2020 to 2024
    • Market Size Value (USD Million) & Volume (Metric Tons) Forecast By Market Taxonomy, 2025 to 2035
      • By Country
        • Brazil
        • Argentina
        • Rest of LATAM
      • By Product Type
      • By Hair Type
      • By Application
      • By Distribution Channel
    • Market Attractiveness Analysis
      • By Country
      • By Product Type
      • By Hair Type
      • By Application
      • By Distribution Channel
    • Key Takeaways
  13. Western Europe Market Analysis 2020 to 2024 and Forecast 2025 to 2035, By Country
    • Historical Market Size Value (USD Million) & Volume (Metric Tons) Trend Analysis By Market Taxonomy, 2020 to 2024
    • Market Size Value (USD Million) & Volume (Metric Tons) Forecast By Market Taxonomy, 2025 to 2035
      • By Country
        • Germany
        • Italy
        • France
        • UK
        • Spain
        • BENELUX
        • Nordic
        • Rest of W.Europe
      • By Product Type
      • By Hair Type
      • By Application
      • By Distribution Channel
    • Market Attractiveness Analysis
      • By Country
      • By Product Type
      • By Hair Type
      • By Application
      • By Distribution Channel
    • Key Takeaways
  14. Eastern Europe Market Analysis 2020 to 2024 and Forecast 2025 to 2035, By Country
    • Historical Market Size Value (USD Million) & Volume (Metric Tons) Trend Analysis By Market Taxonomy, 2020 to 2024
    • Market Size Value (USD Million) & Volume (Metric Tons) Forecast By Market Taxonomy, 2025 to 2035
      • By Country
        • Russia
        • Hungary
        • Poland
        • Balkan & Baltics
        • Rest of E. Europe
      • By Product Type
      • By Hair Type
      • By Application
      • By Distribution Channel
    • Market Attractiveness Analysis
      • By Country
      • By Product Type
      • By Hair Type
      • By Application
      • By Distribution Channel
    • Key Takeaways
  15. East Asia Market Analysis 2020 to 2024 and Forecast 2025 to 2035, By Country
    • Historical Market Size Value (USD Million) & Volume (Metric Tons) Trend Analysis By Market Taxonomy, 2020 to 2024
    • Market Size Value (USD Million) & Volume (Metric Tons) Forecast By Market Taxonomy, 2025 to 2035
      • By Country
        • China
        • Japan
        • South Korea
      • By Product Type
      • By Hair Type
      • By Application
      • By Distribution Channel
    • Market Attractiveness Analysis
      • By Country
      • By Product Type
      • By Hair Type
      • By Application
      • By Distribution Channel
    • Key Takeaways
  16. South Asia & Pacific Market Analysis 2020 to 2024 and Forecast 2025 to 2035, By Country
    • Historical Market Size Value (USD Million) & Volume (Metric Tons) Trend Analysis By Market Taxonomy, 2020 to 2024
    • Market Size Value (USD Million) & Volume (Metric Tons) Forecast By Market Taxonomy, 2025 to 2035
      • By Country
        • India
        • Australia & New Zealand
        • ASEAN
        • Rest of SAP
      • By Product Type
      • By Hair Type
      • By Application
      • By Distribution Channel
    • Market Attractiveness Analysis
      • By Country
      • By Product Type
      • By Hair Type
      • By Application
      • By Distribution Channel
    • Key Takeaways
  17. Middle East and Africa Market Analysis 2020 to 2024 and Forecast 2025 to 2035, By Country
    • Historical Market Size Value (USD Million) & Volume (Metric Tons) Trend Analysis By Market Taxonomy, 2020 to 2024
    • Market Size Value (USD Million) & Volume (Metric Tons) Forecast By Market Taxonomy, 2025 to 2035
      • By Country
        • GCC Countries
        • Northern Africa
        • South Africa
        • Turkiye
        • Rest of MEA
      • By Product Type
      • By Hair Type
      • By Application
      • By Distribution Channel
    • Market Attractiveness Analysis
      • By Country
      • By Product Type
      • By Hair Type
      • By Application
      • By Distribution Channel
    • Key Takeaways
  18. Key Countries Market Analysis
    • USA
      • Pricing Analysis
      • Market Share Analysis, 2024
        • By Product Type
        • By Hair Type
        • By Application
        • By Distribution Channel
    • Canada
      • Pricing Analysis
      • Market Share Analysis, 2024
        • By Product Type
        • By Hair Type
        • By Application
        • By Distribution Channel
    • Brazil
      • Pricing Analysis
      • Market Share Analysis, 2024
        • By Product Type
        • By Hair Type
        • By Application
        • By Distribution Channel
    • Mexico
      • Pricing Analysis
      • Market Share Analysis, 2024
        • By Product Type
        • By Hair Type
        • By Application
        • By Distribution Channel
    • Argentina
      • Pricing Analysis
      • Market Share Analysis, 2024
        • By Product Type
        • By Hair Type
        • By Application
        • By Distribution Channel
  19. Market Structure Analysis
    • Competition Dashboard
    • Competition Benchmarking
    • Market Share Analysis of Top Players
      • By Regional
      • By Product Type
      • By Hair Type
      • By Application
      • By Distribution Channel
  20. Competition Analysis
    • Competition Deep Dive
      • Sigma-Aldrich Co. LLC.
        • Overview
        • Product Portfolio
        • Profitability by Market Segments (Product/Age /Sales Channel/Region)
        • Sales Footprint
        • Strategy Overview
          • Marketing Strategy
          • Product Strategy
          • Channel Strategy
      • Fine Organics
        • Overview
        • Product Portfolio
        • Profitability by Market Segments (Product/Age /Sales Channel/Region)
        • Sales Footprint
        • Strategy Overview
          • Marketing Strategy
          • Product Strategy
          • Channel Strategy
      • Kraft Chemical Company
        • Overview
        • Product Portfolio
        • Profitability by Market Segments (Product/Age /Sales Channel/Region)
        • Sales Footprint
        • Strategy Overview
          • Marketing Strategy
          • Product Strategy
          • Channel Strategy
      • Hallstar.Croda International Plc
        • Overview
        • Product Portfolio
        • Profitability by Market Segments (Product/Age /Sales Channel/Region)
        • Sales Footprint
        • Strategy Overview
          • Marketing Strategy
          • Product Strategy
          • Channel Strategy
      • Croda International
        • Overview
        • Product Portfolio
        • Profitability by Market Segments (Product/Age /Sales Channel/Region)
        • Sales Footprint
        • Strategy Overview
          • Marketing Strategy
          • Product Strategy
          • Channel Strategy
      • Fine Organics
        • Overview
        • Product Portfolio
        • Profitability by Market Segments (Product/Age /Sales Channel/Region)
        • Sales Footprint
        • Strategy Overview
          • Marketing Strategy
          • Product Strategy
          • Channel Strategy
      • BASF SE
        • Overview
        • Product Portfolio
        • Profitability by Market Segments (Product/Age /Sales Channel/Region)
        • Sales Footprint
        • Strategy Overview
          • Marketing Strategy
          • Product Strategy
          • Channel Strategy
      • Caesar & Loretz, Haihang Industry
        • Overview
        • Product Portfolio
        • Profitability by Market Segments (Product/Age /Sales Channel/Region)
        • Sales Footprint
        • Strategy Overview
          • Marketing Strategy
          • Product Strategy
          • Channel Strategy
      • Hangzhou Dayangchem
        • Overview
        • Product Portfolio
        • Profitability by Market Segments (Product/Age /Sales Channel/Region)
        • Sales Footprint
        • Strategy Overview
          • Marketing Strategy
          • Product Strategy
          • Channel Strategy
      • KHBoddin
        • Overview
        • Product Portfolio
        • Profitability by Market Segments (Product/Age /Sales Channel/Region)
        • Sales Footprint
        • Strategy Overview
          • Marketing Strategy
          • Product Strategy
          • Channel Strategy
      • Mosselman
        • Overview
        • Product Portfolio
        • Profitability by Market Segments (Product/Age /Sales Channel/Region)
        • Sales Footprint
        • Strategy Overview
          • Marketing Strategy
          • Product Strategy
          • Channel Strategy
      • Evonik Industries
        • Overview
        • Product Portfolio
        • Profitability by Market Segments (Product/Age /Sales Channel/Region)
        • Sales Footprint
        • Strategy Overview
          • Marketing Strategy
          • Product Strategy
          • Channel Strategy
      • Oleon NV
        • Overview
        • Product Portfolio
        • Profitability by Market Segments (Product/Age /Sales Channel/Region)
        • Sales Footprint
        • Strategy Overview
          • Marketing Strategy
          • Product Strategy
          • Channel Strategy
      • BioCell Technology
        • Overview
        • Product Portfolio
        • Profitability by Market Segments (Product/Age /Sales Channel/Region)
        • Sales Footprint
        • Strategy Overview
          • Marketing Strategy
          • Product Strategy
          • Channel Strategy
      • Twiwan Njc Corporation.
        • Overview
        • Product Portfolio
        • Profitability by Market Segments (Product/Age /Sales Channel/Region)
        • Sales Footprint
        • Strategy Overview
          • Marketing Strategy
          • Product Strategy
          • Channel Strategy
      • DeWolf Chemical an Azelis Americas company
        • Overview
        • Product Portfolio
        • Profitability by Market Segments (Product/Age /Sales Channel/Region)
        • Sales Footprint
        • Strategy Overview
          • Marketing Strategy
          • Product Strategy
          • Channel Strategy
      • Ashland
        • Overview
        • Product Portfolio
        • Profitability by Market Segments (Product/Age /Sales Channel/Region)
        • Sales Footprint
        • Strategy Overview
          • Marketing Strategy
          • Product Strategy
          • Channel Strategy
  21. Assumptions & Acronyms Used
  22. Research Methodology

List of Tables

  • Table 1: Global Market Value (USD Million) Forecast by Region, 2020-2035
  • Table 2: Global Market Volume (Metric Tons) Forecast by Region, 2020-2035
  • Table 3: Global Market Value (USD Million) Forecast by Product Type, 2020-2035
  • Table 4: Global Market Volume (Metric Tons) Forecast by Product Type, 2020-2035
  • Table 5: Global Market Value (USD Million) Forecast by Hair Type, 2020-2035
  • Table 6: Global Market Volume (Metric Tons) Forecast by Hair Type, 2020-2035
  • Table 7: Global Market Value (USD Million) Forecast by Application, 2020-2035
  • Table 8: Global Market Volume (Metric Tons) Forecast by Application, 2020-2035
  • Table 9: Global Market Value (USD Million) Forecast by Distribution Channel, 2020-2035
  • Table 10: Global Market Volume (Metric Tons) Forecast by Distribution Channel, 2020-2035
  • Table 11: North America Market Value (USD Million) Forecast by Country, 2020-2035
  • Table 12: North America Market Volume (Metric Tons) Forecast by Country, 2020-2035
  • Table 13: North America Market Value (USD Million) Forecast by Product Type, 2020-2035
  • Table 14: North America Market Volume (Metric Tons) Forecast by Product Type, 2020-2035
  • Table 15: North America Market Value (USD Million) Forecast by Hair Type, 2020-2035
  • Table 16: North America Market Volume (Metric Tons) Forecast by Hair Type, 2020-2035
  • Table 17: North America Market Value (USD Million) Forecast by Application, 2020-2035
  • Table 18: North America Market Volume (Metric Tons) Forecast by Application, 2020-2035
  • Table 19: North America Market Value (USD Million) Forecast by Distribution Channel, 2020-2035
  • Table 20: North America Market Volume (Metric Tons) Forecast by Distribution Channel, 2020-2035
  • Table 21: Latin America Market Value (USD Million) Forecast by Country, 2020-2035
  • Table 22: Latin America Market Volume (Metric Tons) Forecast by Country, 2020-2035
  • Table 23: Latin America Market Value (USD Million) Forecast by Product Type, 2020-2035
  • Table 24: Latin America Market Volume (Metric Tons) Forecast by Product Type, 2020-2035
  • Table 25: Latin America Market Value (USD Million) Forecast by Hair Type, 2020-2035
  • Table 26: Latin America Market Volume (Metric Tons) Forecast by Hair Type, 2020-2035
  • Table 27: Latin America Market Value (USD Million) Forecast by Application, 2020-2035
  • Table 28: Latin America Market Volume (Metric Tons) Forecast by Application, 2020-2035
  • Table 29: Latin America Market Value (USD Million) Forecast by Distribution Channel, 2020-2035
  • Table 30: Latin America Market Volume (Metric Tons) Forecast by Distribution Channel, 2020-2035
  • Table 31: Western Europe Market Value (USD Million) Forecast by Country, 2020-2035
  • Table 32: Western Europe Market Volume (Metric Tons) Forecast by Country, 2020-2035
  • Table 33: Western Europe Market Value (USD Million) Forecast by Product Type, 2020-2035
  • Table 34: Western Europe Market Volume (Metric Tons) Forecast by Product Type, 2020-2035
  • Table 35: Western Europe Market Value (USD Million) Forecast by Hair Type, 2020-2035
  • Table 36: Western Europe Market Volume (Metric Tons) Forecast by Hair Type, 2020-2035
  • Table 37: Western Europe Market Value (USD Million) Forecast by Application, 2020-2035
  • Table 38: Western Europe Market Volume (Metric Tons) Forecast by Application, 2020-2035
  • Table 39: Western Europe Market Value (USD Million) Forecast by Distribution Channel, 2020-2035
  • Table 40: Western Europe Market Volume (Metric Tons) Forecast by Distribution Channel, 2020-2035
  • Table 41: Eastern Europe Market Value (USD Million) Forecast by Country, 2020-2035
  • Table 42: Eastern Europe Market Volume (Metric Tons) Forecast by Country, 2020-2035
  • Table 43: Eastern Europe Market Value (USD Million) Forecast by Product Type, 2020-2035
  • Table 44: Eastern Europe Market Volume (Metric Tons) Forecast by Product Type, 2020-2035
  • Table 45: Eastern Europe Market Value (USD Million) Forecast by Hair Type, 2020-2035
  • Table 46: Eastern Europe Market Volume (Metric Tons) Forecast by Hair Type, 2020-2035
  • Table 47: Eastern Europe Market Value (USD Million) Forecast by Application, 2020-2035
  • Table 48: Eastern Europe Market Volume (Metric Tons) Forecast by Application, 2020-2035
  • Table 49: Eastern Europe Market Value (USD Million) Forecast by Distribution Channel, 2020-2035
  • Table 50: Eastern Europe Market Volume (Metric Tons) Forecast by Distribution Channel, 2020-2035
  • Table 51: East Asia Market Value (USD Million) Forecast by Country, 2020-2035
  • Table 52: East Asia Market Volume (Metric Tons) Forecast by Country, 2020-2035
  • Table 53: East Asia Market Value (USD Million) Forecast by Product Type, 2020-2035
  • Table 54: East Asia Market Volume (Metric Tons) Forecast by Product Type, 2020-2035
  • Table 55: East Asia Market Value (USD Million) Forecast by Hair Type, 2020-2035
  • Table 56: East Asia Market Volume (Metric Tons) Forecast by Hair Type, 2020-2035
  • Table 57: East Asia Market Value (USD Million) Forecast by Application, 2020-2035
  • Table 58: East Asia Market Volume (Metric Tons) Forecast by Application, 2020-2035
  • Table 59: East Asia Market Value (USD Million) Forecast by Distribution Channel, 2020-2035
  • Table 60: East Asia Market Volume (Metric Tons) Forecast by Distribution Channel, 2020-2035
  • Table 61: South Asia & Pacific Market Value (USD Million) Forecast by Country, 2020-2035
  • Table 62: South Asia & Pacific Market Volume (Metric Tons) Forecast by Country, 2020-2035
  • Table 63: South Asia & Pacific Market Value (USD Million) Forecast by Product Type, 2020-2035
  • Table 64: South Asia & Pacific Market Volume (Metric Tons) Forecast by Product Type, 2020-2035
  • Table 65: South Asia & Pacific Market Value (USD Million) Forecast by Hair Type, 2020-2035
  • Table 66: South Asia & Pacific Market Volume (Metric Tons) Forecast by Hair Type, 2020-2035
  • Table 67: South Asia & Pacific Market Value (USD Million) Forecast by Application, 2020-2035
  • Table 68: South Asia & Pacific Market Volume (Metric Tons) Forecast by Application, 2020-2035
  • Table 69: South Asia & Pacific Market Value (USD Million) Forecast by Distribution Channel, 2020-2035
  • Table 70: South Asia & Pacific Market Volume (Metric Tons) Forecast by Distribution Channel, 2020-2035
  • Table 71: Middle East and Africa Market Value (USD Million) Forecast by Country, 2020-2035
  • Table 72: Middle East and Africa Market Volume (Metric Tons) Forecast by Country, 2020-2035
  • Table 73: Middle East and Africa Market Value (USD Million) Forecast by Product Type, 2020-2035
  • Table 74: Middle East and Africa Market Volume (Metric Tons) Forecast by Product Type, 2020-2035
  • Table 75: Middle East and Africa Market Value (USD Million) Forecast by Hair Type, 2020-2035
  • Table 76: Middle East and Africa Market Volume (Metric Tons) Forecast by Hair Type, 2020-2035
  • Table 77: Middle East and Africa Market Value (USD Million) Forecast by Application, 2020-2035
  • Table 78: Middle East and Africa Market Volume (Metric Tons) Forecast by Application, 2020-2035
  • Table 79: Middle East and Africa Market Value (USD Million) Forecast by Distribution Channel, 2020-2035
  • Table 80: Middle East and Africa Market Volume (Metric Tons) Forecast by Distribution Channel, 2020-2035

List of Figures

  • Figure 1: Global Market Volume (Metric Tons) Forecast 2020-2035
  • Figure 2: Global Market Pricing Analysis
  • Figure 3: Global Market Value (USD Million) Forecast 2020-2035
  • Figure 4: Global Market Value Share and BPS Analysis by Product Type, 2025 and 2035
  • Figure 5: Global Market Y-o-Y Growth Comparison by Product Type, 2025-2035
  • Figure 6: Global Market Attractiveness Analysis by Product Type
  • Figure 7: Global Market Value Share and BPS Analysis by Hair Type, 2025 and 2035
  • Figure 8: Global Market Y-o-Y Growth Comparison by Hair Type, 2025-2035
  • Figure 9: Global Market Attractiveness Analysis by Hair Type
  • Figure 10: Global Market Value Share and BPS Analysis by Application, 2025 and 2035
  • Figure 11: Global Market Y-o-Y Growth Comparison by Application, 2025-2035
  • Figure 12: Global Market Attractiveness Analysis by Application
  • Figure 13: Global Market Value Share and BPS Analysis by Distribution Channel, 2025 and 2035
  • Figure 14: Global Market Y-o-Y Growth Comparison by Distribution Channel, 2025-2035
  • Figure 15: Global Market Attractiveness Analysis by Distribution Channel
  • Figure 16: Global Market Value (USD Million) Share and BPS Analysis by Region, 2025 and 2035
  • Figure 17: Global Market Y-o-Y Growth Comparison by Region, 2025-2035
  • Figure 18: Global Market Attractiveness Analysis by Region
  • Figure 19: North America Market Incremental $ Opportunity, 2025-2035
  • Figure 20: Latin America Market Incremental $ Opportunity, 2025-2035
  • Figure 21: Western Europe Market Incremental $ Opportunity, 2025-2035
  • Figure 22: Eastern Europe Market Incremental $ Opportunity, 2025-2035
  • Figure 23: East Asia Market Incremental $ Opportunity, 2025-2035
  • Figure 24: South Asia & Pacific Market Incremental $ Opportunity, 2025-2035
  • Figure 25: Middle East and Africa Market Incremental $ Opportunity, 2025-2035
  • Figure 26: North America Market Value Share and BPS Analysis by Country, 2025 and 2035
  • Figure 27: North America Market Value Share and BPS Analysis by Product Type, 2025 and 2035
  • Figure 28: North America Market Y-o-Y Growth Comparison by Product Type, 2025-2035
  • Figure 29: North America Market Attractiveness Analysis by Product Type
  • Figure 30: North America Market Value Share and BPS Analysis by Hair Type, 2025 and 2035
  • Figure 31: North America Market Y-o-Y Growth Comparison by Hair Type, 2025-2035
  • Figure 32: North America Market Attractiveness Analysis by Hair Type
  • Figure 33: North America Market Value Share and BPS Analysis by Application, 2025 and 2035
  • Figure 34: North America Market Y-o-Y Growth Comparison by Application, 2025-2035
  • Figure 35: North America Market Attractiveness Analysis by Application
  • Figure 36: North America Market Value Share and BPS Analysis by Distribution Channel, 2025 and 2035
  • Figure 37: North America Market Y-o-Y Growth Comparison by Distribution Channel, 2025-2035
  • Figure 38: North America Market Attractiveness Analysis by Distribution Channel
  • Figure 39: Latin America Market Value Share and BPS Analysis by Country, 2025 and 2035
  • Figure 40: Latin America Market Value Share and BPS Analysis by Product Type, 2025 and 2035
  • Figure 41: Latin America Market Y-o-Y Growth Comparison by Product Type, 2025-2035
  • Figure 42: Latin America Market Attractiveness Analysis by Product Type
  • Figure 43: Latin America Market Value Share and BPS Analysis by Hair Type, 2025 and 2035
  • Figure 44: Latin America Market Y-o-Y Growth Comparison by Hair Type, 2025-2035
  • Figure 45: Latin America Market Attractiveness Analysis by Hair Type
  • Figure 46: Latin America Market Value Share and BPS Analysis by Application, 2025 and 2035
  • Figure 47: Latin America Market Y-o-Y Growth Comparison by Application, 2025-2035
  • Figure 48: Latin America Market Attractiveness Analysis by Application
  • Figure 49: Latin America Market Value Share and BPS Analysis by Distribution Channel, 2025 and 2035
  • Figure 50: Latin America Market Y-o-Y Growth Comparison by Distribution Channel, 2025-2035
  • Figure 51: Latin America Market Attractiveness Analysis by Distribution Channel
  • Figure 52: Western Europe Market Value Share and BPS Analysis by Country, 2025 and 2035
  • Figure 53: Western Europe Market Value Share and BPS Analysis by Product Type, 2025 and 2035
  • Figure 54: Western Europe Market Y-o-Y Growth Comparison by Product Type, 2025-2035
  • Figure 55: Western Europe Market Attractiveness Analysis by Product Type
  • Figure 56: Western Europe Market Value Share and BPS Analysis by Hair Type, 2025 and 2035
  • Figure 57: Western Europe Market Y-o-Y Growth Comparison by Hair Type, 2025-2035
  • Figure 58: Western Europe Market Attractiveness Analysis by Hair Type
  • Figure 59: Western Europe Market Value Share and BPS Analysis by Application, 2025 and 2035
  • Figure 60: Western Europe Market Y-o-Y Growth Comparison by Application, 2025-2035
  • Figure 61: Western Europe Market Attractiveness Analysis by Application
  • Figure 62: Western Europe Market Value Share and BPS Analysis by Distribution Channel, 2025 and 2035
  • Figure 63: Western Europe Market Y-o-Y Growth Comparison by Distribution Channel, 2025-2035
  • Figure 64: Western Europe Market Attractiveness Analysis by Distribution Channel
  • Figure 65: Eastern Europe Market Value Share and BPS Analysis by Country, 2025 and 2035
  • Figure 66: Eastern Europe Market Value Share and BPS Analysis by Product Type, 2025 and 2035
  • Figure 67: Eastern Europe Market Y-o-Y Growth Comparison by Product Type, 2025-2035
  • Figure 68: Eastern Europe Market Attractiveness Analysis by Product Type
  • Figure 69: Eastern Europe Market Value Share and BPS Analysis by Hair Type, 2025 and 2035
  • Figure 70: Eastern Europe Market Y-o-Y Growth Comparison by Hair Type, 2025-2035
  • Figure 71: Eastern Europe Market Attractiveness Analysis by Hair Type
  • Figure 72: Eastern Europe Market Value Share and BPS Analysis by Application, 2025 and 2035
  • Figure 73: Eastern Europe Market Y-o-Y Growth Comparison by Application, 2025-2035
  • Figure 74: Eastern Europe Market Attractiveness Analysis by Application
  • Figure 75: Eastern Europe Market Value Share and BPS Analysis by Distribution Channel, 2025 and 2035
  • Figure 76: Eastern Europe Market Y-o-Y Growth Comparison by Distribution Channel, 2025-2035
  • Figure 77: Eastern Europe Market Attractiveness Analysis by Distribution Channel
  • Figure 78: East Asia Market Value Share and BPS Analysis by Country, 2025 and 2035
  • Figure 79: East Asia Market Value Share and BPS Analysis by Product Type, 2025 and 2035
  • Figure 80: East Asia Market Y-o-Y Growth Comparison by Product Type, 2025-2035
  • Figure 81: East Asia Market Attractiveness Analysis by Product Type
  • Figure 82: East Asia Market Value Share and BPS Analysis by Hair Type, 2025 and 2035
  • Figure 83: East Asia Market Y-o-Y Growth Comparison by Hair Type, 2025-2035
  • Figure 84: East Asia Market Attractiveness Analysis by Hair Type
  • Figure 85: East Asia Market Value Share and BPS Analysis by Application, 2025 and 2035
  • Figure 86: East Asia Market Y-o-Y Growth Comparison by Application, 2025-2035
  • Figure 87: East Asia Market Attractiveness Analysis by Application
  • Figure 88: East Asia Market Value Share and BPS Analysis by Distribution Channel, 2025 and 2035
  • Figure 89: East Asia Market Y-o-Y Growth Comparison by Distribution Channel, 2025-2035
  • Figure 90: East Asia Market Attractiveness Analysis by Distribution Channel
  • Figure 91: South Asia & Pacific Market Value Share and BPS Analysis by Country, 2025 and 2035
  • Figure 92: South Asia & Pacific Market Value Share and BPS Analysis by Product Type, 2025 and 2035
  • Figure 93: South Asia & Pacific Market Y-o-Y Growth Comparison by Product Type, 2025-2035
  • Figure 94: South Asia & Pacific Market Attractiveness Analysis by Product Type
  • Figure 95: South Asia & Pacific Market Value Share and BPS Analysis by Hair Type, 2025 and 2035
  • Figure 96: South Asia & Pacific Market Y-o-Y Growth Comparison by Hair Type, 2025-2035
  • Figure 97: South Asia & Pacific Market Attractiveness Analysis by Hair Type
  • Figure 98: South Asia & Pacific Market Value Share and BPS Analysis by Application, 2025 and 2035
  • Figure 99: South Asia & Pacific Market Y-o-Y Growth Comparison by Application, 2025-2035
  • Figure 100: South Asia & Pacific Market Attractiveness Analysis by Application
  • Figure 101: South Asia & Pacific Market Value Share and BPS Analysis by Distribution Channel, 2025 and 2035
  • Figure 102: South Asia & Pacific Market Y-o-Y Growth Comparison by Distribution Channel, 2025-2035
  • Figure 103: South Asia & Pacific Market Attractiveness Analysis by Distribution Channel
  • Figure 104: Middle East and Africa Market Value Share and BPS Analysis by Country, 2025 and 2035
  • Figure 105: Middle East and Africa Market Value Share and BPS Analysis by Product Type, 2025 and 2035
  • Figure 106: Middle East and Africa Market Y-o-Y Growth Comparison by Product Type, 2025-2035
  • Figure 107: Middle East and Africa Market Attractiveness Analysis by Product Type
  • Figure 108: Middle East and Africa Market Value Share and BPS Analysis by Hair Type, 2025 and 2035
  • Figure 109: Middle East and Africa Market Y-o-Y Growth Comparison by Hair Type, 2025-2035
  • Figure 110: Middle East and Africa Market Attractiveness Analysis by Hair Type
  • Figure 111: Middle East and Africa Market Value Share and BPS Analysis by Application, 2025 and 2035
  • Figure 112: Middle East and Africa Market Y-o-Y Growth Comparison by Application, 2025-2035
  • Figure 113: Middle East and Africa Market Attractiveness Analysis by Application
  • Figure 114: Middle East and Africa Market Value Share and BPS Analysis by Distribution Channel, 2025 and 2035
  • Figure 115: Middle East and Africa Market Y-o-Y Growth Comparison by Distribution Channel, 2025-2035
  • Figure 116: Middle East and Africa Market Attractiveness Analysis by Distribution Channel
  • Figure 117: Global Market - Tier Structure Analysis
  • Figure 118: Global Market - Company Share Analysis

Frequently Asked Questions

How big is the cetyl palmitate market in 2025?

The global cetyl palmitate market is estimated to be valued at USD 381.0 million in 2025.

What will be the size of the cetyl palmitate market in 2035?

The cetyl palmitate market size is projected to reach USD 537.4 million by 2035.

How much will be the cetyl palmitate market growth between 2025 and 2035?

The cetyl palmitate market is expected to grow at a 3.5% CAGR between 2025 and 2035.

Which product type is projected to lead in the cetyl palmitate market in 2025?

The shampoos & conditioners segment is projected to lead the cetyl palmitate market with 60% market share in 2025.

Which application segment will contribute significant share in the cetyl palmitate market in 2025?

In terms of application, the cosmetics and personal care segment will command 65% share in the cetyl palmitate market in 2025.

Explore Similar Insights

Future Market Insights

Cetyl Palmitate Market

Chat With

MaRIA

Hi There, I am MaRIA, Your Market Research Intelligence Assistant. How may I help you?