Reports
- Global Locations -
Headquarters
Future Market Insights, Inc.
Christiana Corporate, 200
Continental Drive, Suite 401,
Newark, Delaware - 19713,
United States
Americas
Future Market Insights, Inc.
616 Corporate Way, Suite 2-9018,
Valley Cottage, NY 10989, United States
MEA
Future Market Insights
1602-6 Jumeirah Bay X2 Tower, Plot No: JLT-PH2-X2A,
Jumeirah Lakes Towers, Dubai,
United Arab Emirates
Europe
Future Market Insights
3rd Floor, 207 Regent Street,
W1B 3HH London
United Kingdom
Asia Pacific
Future Market Insights
Office No. 401-A, 4th Floor,
VANTAGE 9, S.No. 36/1/1,
Baner, Pune 411045, India
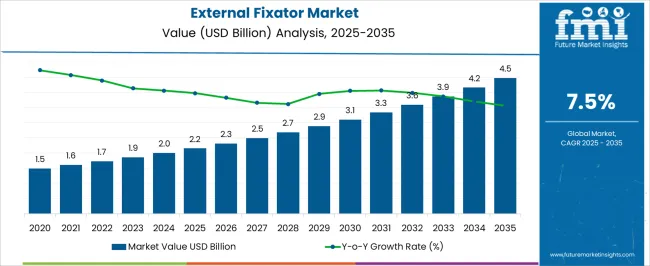
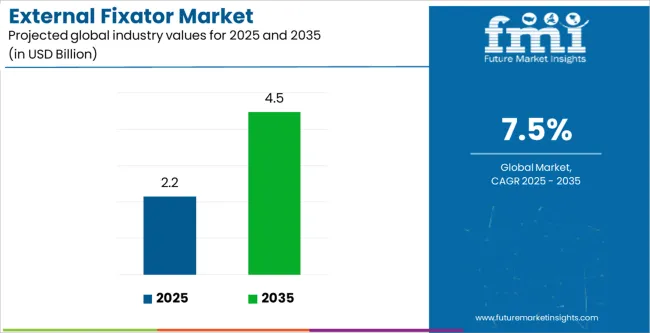
[229 Pages Report] Sales in the global external fixators market are forecast to top US$ 1.7 Billion in 2022. Expanding at a healthy 8.1% CAGR, the market size is projected to total US$ 2.7 Billion by 2028.
Attribute | Details |
---|---|
External Fixators Market Estimated Size 2022 | US$ 1.7 Billion |
External Fixators Market Value-based CAGR (2022 to 2028) | ~ 8.1% |
External Fixators Market Size in Projected 2028 | US$ 2.7 Billion |
The urgent need to treat orthopedic disorders and bone fractures worldwide is set to propel the demand for orthopedic external fixators in the forthcoming years. These fixators require less surgical intervention and are capable of reducing the overall treatment time, which is anticipated to drive the market.
The emergence of unique and technologically advanced products is likely to propel the growth in this market. Rising burden of various chronic diseases is another crucial factor that is projected to underpin the demand for external fixators.
Don't pay for what you don't need
Customize your report by selecting specific countries or regions and save 30%!
Particulars | Details |
---|---|
H1, 2021 | 8.51% |
H1, 2022 Projected | 8.44% |
H1, 2022 Outlook | 7.84% |
BPS Change - H1, 2022 (O) – H1, 2022 (P) | (-) 60 ↓ |
BPS Change – H1, 2022 (O) – H1, 2021 | (-) 67 ↓ |
According to Future Market Insight analysis, the global external fixators market expects to drop by 67 Basis Point Share (BPS) in H1-2022 as compared to H1- 2021. Whereas in comparison to H1-2022 projected period, the market during H1-2022 outlook period will show a dip of 60 BPS.
The market is subject to device quality assessments, patenting landscape, and emergence of 3D modelling software systems, as per macro and industry dynamics.
The factors associated with the decline in the BPS values for the external fixators market are the high level of maintenance and compliance required for the devices, the external bulky frame of the device, lowering patient compliance, and the high risk of infection with internal fixation of external fixators.
Moreover, non- rigid fixation, difficulty in achieving anatomic fracture reduction, joint stiffness, and pin-tract infections are all side effects of external fixator device adoption, thus resulting in the associated decline in the BPS values.
The market is highly influenced by product adoption rate, regulatory compliance, and reimbursements. Key developments in the market include the emergence of 3D printed external fixator technology for patient personalization.
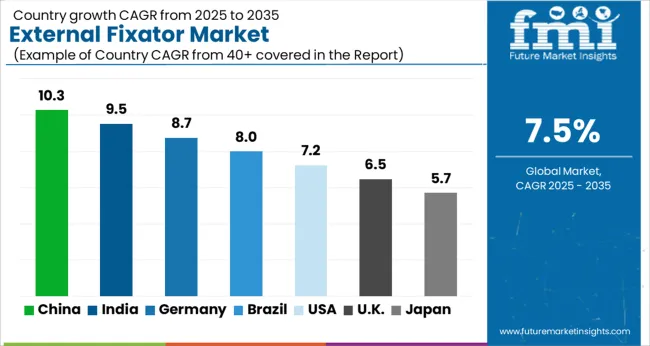
The external fixators market is expected to grow at a 8.1% CAGR between 2022 and 2028, up from 5.3% CAGR recorded during 2013-2021, as per Future Market Insights.
Increasing demand for circular fixation owing to its biomechanical characteristics, modularity, and minimally invasive application is anticipated to fuel the market. Many key external bone fixation device manufacturers are also launching state-of-the-art products for orthopedic clinics and trauma centers across the globe.
Surging prevalence of proximal tibia fractures is likely to drive the sales of hybrid fixators. These enable shorter hospital stays, low risk of infection, lesser operative time, and low bleeding. Growing number of public-private partnerships to offer cost-effective products, especially in emerging economies is another factor that is expected to boost the market.
Further, rising preference for minimally invasive surgeries, as well as the increasing prevalence of bone diseases and osteoporosis is estimated fuel sales in the market. According to the Centers for Disease Control and Prevention (CDC), from 2017 to 2018, around 18.8% of women belonging to the age group of 50 years and older had osteoporosis of the lumbar spine or femur neck in the U.S. These factors are expected to bolster the growth in the market over the forecast period.
Rising cases of car accidents are estimated to propel the demand for external bone fixation systems. Rash driving, consumption of alcohol, fatigue, failure to understand signs, over-speeding, and violation of rules often lead to car crashes.
As per the World Health Organization (WHO), every year, nearly 1.3 million people die in road traffic crashes globally. The United Nations General Assembly has implemented a target of reducing the global number of injuries and deaths caused due to road traffic crashes by 2030. Thus, surging number of car crashes is expected to bolster the demand in the market.
Rising prevalence of chronic diseases, such as diabetes and obesity is set to augur well for the market in the evaluation period. People suffering from diabetes often have a high risk of lower limb amputation as ulcers or wounds do not heal on time.
Foot-related problems, including amputation can also occur because of smoking and high blood sugar levels. According to the American Journal of Managed Care (AJMC), every day, around 230 Americans with diabetes suffer an amputation and every 30 seconds, a leg is amputated across the globe. This trend is likely to continue over the forthcoming years, thereby driving the sales of external bone fixation systems.
“Rising Cases of Sports-related Injuries to Boost the Demand for Orthopedic External Fixators”
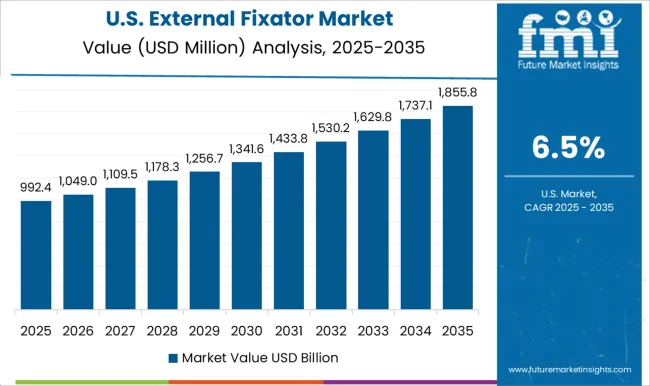
The presence of a well-developed healthcare infrastructure in the U.S. is expected to accelerate sales in the North America external fixators market. High demand for technologically advanced healthcare facilities and favorable reimbursement coverage will continue driving the market over the forecast period.
Increasing prevalence of diabetes and the surging number of sports injuries are fueling the demand in the market. According to Stanford Children’s Health, nearly 30 million children and teenagers participate in some form of organized sports in the U.S. and every year, more than 3.5 million injuries occur in the country. These numbers are set to surge in the near future, thereby pushing the sales of orthopedic external fixators.
“Surging Cases of Foot Disease to Drive the Sales of Hexapod External Fixators”
Rising implementation of stringent norms to protect workers from fatal injuries and increasing number of awareness programs in the U.K. to educate the masses about the availability of affordable hexapod external fixators are anticipated to boost the Europe market. Rising prevalence of diabetes and associated amputation cases is also set fuel demand over the forecast period.
In April 2019, for instance, Public Health England mentioned that the rate of major amputations in England was highest among men, as compared to women. Around 85,837 patients were admitted in hospitals for foot disease from 2015 to 2018. This trend is likely to continue in the forthcoming years, thereby pushing sales.
“Diabetes Patients are Increasingly Adopting Hexapod External Fixators”
Growing trend of medical tourism in India is anticipated to spur the Asia Pacific excluding China and Japan market. Rapidly evolving healthcare infrastructure and increasing government investment in the healthcare sector is also set to propel the market.
The ever-increasing patient population suffering from numerous chronic diseases in India is likely to fuel sales. As per the International Diabetes Federation (IDF), by 2030, around 92,973 people in India will suffer from diabetes and this number is estimated to reach 124,874 in 2045. Driven by these factors, the demand for hexapod external fixators is set to grow in India.
“Computer Aided External Bone Fixation Devices are Exhibiting High Demand”
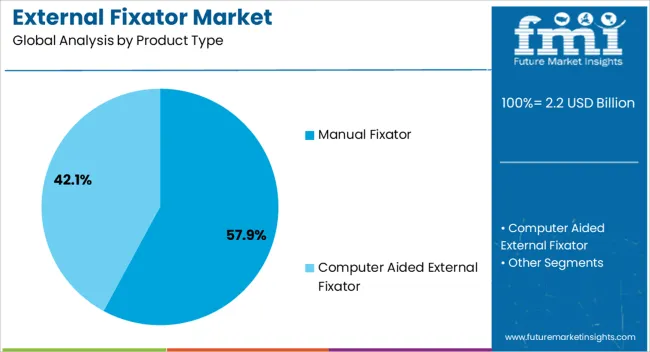
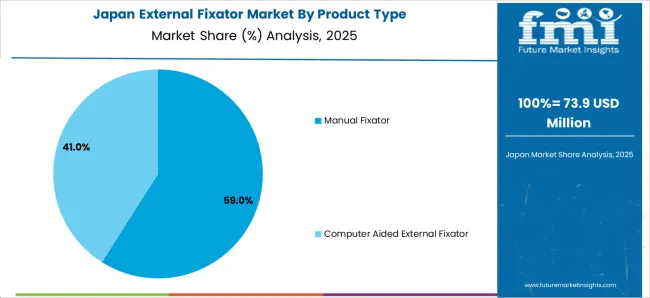
By product type, the manual fixator segment is anticipated to account for about 97.4% of the external fixators market share in 2022, finds FMI. The computer aided external fixator segment, on the other hand, is projected to hold approximately 2.6% of the share in 2022.
Computer aided external bone fixation devices combine numerous software solutions with the principles of Ilizarov. Unlike manual fixators, these products provide high accuracy and reduced infection rate. The correction of deformities without the requirement of second surgery, elimination of fluoroscopy, and ease of hardware removal are some of the other benefits of using computer aided fixators.
“External Rod Fixation Systems are Gaining Immense Popularity for Limb Correction Procedures”
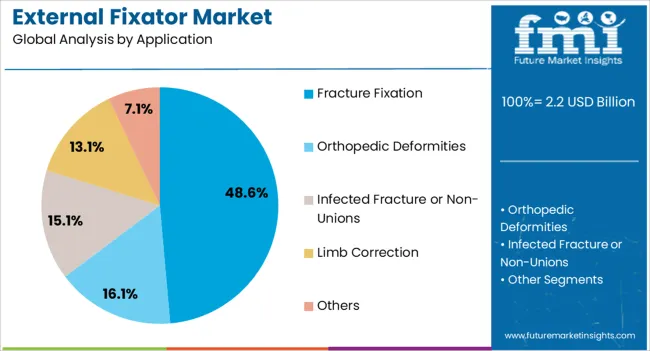
Based on application, the fracture fixation segment is estimated to lead the global external fixators market. Increasing cases of various fracture-related injuries is anticipated to drive sales in the segment.
Besides this, demand in the limb correction segment is expected accelerate over the forecast period, backed by the surging demand for limb reconstruction surgeries. The availability of several advanced treatment options with reduced surgery time and lesser risk is likely to propel the demand for external rod fixation systems.
“Orthopedic and Trauma Centers are Adopting External Rod Fixation Systems”
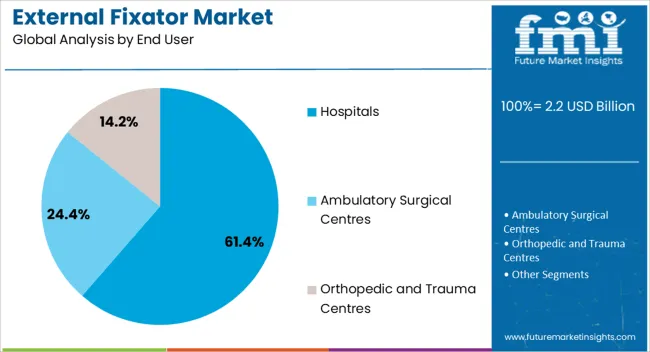
In terms of end user, the hospitals segment is expected to procure the largest global external fixators market share over the forecast period. Growth is attributable to increasing number of patient footfall, as well as the availability of cutting-edge treatment options in these facilities.
The orthopedic and trauma centers segment is set to remain in the second position because of the rising cases of trauma accidents and sports injuries worldwide. Surging number of specialty clinics owing to the high patient preference for orthopedic clinicians is another factor that is likely to boost the sales of external rod fixation systems.
Get the data you need at a Fraction of the cost
Personalize your report by choosing insights you need
and save 40%!
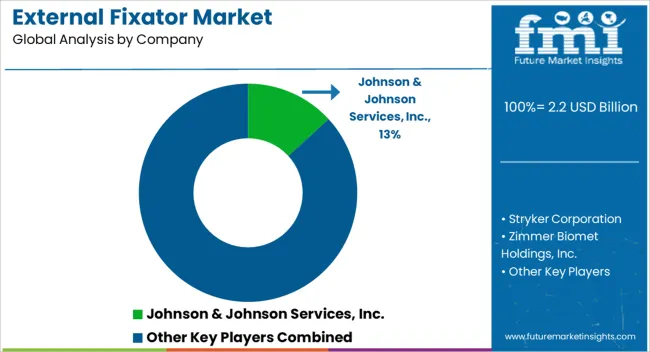
Leading players operating in the global external fixators market are focusing on developing high-performance and relatively low-cost variants of orthopedic external fixators to strengthen their positions in the tremendously competitive industry. Meanwhile, a few other key players are striving to gain fast track approvals from government healthcare agencies to market and distribute their in-house products across the globe. For instance:
Attribute | Details |
---|---|
Forecast Period | 2022 to 2028 |
Historical Data Available for | 2013 to 2021 |
Market Analysis | Units for Volume and US$ Billion for Value |
Key Regions Covered | North America, Latin America, Eastern Europe, Western Europe, Asia Pacific excluding Japan and China, Japan, China, and the Middle East & Africa. |
Key Countries Covered | The USA, Canada, Brazil, Mexico, Germany, the UK, France, Italy, Spain, Nordic, Russia, Poland, China, India, Thailand, Indonesia, Australia and New Zealand, Japan, GCC countries, North Africa, South Africa, others. |
Key Market Segments Covered | Product Type, Application, End User, and Region |
Key Companies Profiled |
|
Pricing | Available upon Request |
Product Type :
Application :
End User :
Region :
1. Executive Summary 1.1. Market Overview 1.2. Market Analysis 1.3. FMI Analysis and Recommendations 1.4. Wheel of Fortune 2. Market Introduction 2.1. Market Taxonomy 2.2. Market Definition 3. Market Opportunity Analysis 3.1. Macro-Economic Factors 3.2. Opportunity Analysis 4. Global Economic Outlook 4.1. Gross Domestic Product by Region & Country, 2006 - 2021 4.2. Global Healthcare Market Indicators 5. Market Background 5.1. Technology Assessment 5.2. Market Dynamics 5.2.1. Drivers 5.2.2. Restraints 6. Key Inclusions 6.1. Reimbursement Scenario 6.2. Regulatory Scenario 6.3. Pricing Analysis, By Region 7. North America Market Analysis 2013-2021 and Forecast 2022-2028 7.1. Introduction 7.2. Historical Market Size (US$ Mn) Analysis by Country, 2013-2021 7.2.1. U.S. 7.2.2. Canada 7.3. Market Size (US$ Mn) Forecast By Country, 2022-2028 7.4. Historical Market Size (US$ Mn) and Volume Analysis by Product Type, 2013-2021 7.4.1. Manual Fixators 7.4.2. Computer Aided External Fixator 7.5. Market Size (US$ Mn) and Volume Forecast By Product Type, 2022-2028 7.6. Historical Market Size (US$ Mn) Trend Analysis by Application, 2013-2021 7.6.1. Orthopedic Deformities 7.6.2. Fracture Fixation 7.6.3. Infected Fracture or Non-Unions 7.6.4. Limb Correction 7.6.5. Others 7.7. Market Size (US$ Mn) Forecast By Application, 2022-2028 7.8. Historical Market Size (US$ Mn) Trend Analysis by End User, 2013-2021 7.8.1. Hospitals 7.8.2. Ambulatory Surgical Centers 7.8.3. Orthopedic and Trauma Centers 7.9. Market Size (US$ Mn) Forecast By End User, 2022-2028 7.10. Market Attractiveness Analysis 7.10.1. By Country 7.10.2. By Product Type 7.10.3. By Application 7.10.4. By End User 7.11. Drivers and Restraints: Impact Analysis 8. Western Europe Market Analysis 2013-2021 and Forecast 2022-2028 8.1. Introduction 8.2. Historical Market Size (US$ Mn) Analysis by Country, 2013-2021 8.3.1. Germany 8.3.2. U.K 8.3.3. France 8.3.4. Italy 8.3.5. Spain 8.3.8. Rest of Western Europe 8.4. Market Size (US$ Mn) Forecast By Country, 2022-2028 8.5. Historical Market Size (US$ Mn) and Volume Analysis by Product Type, 2013-2021 8.5.1. Manual Fixators 8.5.2. Computer Aided External Fixator 8.6. Market Size (US$ Mn) and Volume Forecast By Product Type, 2022-2028 8.7. Historical Market Size (US$ Mn) Trend Analysis by Application, 2013-2021 8.7.1. Orthopedic Deformities 8.7.2. Fracture Fixation 8.7.3. Infected Fracture or Non-Unions 8.7.4. Limb Correction 8.7.5. Others 8.8. Market Size (US$ Mn) Forecast By Application, 2022-2028 8.9. Historical Market Size (US$ Mn) Trend Analysis by End User, 2013-2021 8.9.1. Hospitals 8.9.2. Ambulatory Surgical Centers 8.9.3. Orthopedic and Trauma Centers 8.10. Market Size (US$ Mn) Forecast By End User, 2022-2028 8.11. Market Attractiveness Analysis 8.11.1. By Country 8.11.2. By Product Type 8.11.3. By Application 8.11.4. By End User 8.12. Drivers and Restraints: Impact Analysis 9. Eastern Europe Market Analysis 2013-2021 and Forecast 2022-2028 9.1. Introduction 9.2. Historical Market Size (US$ Mn) Analysis by Country, 2013-2021 9.2.1. Russia 9.2.2. Poland 9.2.3. Rest of Eastern Europe 9.3. Market Size (US$ Mn) Forecast By Country, 2022-2028 9.4. Historical Market Size (US$ Mn) and Volume Analysis by Product Type, 2013-2021 9.4.1. Manual Fixators 9.4.2. Computer Aided External Fixator 9.5. Market Size (US$ Mn) and Volume Forecast By Product Type, 2022-2028 9.6. Historical Market Size (US$ Mn) Trend Analysis by Application, 2013-2021 9.6.1. Orthopedic Deformities 9.6.2. Fracture Fixation 9.6.3. Infected Fracture or Non-Unions 9.6.4. Limb Correction 9.6.5. Others 9.7. Market Size (US$ Mn) Forecast By Application, 2022-2028 9.8. Historical Market Size (US$ Mn) Trend Analysis by End User, 2013-2021 9.8.1. Hospitals 9.8.2. Ambulatory Surgical Centers 9.8.3. Orthopedic and Trauma Centers 9.9. Market Size (US$ Mn) Forecast By End User, 2022-2028 9.10. Market Attractiveness Analysis 9.10.1. By Country 9.10.2. By Product Type 9.10.3. By Application 9.10.4. By End User 9.11. Drivers and Restraints: Impact Analysis 10. Latin America Market Analysis 2013-2021 and Forecast 2022-2028 10.1. Introduction 10.2. Historical Market Size (US$ Mn) Analysis by Country, 2013-2021 10.2.1. Brazil 10.2.2. Mexico 10.2.4. Rest of Latin America 10.3. Market Size (US$ Mn) Forecast By Country, 2022-2028 10.4. Historical Market Size (US$ Mn) and Volume Analysis by Product Type, 2013-2021 10.4.1. Manual Fixators 10.4.2. Computer Aided External Fixator 10.5. Market Size (US$ Mn) and Volume Forecast By Product Type, 2022-2028 10.6. Historical Market Size (US$ Mn) Trend Analysis by Application, 2013-2021 10.6.1. Orthopedic Deformities 10.6.2. Fracture Fixation 10.6.3. Infected Fracture or Non-Unions 10.6.4. Limb Correction 10.6.5. Others 10.7. Market Size (US$ Mn) Forecast By Application, 2022-2028 10.8. Historical Market Size (US$ Mn) Trend Analysis by End User, 2013-2021 10.8.1. Hospitals 10.8.2. Ambulatory Surgical Centers 10.8.3. Orthopedic and Trauma Centers 10.9. Market Size (US$ Mn) Forecast By End User, 2022-2028 10.10. Market Attractiveness Analysis 10.10.1. By Country 10.10.2. By Product Type 10.10.3. By Application 10.10.4. By End User 10.11. Drivers and Restraints: Impact Analysis 11. Asia Pacific Excluding China & Japan Market Analysis 2013-2021 and Forecast 2022-2028 11.1. Introduction 11.2. Historical Market Size (US$ Mn) Analysis by Country, 2013-2021 11.2.1. India 11.2.2. Australia and New Zealand 11.2.3. ASEAN 11.2.4. Rest of APECJ 11.3. Market Size (US$ Mn) Forecast By Country, 2022-2028 11.4. Historical Market Size (US$ Mn) and Volume Analysis by Product Type, 2013-2021 11.4.1. Manual Fixators 11.4.2. Computer Aided External Fixator 11.5. Market Size (US$ Mn) and Volume Forecast By Product Type, 2022-2028 11.6. Historical Market Size (US$ Mn) Trend Analysis by Application, 2013-2021 11.6.1. Orthopedic Deformities 11.6.2. Fracture Fixation 11.6.3. Infected Fracture or Non-Unions 11.6.4. Limb Correction 11.6.5. Others 11.7. Market Size (US$ Mn) Forecast By Application, 2022-2028 11.8. Historical Market Size (US$ Mn) Trend Analysis by End User, 2013-2021 11.8.1. Hospitals 11.8.2. Ambulatory Surgical Centers 11.8.3. Orthopedic and Trauma Centers 11.9. Market Size (US$ Mn) Forecast By End User, 2022-2028 11.10. Market Attractiveness Analysis 11.10.1. By Country 11.10.2. By Product Type 11.10.3. By Application 11.10.4. By End User 11.11. Drivers and Restraints: Impact Analysis 12. China Market Analysis 2013-2021 and Forecast 2022-2028 12.1. Introduction 12.2. Historical Market Size (US$ Mn) and Volume Analysis by Product Type, 2013-2021 12.2.1. Manual Fixators 12.2.2. Computer Aided External Fixator 12.3. Market Size (US$ Mn) and Volume Forecast By Product Type, 2022-2028 12.4. Historical Market Size (US$ Mn) Trend Analysis by Application, 2013-2021 12.4.1. Orthopedic Deformities 12.4.2. Fracture Fixation 12.4.3. Infected Fracture or Non-Unions 12.4.4. Limb Correction 12.4.5. Others 12.5. Market Size (US$ Mn) Forecast By Application, 2022-2028 12.6. Historical Market Size (US$ Mn) Trend Analysis by End User, 2013-2021 12.6.1. Hospitals 12.6.2. Ambulatory Surgical Centers 12.6.3. Orthopedic and Trauma Centers 12.7. Market Size (US$ Mn) Forecast By End User, 2022-2028 12.8. Market Attractiveness Analysis 12.8.1. By Product Type 12.8.2. By Application 12.8.3. By End User 12.9. Drivers and Restraints: Impact Analysis 13. Japan Market Analysis 2013-2021 and Forecast 2022-2028 13.1. Introduction 13.2. Historical Market Size (US$ Mn) and Volume Analysis by Product Type, 2013-2021 13.2.1. Manual Fixators 13.2.2. Computer Aided External Fixator 13.3. Market Size (US$ Mn) and Volume Forecast By Product Type, 2022-2028 13.4. Historical Market Size (US$ Mn) Trend Analysis by Application, 2013-2021 13.4.1. Orthopedic Deformities 13.4.2. Fracture Fixation 13.4.3. Infected Fracture or Non-Unions 13.4.4. Limb Correction 13.4.5. Others 13.5. Market Size (US$ Mn) Forecast By Application, 2022-2028 13.6. Historical Market Size (US$ Mn) Trend Analysis by End User, 2013-2021 13.6.1. Hospitals 13.6.2. Ambulatory Surgical Centers 13.6.3. Orthopedic and Trauma Centers 13.7. Market Size (US$ Mn) Forecast By End User, 2022-2028 13.8. Market Attractiveness Analysis 13.8.1. By Product Type 13.8.2. By Application 13.8.3. By End User 13.9. Drivers and Restraints: Impact Analysis 14. Middle East and Africa Market Analysis 2013-2021 and Forecast 2022-2028 14.1. Introduction 14.2. Historical Market Size (US$ Mn) Analysis by Country, 2013-2021 14.2.1. GCC Countries 14.2.2. South Africa 14.2.3. Rest of Middle East and Africa 14.3. Market Size (US$ Mn) Forecast By Country, 2022-2028 14.4. Historical Market Size (US$ Mn) and Volume Analysis by Product Type, 2013-2021 14.4.1. Manual Fixators 14.4.2. Computer Aided External Fixator 14.5. Market Size (US$ Mn) and Volume Forecast By Product Type, 2022-2028 14.6. Historical Market Size (US$ Mn) Trend Analysis by Application, 2013-2021 14.6.1. Orthopedic Deformities 14.6.2. Fracture Fixation 14.6.3. Infected Fracture or Non-Unions 14.6.4. Limb Correction 14.6.5. Others 14.7. Market Size (US$ Mn) Forecast By Application, 2022-2028 14.8. Historical Market Size (US$ Mn) Trend Analysis by End User, 2013-2021 14.8.1. Hospitals 14.8.2. Ambulatory Surgical Centers 14.8.3. Orthopedic and Trauma Centers 14.9. Market Size (US$ Mn) Forecast By End User, 2022-2028 14.10. Market Attractiveness Analysis 14.10.1. By Country 14.10.2. By Product Type 14.10.3. By Application 14.10.4. By End User 14.11. Drivers and Restraints: Impact Analysis 15. Forecast Factors: Relevance and Impact 16. Forecast Assumptions 17. Market Structure Analysis 17.1. Market Structure by Tier 17.2. Market Share Analysis (2021) 18. Competition Analysis 18.1. Competition Dashboard 18.2. Competitors Deep Dive 18.2.1. Johnson & Johnson Services, Inc. (DePuy Synthes) 18.2.2. Stryker Corporation 18.2.3. Zimmer Biomet Holdings, Inc. 18.2.4. Smith & Nephew plc 18.2.5. Orthofix International N.V. 18.2.6. Ortho-SUV Ltd. 18.2.7. Response Ortho LLC 18.2.8. Tasar?mmed T?bbi Mamüller San. Tic. Ltd. ?ti 19. Global Market Analysis 2013-2021 and Forecast 2022-2028 by Region 19.1. Introduction / Key Findings 19.2. Historical Market Size (US$ Mn) Analysis by Region 19.2.1. North America 19.2.2. Latin America 19.2.3. Western Europe 19.2.4. Eastern Europe 19.2.5. Asia Pacific Excluding Japan and China 19.2.6. China 19.2.7. Japan 19.2.8. Middle East and Africa 19.3. Market Size (US$ Mn) Forecast By Region 19.4. Market Attractiveness Analysis by Region 20. Global Market Analysis 2013-2021 and Forecast 2022-2028, By Product Type 20.1. Introduction/Key Finding 20.2. Historical Market Size (US$ Mn) and Volume Analysis by Product Type, 2013-2021 20.2.1. Manual Fixators 20.2.2. Computer Aided External Fixators 20.3. Market Size (US$ Mn) and Volume Forecast By Product Type, 2022-2028 20.4. Market Attractiveness Analysis by Product Type 21. Global Market Analysis 2013-2021 and Forecast 2022-2028, By Application 21.1. Introduction/Key Finding 21.2. Historical Market Size (US$ Mn) Analysis by Application, 2013-2021 21.2.1. Orthopedic Deformities 21.2.2. Fracture Fixation 21.2.3. Infected Fracture or Non-Unions 21.2.4. Limb Correction 21.2.5. Others 21.3. Market Size (US$ Mn) Forecast By Application, 2022-2028 21.4. Market Attractiveness Analysis by Application 22. Global Market Analysis 2013-2021 and Forecast 2022-2028, By End User 22.1. Introduction/Key Finding 22.2. Historical Market Size (US$ Mn) Analysis by End User, 2013-2021 22.2.1. Hospitals 22.2.2. Ambulatory Surgical Centers 22.2.3. Orthopedic and Trauma Centers 22.3. Market Size (US$ Mn) Forecast By End User, 2022-2028 22.4. Market Attractiveness Analysis by End User 23. Global Market Analysis 2013-2021 and Forecast 2022-2028 23.1. Market Value Share and Volume Analysis 23.2. Y-o-Y Growth Analysis by All Segment 23.3. Absolute $ Opportunity 24. Assumptions and Acronyms Used 25. Research Methodology
Don't pay for what you don't need
Customize your report by selecting specific countries or regions and save 30%!
Table 01: Expenditure on Health, (% of GDP), by Country, 2016 - 2021 Table 02: Expenditure on Health, (% of GDP), by Country, 2016 - 2021 Table 03: CPT Codes for External Fixation Table 04: North America Market Size (US$ Mn) Analysis 2013-2021 and Forecast 2022-2028, By Country Table 05: North America Market Size (US$ Mn) Analysis 2013-2021 and Forecast 2022-2028, By Product Type Table 06: North America Market Volume Analysis 2013-2021 and Forecast 2022-2028, By Product Type Table 07: North America Market Size (US$ Mn) Analysis 2013-2021 and Forecast 2022-2028, By Application Table 08: North America Market Size (US$ Mn) Analysis 2013-2021 and Forecast 2022-2028, By End User Table 09: Western Europe Market Size (US$ Mn) Analysis 2013-2021 and Forecast 2022-2028, By Country Table 10: Western Europe Market Size (US$ Mn) Analysis 2013-2021 and Forecast 2022-2028, By Product Type Table 11: Western Europe Market Volume Analysis 2013-2021 and Forecast 2022-2028, By Product Type Table 12: Western Europe Market Size (US$ Mn) Analysis 2013-2021 and Forecast 2022-2028, By Application Table 13: Western Europe Market Size (US$ Mn) Analysis 2013-2021 and Forecast 2022-2028, By End User Table 14: Eastern Europe Market Size (US$ Mn) Analysis 2013-2021 and Forecast 2022-2028, By Country Table 15: Eastern Europe Market Size (US$ Mn) Analysis 2013-2021 and Forecast 2022-2028, By Product Type Table 16: Eastern Europe Market Volume Analysis 2013-2021 and Forecast 2022-2028, By Product Type Table 17: Eastern Europe Market Size (US$ Mn) Analysis 2013-2021 and Forecast 2022-2028, By Application Table 18: Eastern Europe Market Size (US$ Mn) Analysis 2013-2021 and Forecast 2022-2028, By End User Table 19: Latin America Market Size (US$ Mn) Analysis 2013-2021 and Forecast 2022-2028, By Country Table 20: Latin America Market Size (US$ Mn) Analysis 2013-2021 and Forecast 2022-2028, By Product Type Table 21: Latin America Market Volume Analysis 2013-2021 and Forecast 2022-2028, By Product Type Table 22: Latin America Market Size (US$ Mn) Analysis 2013-2021 and Forecast 2022-2028, By Application Table 23: Latin America Market Size (US$ Mn) Analysis 2013-2021 and Forecast 2022-2028, By End User Table 24: APECJ Market Size (US$ Mn) Analysis 2013-2021 and Forecast 2022-2028, By Country Table 25: APECJ Market Size (US$ Mn) Analysis 2013-2021 and Forecast 2022-2028, By Product Type Table 26: APECJ Market Volume Analysis 2013-2021 and Forecast 2022-2028, By Product Type Table 27: APECJ Market Size (US$ Mn) Analysis 2013-2021 and Forecast 2022-2028, By Application Table 28: APECJ Market Size (US$ Mn) Analysis 2013-2021 and Forecast 2022-2028, By End User Table 29: China Market Size (US$ Mn) Analysis 2013-2021 and Forecast 2022-2028, By Product Type Table 30: China Market Volume Analysis 2013-2021 and Forecast 2022-2028, By Product Type Table 31: China Market Size (US$ Mn) Analysis 2013-2021 and Forecast 2022-2028, By Application Table 32: China Market Size (US$ Mn) Analysis 2013-2021 and Forecast 2022-2028, By End User Table 33: Japan Market Size (US$ Mn) Analysis 2013-2021 and Forecast 2022-2028, By Product Type Table 34: Japan Market Volume Analysis 2013-2021 and Forecast 2022-2028, By Product Type Table 35: Japan Market Size (US$ Mn) Analysis 2013-2021 and Forecast 2022-2028, By Application Table 36: Japan Market Size (US$ Mn) Analysis 2013-2021 and Forecast 2022-2028, By End User Table 37: MEA Market Size (US$ Mn) Analysis 2013-2021 and Forecast 2022-2028, By Country Table 38: MEA Market Size (US$ Mn) Analysis 2013-2021 and Forecast 2022-2028, By Product Type Table 39: MEA Market Volume Analysis 2013-2021 and Forecast 2022-2028, By Product Type Table 40: MEA Market Size (US$ Mn) Analysis 2013-2021 and Forecast 2022-2028, By Application Table 41: MEA Market Size (US$ Mn) Analysis 2013-2021 and Forecast 2022-2028, By End User Table 42: Global Market Size (US$ Mn) Analysis 2013-2021 and Forecast 2022-2028, By Region Table 43: Global Market Size (US$ Mn) Analysis 2013-2021 and Forecast 2022-2028, By Product Type Table 44: Global Market Size (US$ Mn) Analysis 2013-2021 and Forecast 2022-2028, By Application Table 45: Global Market Size (US$ Mn) Analysis 2013-2021 and Forecast 2022-2028, By End User
Figure 01: Market Value Share By Region (2022) Figure 02: Global Healthcare Expenditure in US$ Tn (2013–2021) Figure 03: Types of Sports-related Injury Cases in the U.S., 2011-2014 Figure 04: Population (in Mn) Aged 65 and above, by Region, 2015, 2030, 2050 Figure 05: Percentage aged 65 and above, by Region, 2015 Figure 06: North America Market Value Share (2021A), By Country Figure 07: North America Market Value Share (2021A), By Product Type, Application and End User Figure 08: North America Market Size (US$ Mn) Analysis, 2013-2021 Figure 09: North America Market Size (US$ Mn) Forecast & Y-o-Y Growth (%), 2022-2028 Figure 10: North America Market Y-o-Y growth (%) Comparison, By Country, 2022-2028 Figure 11: U.S. Market Size (US$ Mn) Analysis, 2013-2021 Figure 12: U.S. Market Size (US$ Mn) Forecast Analysis & Y-o-Y Growth (%), 2022-2028 Figure 13: Canada Market Size (US$ Mn) Forecast & Y-o-Y Growth (%), 2022-2028 Figure 14: Canada Market Size (US$ Mn) Forecast Analysis & Y-o-Y Growth (%), 2022-2028 Figure 15: Manual External Fixator Market Size (US$ Mn) Analysis, 2013-2021 Figure 16: Manual External Fixator Market Size (US$ Mn) Forecast Analysis & Y-o-Y Growth (%), 2022-2028 Figure 17: Computer Aided External Fixator Market Size (US$ Mn) Analysis, 2013-2021 Figure 18: Computer Aided External Fixator Market Size (US$ Mn) Forecast Analysis & Y-o-Y Growth (%), 2022-2028 Figure 19: North America Market Attractiveness Analysis, By Country Figure 20: North America Market Attractiveness Analysis, By Product Type Figure 21: North America Market Attractiveness Analysis, By Application Figure 22: North America Market Attractiveness Analysis, By End User Figure 23: Western Europe Market Value Share (2021A), By Country Figure 24: Western Europe Market Value Share (2021A), By Product Type, Application and End User Figure 25: Western Europe Market Size (US$ Mn) Analysis, 2013-2021 Figure 26: Western Europe Market Size (US$ Mn) Forecast & Y-o-Y Growth (%), 2022-2028 Figure 27: Western Europe Market Y-o-Y growth (%) Comparison, By Country, 2022-2028 Figure 28: Germany Market Size (US$ Mn) Analysis, 2013-2021 Figure 29: Germany Market Size (US$ Mn) Forecast Analysis & Y-o-Y Growth (%), 2022-2028 Figure 30: U.K. Market Size (US$ Mn) Forecast & Y-o-Y Growth (%), 2013-2021 Figure 31: U.K. Market Size (US$ Mn) Forecast Analysis & Y-o-Y Growth (%), 2022-2028 Figure 32: France Market Size (US$ Mn) Analysis, 2013-2021 Figure 33: France Market Size (US$ Mn) Forecast Analysis & Y-o-Y Growth (%), 2022-2028 Figure 34: Italy Market Size (US$ Mn) Forecast & Y-o-Y Growth (%), 2013-2021 Figure 35: Italy Market Size (US$ Mn) Forecast Analysis & Y-o-Y Growth (%), 2022-2028 Figure 36: Spain Market Size (US$ Mn) Analysis, 2013-2021 Figure 37: Spain Market Size (US$ Mn) Forecast Analysis & Y-o-Y Growth (%), 2022-2028 Figure 38: Rest of Western Europe Market Size (US$ Mn) Analysis, 2013-2021 Figure 39: Rest of Western Europe Market Size (US$ Mn) Forecast Analysis & Y-o-Y Growth (%), 2022-2028 Figure 40: Manual Fixator Market Size (US$ Mn) Analysis, 2013-2021 Figure 41: Manual Fixator Market Size (US$ Mn) Forecast Analysis & Y-o-Y Growth (%), 2022-2028 Figure 42: Computer Aided External Fixator Market Size (US$ Mn) Analysis, 2013-2021 Figure 43: Computer Aided External Fixator Market Size (US$ Mn) Forecast Analysis & Y-o-Y Growth (%), 2022-2028 Figure 44: Western Europe Market Attractiveness Analysis, By Country Figure 45: Western Europe Market Attractiveness Analysis, By Product Type Figure 46: Western Europe Market Attractiveness Analysis, By Application Figure 47: Western Europe Market Attractiveness Analysis, By End User Figure 48: Eastern Europe Market Value Share (2021A), By Country Figure 49: Eastern Europe Market Value Share (2021A), By Product Type, Application and End User Figure 50: Eastern Europe Market Size (US$ Mn) Analysis, 2013-2021 Figure 51: Eastern Europe Market Size (US$ Mn) Forecast & Y-o-Y Growth (%), 2022-2028 Figure 52: Eastern Europe Market Y-o-Y growth (%) Comparison, By Country, 2022-2028 Figure 53: Russia Market Size (US$ Mn) Analysis, 2013-2021 Figure 54: Russia Market Size (US$ Mn) Forecast Analysis & Y-o-Y Growth (%), 2022-2028 Figure 55: Poland Market Size (US$ Mn) Analysis, 2013-2021 Figure 56: Poland Market Size (US$ Mn) Forecast Analysis & Y-o-Y Growth (%), 2022-2028 Figure 57: Rest of Eastern Europe Market Size (US$ Mn) Analysis, 2013-2021 Figure 58: Rest of Eastern Europe Market Size (US$ Mn) Forecast Analysis & Y-o-Y Growth (%), 2022-2028 Figure 59: Manual Fixator Market Size (US$ Mn) Analysis, 2013-2021 Figure 60: Manual Fixator Market Size (US$ Mn) Forecast Analysis & Y-o-Y Growth (%), 2022-2028 Figure 61: Computer Aided External Fixator Market Size (US$ Mn) Analysis, 2013-2021 Figure 62: Computer Aided External Fixator Market Size (US$ Mn) Forecast Analysis & Y-o-Y Growth (%), 2022-2028 Figure 63: Eastern Europe Market Attractiveness Analysis, By Country Figure 64: Eastern Europe Market Attractiveness Analysis, By Product Type Figure 65: Eastern Europe Market Attractiveness Analysis, By Application Figure 66: Eastern Europe Market Attractiveness Analysis, By End User Figure 67: Latin America Market Value Share (2021A), By Country Figure 68: Latin America Market Value Share (2021A), By Product Type, Application and End User Figure 69: Latin America Market Size (US$ Mn) Analysis, 2013-2021 Figure 70: Latin America Market Size (US$ Mn) Forecast & Y-o-Y Growth (%), 2022-2028 Figure 71: Latin America Market Y-o-Y growth (%) Comparison, By Country, 2022-2028 Figure 72: Brazil Market Size (US$ Mn) Analysis, 2013-2021 Figure 73: Brazil Market Size (US$ Mn) Forecast Analysis & Y-o-Y Growth (%), 2022-2028 Figure 74: Mexico Market Size (US$ Mn) Analysis, 2013-2021 Figure 75: Mexico Market Size (US$ Mn) Forecast Analysis & Y-o-Y Growth (%), 2022-2028 Figure 76: Rest of Latin America Market Size (US$ Mn) Analysis, 2013-2021 Figure 77: Rest of Latin America Market Size (US$ Mn) Forecast Analysis & Y-o-Y Growth (%), 2022-2028 Figure 78: Manual Fixator Market Size (US$ Mn) Analysis, 2013-2021 Figure 79: Manual Fixator Market Size (US$ Mn) Forecast Analysis & Y-o-Y Growth (%), 2022-2028 Figure 80: Computer Aided External Fixator Market Size (US$ Mn) Analysis, 2013-2021 Figure 81: Computer Aided External Fixator Market Size (US$ Mn) Forecast Analysis & Y-o-Y Growth (%), 2022-2028 Figure 82: Latin America Market Attractiveness Analysis, By Country Figure 83: Latin America Market Attractiveness Analysis, By Product Type Figure 84: Latin America Market Attractiveness Analysis, By Application Figure 85: Latin America Market Attractiveness Analysis, By End User Figure 86: APECJ Market Value Share (2021A), By Country Figure 87: APECJ Market Value Share (2021A), By Product Type, Application and End User Figure 88: APECJ Market Size (US$ Mn) Analysis, 2013-2021 Figure 89: APECJ Market Size (US$ Mn) Forecast & Y-o-Y Growth (%), 2022-2028 Figure 90: APECJ Market Y-o-Y growth (%) Comparison, By Country, 2022-2028 Figure 91: India Market Size (US$ Mn) Analysis, 2013-2021 Figure 92: India Market Size (US$ Mn) Forecast Analysis & Y-o-Y Growth (%), 2022-2028 Figure 93: Australia & New Zealand Market Size (US$ Mn) Analysis, 2013-2021 Figure 94: Australia & New Zealand Market Size (US$ Mn) Forecast Analysis & Y-o-Y Growth (%), 2022-2028 Figure 95: ASEAN Market Size (US$ Mn) Analysis, 2013-2021 Figure 96: ASEAN Market Size (US$ Mn) Forecast Analysis & Y-o-Y Growth (%), 2022-2028 Figure 97: Rest of APECJ Market Size (US$ Mn) Analysis, 2013-2021 Figure 98: Rest of APECJ Market Size (US$ Mn) Forecast Analysis & Y-o-Y Growth (%), 2022-2028 Figure 99: Manual Fixator Market Size (US$ Mn) Analysis, 2013-2021 Figure 100: Manual Fixator Market Size (US$ Mn) Forecast Analysis & Y-o-Y Growth (%), 2022-2028 Figure 101: Computer Aided External Fixator Market Size (US$ Mn) Analysis, 2013-2021 Figure 102: Computer Aided External Fixator Market Size (US$ Mn) Forecast Analysis & Y-o-Y Growth (%), 2022-2028 Figure 103: APECJ Market Attractiveness Analysis, By Country Figure 104: APECJ Market Attractiveness Analysis, By Product Type Figure 105: APECJ Market Attractiveness Analysis, By Application Figure 106: APECJ Market Attractiveness Analysis, By End User Figure 107: China External Fixator Market Value Share (2021A), By Product Type, Application and End User Figure 108: China External Fixator Market Size (US$ Mn) Analysis, 2013-2021 Figure 109: China External Fixator Market Size (US$ Mn) Forecast & Y-o-Y Growth (%), 2022-2028 Figure 110: Manual Fixator Market Size (US$ Mn) Analysis, 2013-2021 Figure 111: Manual Fixator Market Size (US$ Mn) Forecast Analysis & Y-o-Y Growth (%), 2022-2028 Figure 112: Computer Aided External Fixator Market Size (US$ Mn) Analysis, 2013-2021 Figure 113: Computer Aided External Fixator Market Size (US$ Mn) Forecast Analysis & Y-o-Y Growth (%), 2022-2028 Figure 114: China Market Attractiveness Analysis, By Product Type Figure 115: China Market Attractiveness Analysis, By Application Figure 116: China Market Attractiveness Analysis, By End User Figure 117: Japan External Fixator Market Value Share (2021A), By Product Type, Application and End User Figure 118: Japan External Fixator Market Size (US$ Mn) Analysis, 2013-2021 Figure 119: Japan External Fixator Market Size (US$ Mn) Forecast & Y-o-Y Growth (%), 2022-2028 Figure 120: Manual Fixator Market Size (US$ Mn) Analysis, 2013-2021 Figure 121: Manual Fixator Market Size (US$ Mn) Forecast Analysis & Y-o-Y Growth (%), 2022-2028 Figure 122: Computer Aided External Fixator Market Size (US$ Mn) Analysis, 2013-2021 Figure 123: Computer Aided External Fixator Market Size (US$ Mn) Forecast Analysis & Y-o-Y Growth (%), 2022-2028 Figure 124: Japan Market Attractiveness Analysis, By Product Type Figure 125: Japan Market Attractiveness Analysis, By Application Figure 126: Japan Market Attractiveness Analysis, By End User Figure 127: MEA Market Value Share (2021A), By Country Figure 128: MEA Market Value Share (2021A), By Product Type, Application and End User Figure 129: MEA Market Size (US$ Mn) Analysis, 2013-2021 Figure 130: MEA Market Size (US$ Mn) Forecast & Y-o-Y Growth (%), 2022-2028 Figure 131: MEA Market Y-o-Y growth (%) Comparison, By Country, 2022-2028 Figure 132: GCC Countries Market Size (US$ Mn) Analysis, 2013-2021 Figure 133: GCC Countries Market Size (US$ Mn) Forecast Analysis & Y-o-Y Growth (%), 2022-2028 Figure 134: South Africa Market Size (US$ Mn) Analysis, 2013-2021 Figure 135: South Africa Market Size (US$ Mn) Forecast Analysis & Y-o-Y Growth (%), 2022-2028 Figure 136: Rest of MEA Market Size (US$ Mn) Analysis, 2013-2021 Figure 137: Rest of MEA Market Size (US$ Mn) Forecast Analysis & Y-o-Y Growth (%), 2022-2028 Figure 138: Manual Fixator Market Size (US$ Mn) Analysis, 2013-2021 Figure 139: Manual Fixator Market Size (US$ Mn) Forecast Analysis & Y-o-Y Growth (%), 2022-2028 Figure 140: Computer Aided External Fixator Market Size (US$ Mn) Analysis, 2013-2021 Figure 141: Computer Aided External Fixator Market Size (US$ Mn) Forecast Analysis & Y-o-Y Growth (%), 2022-2028 Figure 142: MEA Market Attractiveness Analysis, By Country Figure 143: MEA Market Attractiveness Analysis, By Product Type Figure 144: MEA Market Attractiveness Analysis, By Application Figure 145: MEA Market Attractiveness Analysis, By End User Figure 146: Global Market Attractiveness Analysis, By Region Figure 147: Global Market Attractiveness Analysis, By Product Type Figure 148: Global Market Attractiveness Analysis, By Application Figure 149: Global Market Attractiveness Analysis, By End User Figure 150: Global Market Size and Y-o-Y, 2013 - 2021 Figure 151: Global Market Size (US$ Mn) & Y-o-Y Growth (%), 2022–2028 Figure 152: Global Market Absolute $ Opportunity, 2013–2028
Recommendations
Explore Healthcare Insights
View Reports