The ferrovanadium market is expected to grow from USD 5.3 billion in 2025 to USD 8.8 billion by 2035, representing substantial growth, as the accelerating adoption of high-grade ferrovanadium formulations and aluminothermic reduction technology is demonstrated across the construction steel, pipeline manufacturing, and automotive sectors. Future Market Insights, globally acknowledged for insights in polymers and industrial coatings research, the ferro vanadium industry stands at the threshold of a decade-long expansion trajectory that promises to reshape high-strength low-alloy steel technology, energy infrastructure applications, and critical materials manufacturing solutions.
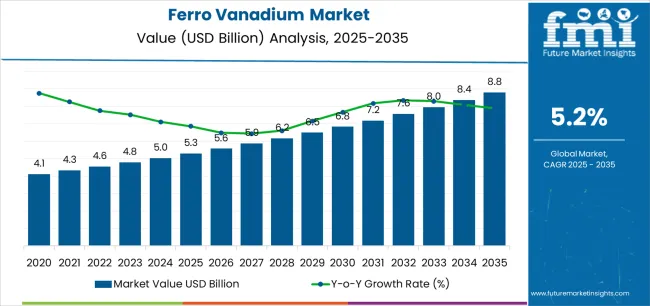
The first half of the decade (2025 to 2030) will witness the market climbing from USD 5.3 billion to approximately USD 6.8 billion, adding USD 1.5 billion in value, which constitutes 43% of the total forecast growth period. This phase will be characterized by the rapid adoption of FeV 80 systems, driven by increasing mandatory high-grade rebar standards and the growing need for earthquake-rated construction steel manufacturing worldwide.
Advanced aluminothermic reduction technologies and integrated vanadium resource management will become standard expectations rather than premium options.
The latter half (2030 to 2035) will witness sustained growth from USD 6.8 billion to USD 8.8 billion, representing an addition of USD 2.0 billion or 57% of the decade's expansion. This period will be defined by mass market penetration of high-specification pipeline steels, integration with comprehensive grid-scale energy storage supply chains, and seamless compatibility with advanced aerospace and defense alloy infrastructure.
The market trajectory signals fundamental shifts in how manufacturers approach critical materials sourcing optimization and steel formulation management, with participants positioned to benefit from sustained demand across multiple commercial grade categories and application segments.
The Ferro Vanadium market demonstrates distinct growth phases with varying market characteristics and competitive dynamics. Between 2025 and 2030, the market progresses through its infrastructure optimization phase, expanding from USD 5.3 billion to USD 6.8 billion with steady annual increments averaging 5.2% growth.
This period showcases the transition from conventional ferro vanadium grades to high-specification FeV 80 derivatives with enhanced vanadium content characteristics and integrated quality control systems becoming mainstream features.
The 2025 to 2030 phase adds USD 1.5 billion to market value, representing 43% of total decade expansion. Market maturation factors include standardization of aluminothermic reduction protocols, declining production costs for high-grade formulations, and increasing construction industry awareness of earthquake-rated steel benefits reaching 78-80% vanadium content specifications in HSLA applications.
Competitive landscape evolution during this period features established ferro-alloy companies like Pangang Group and AMG Vanadium expanding their construction and energy portfolios while specialty producers focus on vertical integration of vanadium resources and closed-loop recycling capabilities.
From 2030 to 2035, market dynamics shift toward advanced application integration and global energy storage expansion, with growth continuing from USD 6.8 billion to USD 8.8 billion, adding USD 2.0 billion or 57% of total expansion.
This phase transition centers on specialty aerospace-grade systems, integration with vanadium redox flow battery networks, and deployment across diverse pipeline and pressure vessel scenarios, becoming standard rather than specialized applications. The competitive environment matures with focus shifting from basic ferro vanadium production to comprehensive steel formulation optimization systems and integration with critical minerals supply platforms.
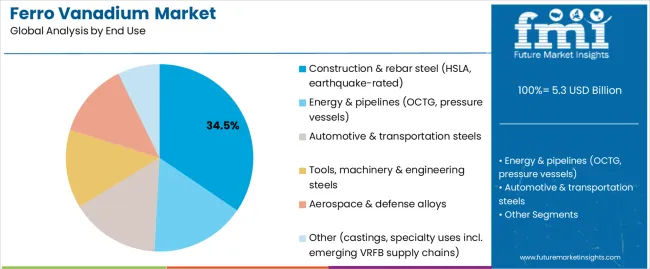
The market demonstrates strong fundamentals with FeV 80 systems capturing a dominant share through high vanadium content and HSLA optimization capabilities. Construction & rebar steel applications drive primary demand, supported by increasing mandatory higher-grade rebar requirements and earthquake-rated construction technology.
Geographic expansion remains concentrated in China with established vanadium resource infrastructure, while developed economies show accelerating adoption rates driven by infrastructure renewal preferences and defense steel growth.
At-a-Glance Metrics
| Metric | Value |
|---|---|
| Market Value (2025) | USD 5.3 billion |
| Market Forecast (2035) | USD 8.8 billion |
| Growth Rate | 5.2% CAGR |
| Leading Commercial Grade | FeV 80 Grade Type |
| Primary Application | Construction & Rebar Steel Segment |
Market expansion rests on three fundamental shifts driving adoption across construction, energy, and transportation sectors. Mandatory high-grade rebar standards create compelling operational advantages through FeV 80 that provides superior strength enhancement and seismic resistance without excessive alloy additions, enabling steel producers to meet building codes while maintaining cost efficiency and structural safety requirements.
Energy infrastructure replacement accelerates as pipeline operators and pressure vessel manufacturers worldwide seek high-specification ferro vanadium systems that complement OCTG formulations and critical pressure applications, enabling effective corrosion resistance and fatigue performance that align with safety standards and operational longevity requirements.
Grid-scale energy storage expansion drives adoption from battery manufacturers requiring vanadium supply chain security that minimizes dependency on single-source materials while maintaining electrolyte production performance during VRFB development and commercialization operations.
However, growth faces headwinds from vanadium price volatility that varies across mining suppliers regarding ore grades and processing costs, which may limit profitability in cost-sensitive steel manufacturing environments. Competition from alternative alloying elements also persists regarding niobium and molybdenum substitution that may reduce ferro vanadium consumption in certain steel applications.
The ferro vanadium market represents a diversified yet critical specialty alloy opportunity driven by expanding global construction safety standards, energy infrastructure replacement requirements, and advanced steel manufacturing demand for superior mechanical effectiveness. As steel producers worldwide seek to achieve seismic compliance positioning, enhanced pipeline performance, and strategic materials security credentials, ferro vanadium is evolving from basic steel additive commodity to sophisticated critical material that ensures structural differentiation and regulatory compliance.
The convergence of infrastructure modernization awareness, energy security acceleration, and construction safety mandates creates sustained demand drivers across multiple end-use segments. The market's growth trajectory from USD 5.3 billion in 2025 to USD 8.8 billion by 2035 at a 5.2% CAGR reflects fundamental shifts in steel formulation requirements and critical materials optimization.
Geographic expansion opportunities are particularly pronounced in Asian markets, where China (5.4% CAGR) leads through aggressive rebar upgrade programs and grid storage infrastructure development. The dominance of FeV 80 grade (46.5% market share) and construction & rebar steel applications (34.0% share) provides clear strategic focus areas, while emerging aerospace and energy storage applications open new revenue streams across diverse manufacturing markets.
Strengthening the dominant FeV 80 segment (46.5% market share) through enhanced vanadium content optimization, superior aluminothermic reduction technologies, and quality consistency certifications. This pathway focuses on optimizing vanadium content to 78-82% specifications and developing low-impurity formulations for critical steel applications. Market leadership consolidation through mining partnerships, traceability systems, and ISO certification enables premium positioning while expanding penetration across construction and infrastructure applications. Expected revenue pool: USD 280-350 million
Rapid growth across China (5.4% CAGR) creates expansion opportunities through domestic vanadium resource development and integrated steel production optimization. Vertical integration strategies reduce import dependency, enable faster quality assurance, and position companies advantageously for government infrastructure programs while accessing growing domestic markets requiring high-grade and earthquake-rated ferro vanadium. Expected revenue pool: USD 240-320 million
Expansion within the dominant construction & rebar steel segment (34.0% market share) through specialized formulations addressing mandatory rebar standards and seismic resistance needs. This pathway encompasses HSLA technology optimization, earthquake-rated certifications, and compatibility with diverse construction steel systems, enabling integration with advanced building technologies and structural safety systems. Expected revenue pool: USD 220-290 million
Strategic expansion into energy & pipeline applications (20.0% market share) requires high-specification manufacturing and specialized formulations addressing drill-pipe requirements and pressure vessel safety. This pathway addresses corrosion resistance enhancement, fatigue performance optimization, and sour-service compatibility, creating opportunities for long-term supply agreements and co-development partnerships with energy infrastructure companies. Expected revenue pool: USD 180-250 million
Development of optimized aluminothermic reduction technology (54.0% process share) addressing production efficiency requirements and quality consistency enhancement. This pathway encompasses energy optimization, waste minimization, and process control automation. Technology differentiation through environmental compliance and cost competitiveness enables diversified revenue streams while expanding addressable market opportunities in price-sensitive steel segments. Expected revenue pool: USD 150-210 million
Integration into automotive & transportation steels (17.0% share) including high-strength vehicle components, chassis formulations, and safety-critical structural parts. This pathway encompasses lightweighting applications, crash performance enhancement, and electric vehicle structural systems. Market positioning through OEM certification and consistent supply reliability creates opportunities for tier-1 automotive partnerships replacing conventional alloying alternatives. Expected revenue pool: USD 130-190 million
Development of ultra-high-purity aerospace & defense alloys (7.0% market share) addressing stringent qualification requirements and advanced performance specifications. This pathway encompasses fatigue-resistant formulations, military specifications compliance, and comprehensive traceability documentation, enabling access to high-value defense partnerships and specialty aerospace markets. Expected revenue pool: USD 90-140 million
Primary Classification: The market segments by Commercial Grade into FeV 80, FeV 60, FeV 50, and FeV 40 categories, representing the evolution from lower vanadium content alloys to high-specification ferro vanadium for comprehensive steel optimization.
Secondary Classification: Production Process segmentation divides the market into Aluminothermic reduction, Silicon reduction, and Other/Hybrid routes, reflecting distinct manufacturing technologies, energy requirements, and product quality characteristics.
Tertiary Classification: End-Use segmentation covers Construction & rebar steel, Energy & pipelines, Automotive & transportation steels, Tools/machinery & engineering steels, Aerospace & defense alloys, and Other sectors, demonstrating diverse demand drivers across steel manufacturing applications.
Quaternary Classification: Application segmentation by steel type includes HSLA grades, earthquake-rated construction steel, OCTG formulations, pressure vessels, specialty tool steels, and fatigue-resistant alloys, reflecting specific performance requirements.
Regional Classification: Geographic distribution spans Asia-Pacific, North America, Europe, Latin America, and Middle East & Africa, with Asian markets leading adoption while developed economies show steady growth patterns driven by infrastructure renewal trends and defense manufacturing innovation.
Market Position: FeV 80 systems command the leading position in the Ferro Vanadium market with approximately 46.5% market share through high vanadium content features, including 78-82% vanadium specifications, optimal HSLA compatibility, and strength enhancement positioning that enable steel manufacturers to achieve superior mechanical properties across diverse construction environments.
Value Drivers: The segment benefits from regulatory preference for high-grade rebar that provides earthquake resistance, structural safety, and code compliance without compromising cost efficiency. Advanced aluminothermic reduction features enable consistent vanadium content, improved recovery yields, and integration with quality control systems, where specification reliability and impurity minimization represent critical procurement requirements.
Competitive Advantages: FeV 80 systems differentiate through proven strength enhancement credentials, consistent supply availability, and integration with mandatory rebar programs and seismic building codes that enhance structural safety while maintaining production economics suitable for construction, infrastructure, and high-specification steel applications.
Key market characteristics:
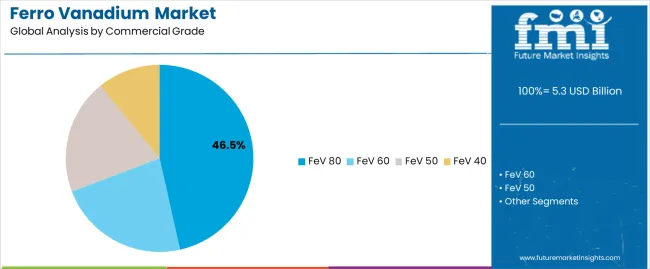
FeV 60 systems hold approximately 26.0% market share in the Ferro Vanadium market due to their cost-performance balance and established applications in general construction and machinery steel segments. These systems appeal to manufacturers requiring moderate vanadium enrichment with economic advantages for applications where ultra-high specifications are not mandated.
Market Context: Construction & rebar steel end-use dominates the Ferro Vanadium market with approximately 34.0% market share driven by mandatory high-grade rebar adoption and earthquake-rated construction steel requirements that demand effective strength enhancement, seismic resistance, and structural safety supporting building code preferences.
Appeal Factors: Steel manufacturers prioritize supplier reliability, quality consistency, and technical support that enable integrated rebar development programs across construction categories. The segment benefits from regulatory pressure and safety mandates for earthquake-resistant structures that emphasize high-strength steel and minimal structural failures.
Growth Drivers: Infrastructure modernization creates sustained demand for high-grade rebar, while seismic safety regulations mandate adoption of FeV 80-enriched steel for building code compliance and structural integrity assurance.
Market Challenges: Price sensitivity and commodity pricing volatility may limit profitability during periods of vanadium supply fluctuations or competitive pressure from alternative strengthening methods.
End-use dynamics include:
Energy & pipelines end-use captures approximately 20.0% market share through OCTG applications, pressure vessel manufacturing, and pipeline steel systems requiring high-specification ferro vanadium and comprehensive safety performance for oil and gas infrastructure and critical energy transportation requiring corrosion resistance and sour-service compatibility.
Automotive & transportation steels end-use accounts for approximately 17.0% market share, encompassing high-strength vehicle components, chassis structures, and safety-critical parts where ferro vanadium provides strength enhancement and weight reduction for advanced vehicle designs in passenger cars and commercial transportation requiring crash performance optimization.
Growth Accelerators: Mandatory higher-grade rebar standards drive primary adoption as FeV 80 provides superior seismic resistance capabilities that enable construction companies to meet building codes without compromising structural integrity, supporting earthquake safety preferences and regulatory compliance that require high-strength steel specifications. Infrastructure replacement cycles accelerate market expansion as pipeline operators and bridge authorities seek high-specification ferro vanadium systems that enhance fatigue resistance and enable long-service infrastructure platforms, particularly for aging energy transportation networks requiring corrosion-resistant steel for pipeline and pressure vessel applications. Grid-scale energy storage growth creates sustained demand as vanadium redox flow battery manufacturers worldwide adopt integrated supply chains that complement VRFB commercialization positioning, enabling effective electrolyte production and material security that align with renewable energy integration requirements for large-scale battery deployment.
Growth Inhibitors: Vanadium price volatility creates profitability challenges due to concentrated mining sources and processing capacity limitations affecting raw material costs, particularly impacting steel producers in regions dependent on imported vanadium pentoxide or lacking domestic slag recovery infrastructure. Competition from alternative strengthening methods persists as niobium microalloying, titanium additions, and thermomechanical processing offer cost advantages in certain steel grades, potentially limiting ferro vanadium adoption in commodity construction steel where lower specifications permit element substitution. Technical limitations exist regarding optimal addition rates and steel chemistry compatibility that may reduce effectiveness in certain alloy systems or processing routes, affecting performance in specialized tool steels or ultra-high-strength applications where precise chemistry control challenges vanadium utilization.
Market Evolution Patterns: Adoption accelerates in premium construction, energy infrastructure, and aerospace sectors where seismic compliance positioning and strategic materials preferences justify higher ferro vanadium costs, with geographic concentration in China transitioning toward mainstream adoption in developed infrastructure markets driven by aging asset replacement and defense manufacturing growth. Technology development focuses on vertical integration of vanadium resources, closed-loop slag recycling programs, and alternative extraction methods that reduce environmental footprint and enable supply security positioning for strategically-conscious governments. The market could face disruption if VRFB commercialization significantly expands vanadium demand beyond traditional steel applications or if alternative battery chemistries challenge vanadium's energy storage positioning, though current infrastructure steel demand provides substantial market stability.
| Country | CAGR (2025-2035) |
|---|---|
| China | 5.4% |
| USA | 4.6% |
| South Korea | 4.3% |
| Germany | 4.1% |
| Australia | 4.0% |
| UK | 3.9% |
| Japan | 3.8% |
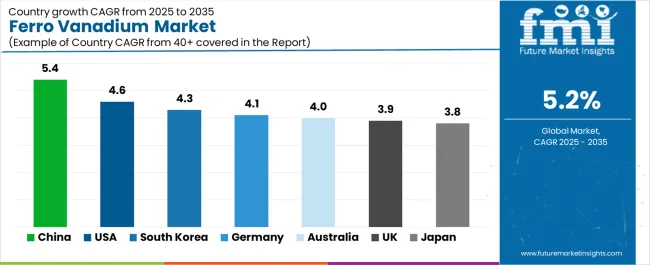
The Ferro Vanadium market demonstrates varied regional dynamics with Growth Leaders including China (5.4% CAGR) driving expansion through mandatory rebar standards and grid storage programs. Steady Performers encompass the United States (4.6% CAGR) and South Korea (4.3% CAGR), benefiting from infrastructure replacement cycles and shipbuilding demand.
Mature Markets feature Germany (4.1% CAGR), Australia (4.0% CAGR), the United Kingdom (3.9% CAGR), and Japan (3.8% CAGR), where specialized steel applications and recycling infrastructure support consistent growth patterns.
Regional synthesis reveals Asian markets leading adoption through construction safety mandates and vertical resource integration, while developed economies maintain steady growth supported by infrastructure renewal and defense manufacturing. Australian markets show accelerating expansion driven by critical minerals development and mining infrastructure steel demand.
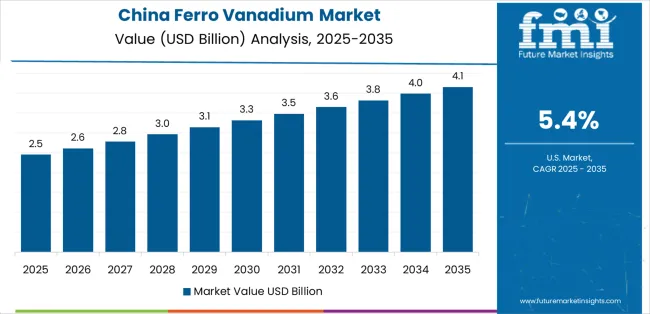
China establishes market leadership with 5.4% CAGR through aggressive mandatory higher-grade rebar standards and vertical integration of vanadium resources, integrating advanced ferro vanadium production as standard capability in construction steel mills and HSLA manufacturing facilities.
The country's growth reflects government initiatives promoting earthquake-resistant construction under national building codes and rising grid-scale storage development under renewable energy programs that mandate domestic vanadium supply chain security capabilities.
Expansion concentrates in major steel centers, including Hebei, Liaoning, and Sichuan, where integrated steel facilities and vanadium processors showcase combined ferro-alloy production that appeals to domestic construction and export-oriented manufacturers seeking cost-effective production advantages and strategic materials control capabilities.
Chinese ferro vanadium producers are developing localized vertical integration facilities that combine vanadium-titanium magnetite resources with improving aluminothermic reduction technology, including Pangang Group operations that leverage Panzhihua deposits for sustainable manufacturing.
Strategic Market Indicators:
In Pennsylvania, Texas, and Ohio, steel mills and specialty alloy facilities are implementing advanced ferro vanadium procurement systems as standard capability for HSLA production and defense-grade steel manufacturing, driven by increasing infrastructure replacement cycles and defense manufacturing requirements that emphasize domestic sourcing and critical materials security.
The market achieves 4.6% CAGR, supported by substantial pipeline replacement investments that leverage America's position as major energy producer for OCTG and pressure vessel steel while expanding aerospace-grade capacity through specialty producer partnerships.
American steel producers are adopting optimized FeV 80 formulations that provide superior pipeline performance and drill-pipe specifications, particularly appealing in energy infrastructure applications where sour-service resistance and fatigue performance represent critical procurement factors.
Market expansion benefits from comprehensive infrastructure legislation and defense budget allocations promoting domestic ferro vanadium consumption that enable scaled production of high-specification steel for domestic infrastructure and export markets. Technology adoption follows patterns established in specialty steel manufacturing, where process efficiency and quality consistency drive competitive positioning and market access.
Market Intelligence Brief:
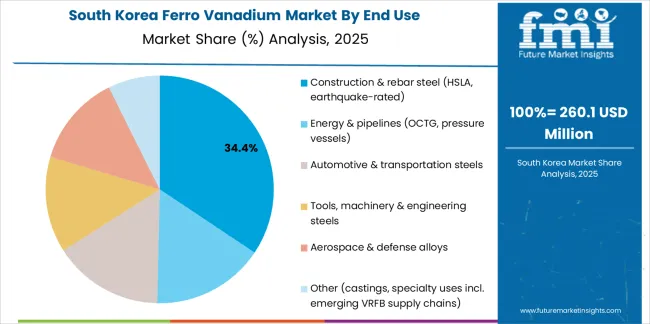
South Korea's market expansion demonstrates 4.3% CAGR through shipbuilding & specialty steels demand and strategic materials stockpiles that increasingly incorporate high-grade ferro vanadium for marine structural steel and electronics infrastructure.
The country leverages advanced shipbuilding industry and semiconductor manufacturing base to attract specialty steel investments and high-specification alloy capacity requiring critical materials supply. Industrial centers, including Pohang, Gwangyang, and Ulsan, showcase expanding installations where ferro vanadium systems integrate with shipbuilding steel operations and specialty manufacturing to optimize structural performance and corrosion resistance.
Korean steel producers prioritize high-purity ferro vanadium solutions that balance mechanical performance with weldability considerations important to shipbuilding and specialty applications, while government strategic materials programs create sustained demand for domestic stockpile maintenance and supply security.
Strategic Market Considerations:
Germany's market maintains 4.1% CAGR through automotive & machinery exports and high-specification pipeline steels and closed-loop slag/catalyst recovery that incorporates advanced ferro vanadium for premium steel applications. The country benefits from engineering excellence in automotive steel and environmental leadership that create multi-segment consumption patterns.
North Rhine-Westphalia, Bavaria, and Baden-Württemberg regions showcase established installations where ferro vanadium systems provide functional performance across automotive structural steel, machinery components, and pipeline manufacturing applications.
Market dynamics emphasize sustainable production through integrated vanadium recycling from spent catalysts and steel slag that delivers reliable performance while accommodating environmental compliance requirements typical of German industrial applications, though premium automotive and aerospace segments show increasing adoption of virgin high-purity grades.
Performance Metrics:
Australia's market demonstrates 4.0% CAGR through critical minerals projects development and mining/rail steels demand emphasizing domestic vanadium resource development and export-linked battery-material ecosystem. The country benefits from extensive vanadium resource base and mining infrastructure sophistication that create diverse ferro vanadium consumption patterns. Western Australia and Queensland regions showcase installations where ferro vanadium systems deliver functional performance across mining equipment steel, rail infrastructure, and emerging vanadium extraction applications.
Australian steel producers prioritize locally-sourced ferro vanadium from domestic vanadium projects that provides supply security and supports critical minerals positioning for export-oriented battery materials, while mining sector applications gain traction through high-strength steel requirements and abrasion-resistant alloy utilization.
Market Intelligence Brief:
The UK market demonstrates 3.9% CAGR through defense & rail renewals and post-Brexit supply diversification emphasizing domestic manufacturing and recycling capacity upgrades in ferro vanadium infrastructure. British steel facilities prioritize high-specification ferro vanadium for defense applications and rail system replacement through proven quality track records and technical support capabilities. Technology deployment channels include specialty alloy suppliers, defense contractors, and infrastructure steel producers that support sophisticated application requirements.
Manufacturing platform integration capabilities with established defense manufacturing systems and rail infrastructure networks expand market appeal across diverse applications seeking performance reliability and strategic materials security benefits, while specialty aerospace-grade serves advanced military segments demanding ultra-high purity specifications.
Market Intelligence Brief:
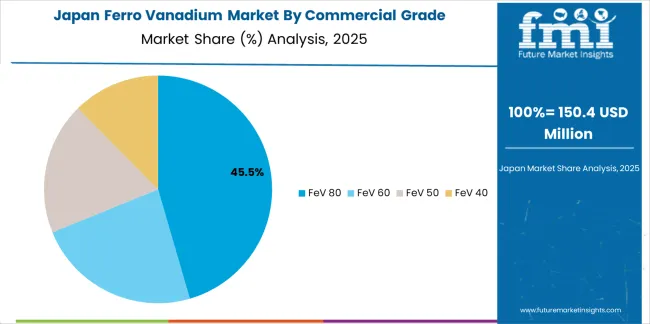
Japan demonstrates steady 3.8% CAGR through fatigue-resistant steels in transportation and disaster-resilience infrastructure that incorporate advanced ferro vanadium for premium formulations in steel, automotive, and construction sectors.
The country leverages engineering expertise in seismic design and transportation steel to maintain quality leadership in specialty ferro vanadium applications. Industrial centers, including Tokyo, Osaka, and Nagoya, showcase premium installations where ferro vanadium systems integrate with earthquake-resistant construction formulations and high-speed rail steel to optimize structural safety and operational performance.
Japanese steel and automotive companies prioritize domestic quality standards and seismic safety credentials in ferro vanadium sourcing, creating demand for high-purity grades with comprehensive documentation supporting building codes and transportation safety requirements.
Market Intelligence Brief:
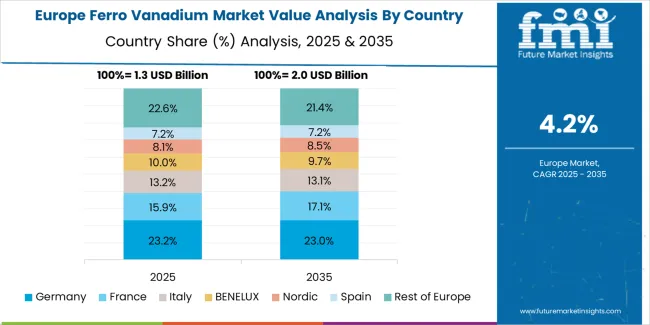
Western Europe accounts for the largest regional demand for ferro vanadium in Europe, led by Germany (about 24% of European consumption) on the back of automotive/machinery HSLA grades and pipeline steels, followed by the United Kingdom (about 15%) with defense, rail and offshore energy applications featuring growing recycling infrastructure.
Italy (about 14%) combines construction steel and machinery manufacturing; France (about 13%) reflects balanced demand across infrastructure and pressure-vessel steels, while the Nordics (about 11% combined, led by Sweden and Finland) skew toward specialty steels and green steel initiatives emphasizing sustainable production.
Spain (about 9%) is supported by construction and wind-supply-chain steels; Benelux (about 8%) benefits from cluster refining/recycling hubs and port logistics infrastructure. The remaining approximately 6% sits across Central & Eastern Europe (notably Poland, Czechia, and Romania) where rebar upgrades and energy infrastructure replacement are lifting ferro vanadium intensity through expanding construction safety standards.
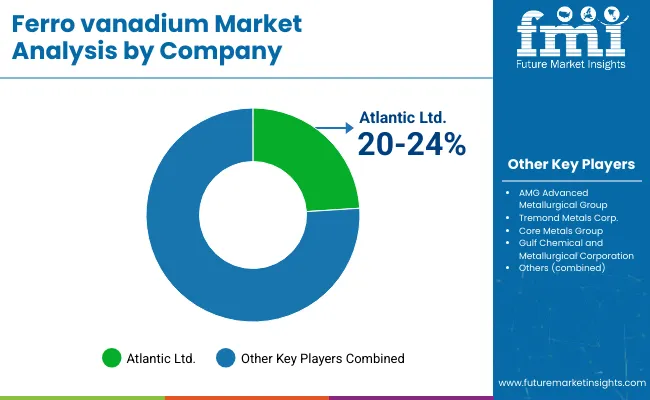
The Ferro Vanadium market operates with moderate concentration, featuring approximately 15-20 meaningful participants, where leading companies control roughly 35-40% of the global market share through established steel industry relationships and comprehensive vanadium resource portfolios. Competition emphasizes vanadium content specifications, supply reliability capabilities, and vertical integration credentials rather than price-based rivalry alone.
Market Leaders encompass Pangang Group Vanadium & Titanium Co. (11.5% market share), AMG Vanadium, and HBIS Chengsteel, which maintain competitive advantages through extensive ferro-alloy production expertise, integrated vanadium mining operations, and comprehensive quality assurance capabilities that create customer loyalty and support premium positioning.
These companies leverage decades of aluminothermic reduction technology experience and ongoing resource integration investments to develop FeV 80 and specialty grades with optimized vanadium content and consistent quality. AMG Vanadium reported 23% year-over-year volume growth in its vanadium business in Q2-2024, underscoring stronger offtake into steel and recycling streams, while Pangang expanded high-grade ferro vanadium capacity to support domestic rebar mandates in 2024.
Technology Innovators include Treibacher Industrie AG and Bear Metallurgical Company, which compete through specialized production technology focus and quality consistency emphasis that appeals to manufacturers seeking certified high-purity sourcing and comprehensive technical support. EVRAZ Stratcor announced 2024 capacity maintenance for North American ferro vanadium production, demonstrating competitive differentiation through regional supply reliability.
Regional Specialists feature companies like Bushveld's Vanchem, JFE Materials, Core Metals Group, and Chengde Jianlong, which focus on specific geographic markets and specialized applications, including aerospace-grade formulations and recycling-derived products. Idemitsu Kosan agreed to acquire 32.5% of Vecco Group's vanadium business in Australia in 2024, linking upstream vanadium with downstream battery and alloy markets, while Bushveld Minerals advanced a restructuring/asset sale process around its Vanchem operations in 2024 to streamline balance sheet and stabilize South African vanadium assets.
Market dynamics favor participants that combine reliable vanadium resource access with advanced aluminothermic reduction capabilities, including FeV 80 production and recycling infrastructure that optimize quality consistency and supply security. Competitive pressure intensifies as traditional ferro-alloy producers expand high-grade capacity while mining companies challenge established players through vertical integration and battery-material positioning targeting premium steel and energy storage segments in developed markets.
| Item | Value |
|---|---|
| Quantitative Units | USD 5.3 billion |
| Commercial Grade | FeV 80, FeV 60, FeV 50, FeV 40 |
| Production Process | Aluminothermic reduction, Silicon reduction, Other/Hybrid routes |
| End Use | Construction & rebar steel, Energy & pipelines, Automotive & transportation steels, Tools/machinery & engineering steels, Aerospace & defense alloys, Other |
| Application | HSLA, earthquake-rated steel, OCTG, pressure vessels, specialty tool steels, fatigue-resistant alloys |
| Regions Covered | Asia-Pacific, North America, Europe, Latin America, Middle East & Africa |
| Countries Covered | China, United States, South Korea, Germany, Australia, United Kingdom, Japan, and 25+ additional countries |
| Key Companies Profiled | Pangang Group Vanadium & Titanium Co., AMG Vanadium, Treibacher Industrie AG, Bear Metallurgical Company, HBIS Chengsteel, EVRAZ Stratcor, Bushveld's Vanchem, JFE Materials |
| Additional Attributes | Dollar sales by commercial grade, production process, end-use, and application categories, regional adoption trends across Asia-Pacific, Europe, and North America, competitive landscape with ferro-alloy producers and integrated mining companies, construction and energy industry preferences for seismic compliance positioning and infrastructure reliability, integration with mandatory rebar programs and grid-scale storage supply chains, innovations in aluminothermic reduction technology and vanadium resource recycling methods, and development of specialized formulations with enhanced vanadium content specifications and comprehensive traceability documentation capabilities. |
The global ferro vanadium market is estimated to be valued at USD 5.3 billion in 2025.
The market size for the ferro vanadium market is projected to reach USD 8.8 billion by 2035.
The ferro vanadium market is expected to grow at a 5.2% CAGR between 2025 and 2035.
The key product types in ferro vanadium market are fev 80, fev 60, fev 50 and fev 40.
In terms of end use, construction & rebar steel (hsla, earthquake-rated) segment to command 34.5% share in the ferro vanadium market in 2025.


Full Research Suite comprises of:
Market outlook & trends analysis
Interviews & case studies
Strategic recommendations
Vendor profiles & capabilities analysis
5-year forecasts
8 regions and 60+ country-level data splits
Market segment data splits
12 months of continuous data updates
DELIVERED AS:
PDF EXCEL ONLINE
Ferroalloy Market Size and Share Forecast Outlook 2025 to 2035
Ferrous Fumarate Market Size and Share Forecast Outlook 2025 to 2035
Ferroelectric RAM Market Size and Share Forecast Outlook 2025 to 2035
Ferrous Gluconate Market Size and Share Forecast Outlook 2025 to 2035
Ferrous Sulfate Market - Size, Share & Forecast 2025 to 2035
Ferro Aluminum Market Growth - Trends & Forecast 2025 to 2035
Breaking Down Market Share in Ferro Manganese
Sodium Ferrocyanide Market Size and Share Forecast Outlook 2025 to 2035
Vanadium redox battery Market

Thank you!
You will receive an email from our Business Development Manager. Please be sure to check your SPAM/JUNK folder too.
Chat With
MaRIA