The global FIDO Authentication market is forecast to grow from USD 2.16 billion in 2025 to USD 15.32 billion by 2035, representing a strong CAGR of 18.3%. This growth is driven by rising demand for secure, passwordless authentication solutions across sectors such as banking, healthcare, government, and e-commerce.
Increasing cyber threats and stricter data privacy regulations are compelling enterprises to adopt FIDO protocols. These protocols offer enhanced security and improved user convenience. The shift toward multi-factor authentication and biometric verification is further accelerating market adoption globally.
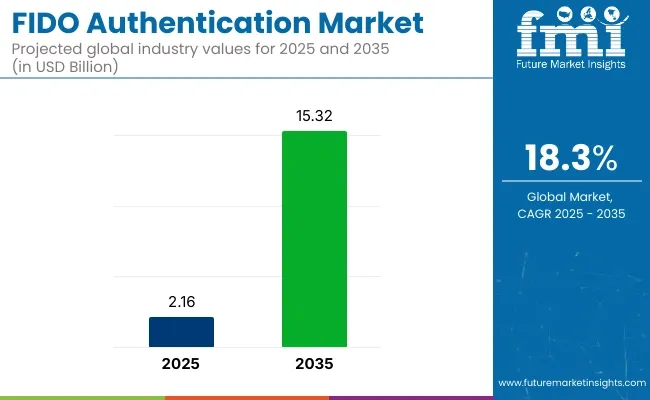
| Attributes | Description |
|---|---|
| Industry Size (2025E) | USD 2.16 billion |
| Industry Size (2035F) | USD 15.32 billion |
| CAGR (2025 to 2035) | 18.3% |
In 2025, the uptake of FIDO authentication solutions is growing rapidly. Organizations are focusing on reducing account takeover fraud and improving overall customer experience. Integration of FIDO standards with smartphones, laptops, and IoT devices is becoming widespread. Recent industry advancements include cloud-based authentication platforms and expanded support for FIDO’s WebAuthn protocol.
Regulatory mandates like GDPR and CCPA are pushing businesses to move away from traditional passwords toward stronger, passwordless alternatives. This is expanding the demand for FIDO-compliant systems in both developed and emerging economies.
Key players shaping the FIDO Authentication market include Yubico Inc., known for its widely used YubiKey hardware security keys that support multiple authentication protocols. Microsoft Corporation is another major player, offering FIDO-compliant solutions integrated within its Azure Active Directory and Windows Hello platforms.
These companies drive innovation in secure, user-friendly authentication across industries. Partnerships among technology vendors, identity providers, and service platforms are further boosting global deployment of FIDO authentication solutions. This collaborative ecosystem supports scalable and interoperable authentication services.
As cyber threats evolve, the FIDO Authentication market is expected to maintain strong momentum through 2035. Industry leaders are emphasizing interoperability and reducing friction in user authentication workflows to enhance adoption. Innovations in biometric sensors, decentralized identity models, and mobile-first authentication approaches are anticipated to redefine access control standards.
As enterprises prioritize both security and seamless user experience, FIDO protocols are poised to become the global standard for passwordless authentication. This market will be driven by ongoing regulatory pressure, increasing digitization, and the need for robust identity verification.
The FIDO (Fast Identity Online) authentication market is projected to grow significantly, driven by key segments such as FIDO authentication SDKs and the Banking, Financial Services, and Insurance (BFSI) sector. FIDO authentication SDKs are expected to dominate the market in terms of market share, while BFSI will remain a leading application sector for FIDO authentication solutions. These segments are anticipated to play a critical role in the overall growth of the market.
FIDO authentication SDKs are expected to dominate the FIDO authentication market, capturing 60% of the share by 2025. SDKs (Software Development Kits) play a crucial role in enabling developers to integrate FIDO authentication solutions into their applications and services. The rise in demand for secure, password-less authentication methods, particularly in online and mobile services, has driven the adoption of FIDO authentication SDKs.
Companies like Microsoft, Google, and Yubico offer SDKs that support FIDO protocols, providing easy-to-implement solutions for enterprises aiming to improve security and reduce the reliance on passwords.
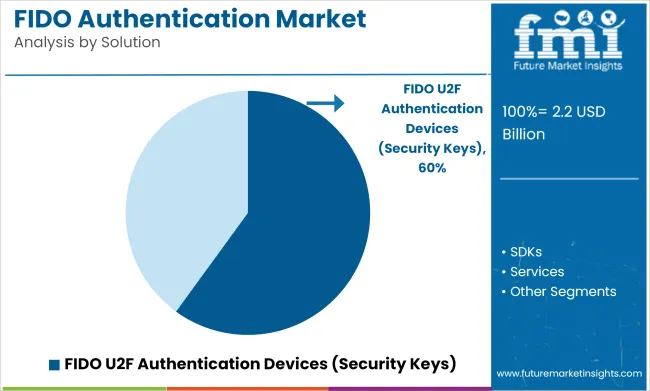
With an increasing focus on reducing cybersecurity risks and improving user experience, FIDO authentication SDKs are becoming the go-to solution for developers looking for secure authentication options. The demand for such solutions is expected to continue growing as industries embrace multi-factor authentication and move toward stronger, more secure authentication methods.
The BFSI (Banking, Financial Services, and Insurance) sector is projected to capture 26% of the FIDO authentication market share by 2025. This sector has been one of the earliest adopters of FIDO authentication due to the critical need for secure, seamless, and efficient identity verification methods.
Financial institutions, banks, and insurance companies are increasingly integrating FIDO authentication solutions into their digital platforms to safeguard sensitive customer data and transactions. The increasing incidence of fraud, coupled with stringent regulatory requirements, has led BFSI organizations to adopt multi-factor authentication solutions that are both secure and user-friendly.
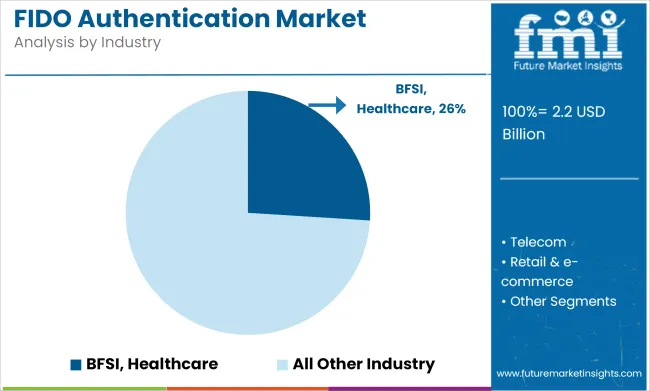
As the sector continues to digitalize its operations, FIDO authentication provides an ideal solution by offering password-less and highly secure authentication options for online banking, mobile payments, and financial services.
Companies like JPMorgan Chase, Bank of America, and Wells Fargo are leveraging FIDO authentication to enhance their security measures. As digital financial services continue to expand, the BFSI sector will remain a key driver of growth in the FIDO authentication market.
| Company | Microsoft Corporation |
|---|---|
| Contract/Development Details | Implemented FIDO2-compliant authentication across its enterprise services, eliminating password use and enhancing security through biometric and hardware-based authenticators for millions of users worldwide. |
| Date | May 2024 |
| Contract Value (USD Million) | Approximately USD 100 |
| Renewal Period | 5 years |
| Company | Google LLC |
|---|---|
| Contract/Development Details | Expanded its FIDO authentication framework to encompass all consumer and enterprise services, providing users with seamless and secure access through physical security keys and biometric verification methods, reducing phishing and account takeover incidents. |
| Date | November 2024 |
| Contract Value (USD Million) | Approximately USD 80 |
| Renewal Period | 4 years |
Rapid Rise in Cyber Security Concerns Such as Phishing, Password Spraying, Keylogging Or Brute Force Attacks.
Threats such as phishing, password spraying, key logging, or brute force attacks also influence the rapid adoption of FIDO (Fast Identity Online) authentication. Password-based authentication systems are riskier by standard because of the trickery used by cybercriminals.
By circumventing the traditional username and password login steps, these attacks pave the way to unauthorized access of user accounts and the theft of sensitive information.
FIDO authentication also improves the user experience by making log in faster. Well, with passwords becoming a serious security concern, users no longer even have to bother about remembering complex passwords. With FIDO, customers need only insert a security key into their device or use body-based methods (such as fingerprints or face recognition) to log in immediately.
In 2024, the microsoft's digital defense report was based on password threats which clearly showed that 70% of password breaches were due to phishing attacks. This represented a 220% increase over the previous year in strong authentication utilization.
But, not every MFA method is tamper resistance. Rather than attacking the MFA itself, hackers try to trick users into revealing sensitive information to steal logins, credit card numbers and other sensitive data.
Rapid Development Of Digital Technology And Increasing Awareness of the Importance of Information Security
Digital tech has taken gradual steps in improving connectivity and led to IoT revolution. The impending expansion of IoT gadgets and linked systems creates intricate digital settings that need safe ways to verify users.
The evolution of mobile technology has transformed how users consume and interact with online services. Mobile phones and portable devices became the primary device for internet browsing and e-commerce shopping.
The expansion of digital tech is fueling a boom in digital services and solutions in different areas. These services often handle confidential user information, finance, and sensitive data. Explanation of FIDO Authentication FIDO authentication is designed to be a more effective and secure method of verifying users compared to traditional password techniques.
It caters to the increasing demand for enhanced security within the digital landscape. As digital transformation continues to disrupt numerous sectors and domains, the demand for robust user-verification tools is essential. With the rise of mobile devices, cloud computing, and Internet of Things (IoT) gadgets, better ways to check users that can keep up with these tech advances are needed.
Rules, in use and in progress, and industry guidelines increasingly require the use of safe login methods. In Asia, countries such as Taiwan, Korea, Japan, India, and Thailand began adopting FIDO standards into government, business and consumer apps to enhance service security and unleash user convenience.
But if you step back and think long term, we can layer FIDO standards into factories, supply chains, healthcare, and other sectors to help more people and businesses benefit from something good.
Growing Demand for FIDO Identity Verification
With the increasing number of online activities,⁴±8 the demand for FIDO identity verification is also on the rise. As more people shop, bank and use other web services, it’s crucial to ensure that users really are who they say they are. FIDO authentication addresses this issue by providing a secure and efficient mechanism for identity verification.
This prevents fraud, identity theft and access to private information by unauthorized individuals. So, when people can see the disadvantages of traditional identity checks, it's increasing the demand for FIDO identity verification.
FIDO identity checks are also being driven by user expectations for easy, and seamless login processes. Xiaomi FIDO login replaces the inconvenience of memorization of complicated passwords. It allows signing in with familiar to the user and preferred methods, like fingerprints, face scans or security keys. In this way, it reduces friction on users, and enhances their happiness, encouraging more users to adopt FIDO-based login methods.
In 2023, Source, a leading identity proofing and fraud solution provider, joined the FIDO (Fast Identification Online) Alliance. This group pools different industries together to form open compatible authentication standards.
These standards are designed to ensure that identity verification is easy, private and secure and reduces our reliance on weak/compromised passwords. This method also assists in identifying reliable consumers and with minimal inconvenience.
Device Alert Authentication Can Cause Issues When a Device Gets Lost or Disabled, Such Factors Are Projected to Limit the Market Growth
FIDO authentication requires a particular device, such as a phone or security key, to authenticate the user. This device acts as a second proof of identity together with the user’s login credentials. But if someone loses, gets their equipment stolen or if it breaks, they could have a hard time logging into their accounts or systems.
And if a user can’t use their device because it’s missing or broken, they might have a difficult time regaining access to their accounts if there’s no other means of verifying their identity. This can be frustrating and prevent the user from completing their work or accessing vital applications.
Relying on a single device for authentication is a dangerous game. If that device is your sole method of access, and it is unavailable, you can find yourself locked out of critical accounts or systems.
This vulnerability does show an important analogy of why it is also important to have alternative login ways or emergency work arounds. These precautions minimize the risk of getting locked out if your device is lost or malfunctions.
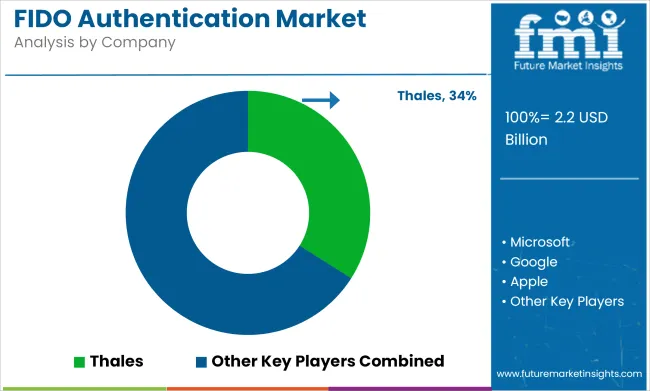
Tier 1 corporations include the likes of Thales Group, HID Global (ASSA ABLOY Group), Microsoft, Google, Cisco, and Yubico, with these heavyweights driving much of the business in the FIDO authentication space. These companies have a large global presence tons of capital, and popular trademarks.
This also allows them to be ahead of the game on innovation and harnessing of FIDO standards. They offer complete authentication packages that slot into larger cybersecurity systems. Their products are used in many industries. They have a reach and a power and a share of the market. That places them at a position to influence market trends and advance technology.
Tier 2 consists of companies such as Onespan, RSA Security, FEITIAN Technologies, Duo Security, and Identiv. These companies are fierce competition in the space of FIDO authentication. They offer complementary solutions based on security and compliance.
They might not serve as many customers as the biggest companies, but they’re enough of a household name to represent a bucket of industries. These companies are known for their creative concepts around the safe authentication of people. They usually focus on certain markets or conditions where their commodities can do a great job such as financing or government kinds of things.
Tier 3 includes emerging and niche players mk Group, Crayonic, Hypersecu, LoginID, heylogin GmbH, Bluink, Ensurity, and Octatco. These operyatalos are relatively new to the FIDO authentication market or have niche focuses that serve part of the market.
They move faster most often bringing innovative and game-changing solutions to customers. While they may not serve the same number of users as Tier 1 or Tier 2 companies, they are also critical for driving particular innovations and fulfilling niche customer needs in regional markets or dedicated industries.
The section highlights the CAGRs of countries experiencing growth in the FIDO Authentication market, along with the latest advancements contributing to overall market development. Based on current estimates China, India and USA are expected to see steady growth during the forecast period.
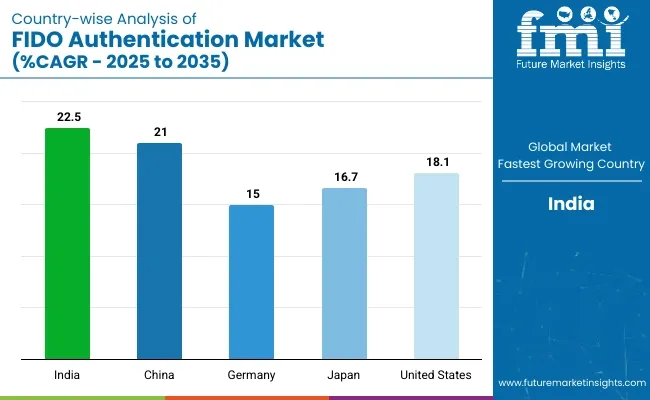
| Countries | CAGR from 2025 to 2035 |
|---|---|
| India | 22.5% |
| China | 21.0% |
| Germany | 15.0% |
| Japan | 16.7% |
| United States | 18.1% |
Fido Authentication Adopted by Banking & FinTech Sector Traditional methods of authentication based on passwords have turned out to be vulnerable resulting in an increase of credential-based attacks. As a reaction, financial institutions are implementing passwordless solutions, like biometrics and FIDO standards, to decrease these threats.
This change strengthens security and makes the user authentication process simpler with less friction, creating a better customer experience overall. Consequently, this sector is witnessing exponential growth in the FIDO authentication market post-pandemic within banking and fintech due to the need for secure and user-friendly methods of providing services.
China is anticipated to see substantial growth at a CAGR 21.0% from 2025 to 2035 in the FIDO Authentication market.
Fido authentication is helping india’s banking and fintech sectors to uplift security and user experience. Driven by the Reserve Bank of India's Digital Payment Security Controls Directions 2020 mandating financial institutions to employ robust authentication measures, the FIDO adoption is picking up in this sector very fast.
In just one year, online banking fraud accounted for 4,047 cases, while OTP fraud accounted for 1,093 cases, underscoring the need for rigorous security measures. In order to mitigate these threats, there is a growing acceptance among Indian banks and fintech firms of biometric authentication and hardware security keys.
The rise of biometric authentication in consumers' preference has been perceptive, with 52% of online banking consumers opting for biometric authentication over traditional methods. India’s fintech adoption rate is 87 percent, one of the highest in the world, and India now has about 6,600 fintech startups with total valuation between 2021 and 2022 reaching USD 31 billion.
As this was used for online verification in place of CAPTCHA in this case, FIDO solutions serve as a secure alternative for digital transactions, reducing reliance on passwords while adhering to regulatory framework with Aadhaar-based authentication at mainstream. India's FIDO Authentication market is growing at a CAGR of 22.5% during the forecast period.
Passwordless authentication is being adopted in a very big way in the USA healthcare and enterprise domains for better security and efficiency. In December 2024, the USA Department of Health and Human Services proposed new cybersecurity requirements such as mandatory multifactor authentication and encryption to protect healthcare data.
This regulatory effort has given a boost to passwordless authentication in hospitals, clinics, and healthcare IT systems. Because of growing cyber threats, enterprises are also focusing on phishing-resistant authentication, resulting in mass adoption of FIDO-based solutions.
The global password less authentication market including USA was valued at USD 18.82 billion in 2024 and is estimated to reach USD 60.34 billion by 2032, registering a CAGR of 15.8% during the forecast period. Passkeys have been adopted by leading tech companies in the USA, such as Apple and Google, as a standard authentication method, spurring wider adoption by enterprises.
As more institutions acknowledge the dangers of passwords, biometric authentication and security keys are emerging as the preferred means of data access integrity. USA. is anticipated to see substantial growth in the FIDO Authentication market significantly holds dominant share of 78.5% in 2025.
The FIDO Authentication market report also highlights market driving and restraining factors, market competition, and increasing industry players. From biometrics, passkeys and hardware security keys with fingerprint data - to other unique biometric identifiers - leading players are working to improve authentication.
The growth of the market is primarily driven by strategic collaboration and acquisition activities along with regulatory compliance, and organizations are consistently enhancing interoperability and security standards. With a growing focus on phishing-resistant authentication, enterprises are ramping up competition among vendors to deliver scalable and user-friendly options.
Recent Industry Developments in FIDO Authentication Market
| Report Attributes | Details |
|---|---|
| Current Total Market Size (2025) | USD 2.16 billion |
| Projected Market Size (2035) | USD 15.32 billion |
| CAGR (2025 to 2035) | 18.3% |
| Base Year for Estimation | 2024 |
| Historical Period | 2020 to 2024 |
| Projections Period | 2025 to 2035 |
| Quantitative Units | USD million for value and thousand licenses for volume |
| Solutions Analyzed (Segment 1) | FIDO U2F Authentication Devices (Security Keys), FIDO Authentication SDKs, Services |
| Enterprise Sizes Analyzed (Segment 2) | Small and Medium Enterprises, Large Enterprises |
| Industries Analyzed (Segment 3) | BFSI, Healthcare, Telecom, Retail & E-commerce, Government, IT/Professional Services, Others |
| Regions Covered | North America; Latin America; Western Europe; Eastern Europe; South Asia and Pacific; East Asia; Middle East & Africa |
| Countries Covered | United States, Canada, Mexico, Brazil, Argentina, Germany, France, United Kingdom, Italy, Spain, Netherlands, China, India, Japan, South Korea, ANZ, GCC Countries, South Africa |
| Key Players influencing the FIDO Authentication Market | Thales, Yubico, Microsoft, Google, Apple, HID Global, RSA Security, Okta, Ping Identity, Samsung |
| Additional Attributes | Trends in passwordless security and device-level FIDO integration, Adoption in banking and government sectors, Shift toward SDK and cloud-based identity APIs, Role of biometrics and security tokens in decentralized identity architectures |
| Customization and Pricing | Customization and Pricing Available on Request |
In terms of Solution, the segment is segregated into FIDO U2F Authentication Devices (Security Keys), FIDO Authentication SDKs and Services.
In terms of Enterprise Size, the segment is segregated into Small and Medium Enterprise Size and Large Enterprises.
In terms of Industry, the End User is distributed into BFSI, Healthcare, Telecom, Retail & e-commerce, Government, IT/Professional Services and Others.
A regional analysis has been carried out in key countries of North America, Latin America, East Asia, South Asia & Pacific, Western Europe, Eastern Europe and Middle East and Africa (MEA), and Europe.
The Global FIDO Authentication industry is projected to witness CAGR of 18.3% between 2025 and 2035.
The Global FIDO Authentication industry stood at USD 2.16 billion in 2025.
The Global FIDO Authentication industry is anticipated to reach USD 15.32 billion by 2035 end.
South Asia & Pacific is set to record the highest CAGR of 20.8% in the assessment period.
The key players operating in the Global FIDO Authentication Industry Thales, Yubico, Microsoft, Google, Apple, HID Global, RSA Security, Okta, Ping Identity, Samsung.


Full Research Suite comprises of:
Market outlook & trends analysis
Interviews & case studies
Strategic recommendations
Vendor profiles & capabilities analysis
5-year forecasts
8 regions and 60+ country-level data splits
Market segment data splits
12 months of continuous data updates
DELIVERED AS:
PDF EXCEL ONLINE
Bifidobacterium Market Size and Share Forecast Outlook 2025 to 2035
Authentication and Brand Protection Market Size and Share Forecast Outlook 2025 to 2035
Authentication Solution Market Analysis - Size, Share, and Forecast Outlook 2025 to 2035
Market Share Breakdown of Authentication Solutions Manufacturers
Cloud Authentication Market Size and Share Forecast Outlook 2025 to 2035
Crypto Authentication ICs Market Growth – Trends & Forecast through 2034
Adaptive Authentication Market Insights - Growth & Forecast 2025 to 2035
Risk-based Authentication (RBA) Market
Out of Band Authentication Market Size and Share Forecast Outlook 2025 to 2035
Mobile User Authentication Market
Multi-Factor Authentication Market by Model by Application & Region Forecast till 2035
Passwordless Authentication Market Report – Growth & Industry Trends 2024-2034
Flash Calling Authentication Market Size and Share Forecast Outlook 2025 to 2035
3D Secure Payment Authentication Market Insights by Components, Application, and Region - 2025 to 2035
Access Control and Authentication Market Analysis & Forecast by Technology, Component, Application and Region through 2035
Automotive End-Point Authentication Market Size and Share Forecast Outlook 2025 to 2035
Device-Embedded Biometric Authentication Market Size and Share Forecast Outlook 2025 to 2035

Thank you!
You will receive an email from our Business Development Manager. Please be sure to check your SPAM/JUNK folder too.
Chat With
MaRIA