The Out of Band Authentication Market is estimated to be valued at USD 1.7 billion in 2025 and is projected to reach USD 6.0 billion by 2035, registering a compound annual growth rate (CAGR) of 13.2% over the forecast period.
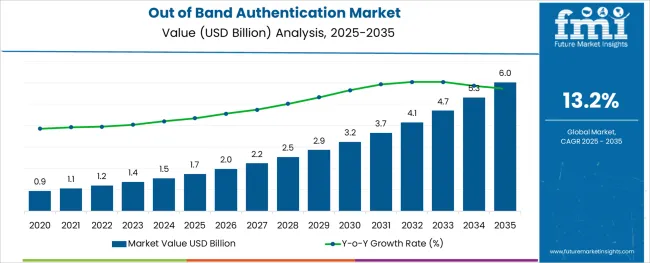
The out of band authentication market is witnessing steady expansion as enterprises and service providers intensify their focus on cybersecurity solutions capable of mitigating the rising incidence of sophisticated phishing, credential theft, and social engineering attacks. Heightened regulatory scrutiny and stringent compliance mandates in sectors such as banking, financial services, healthcare, and government are driving the adoption of multi-factor and out of band authentication mechanisms that provide an additional security layer beyond primary credentials.
Demand has been further accelerated by the proliferation of remote working practices, cloud-based enterprise environments, and growing consumer-facing digital transactions. Industry participants are increasingly investing in the integration of biometric, mobile push, and risk-based authentication features to enhance user experience while maintaining high security standards.
Over the forecast period, the market is anticipated to benefit from a convergence of privacy-focused authentication protocols and AI-powered threat analytics, supporting broader enterprise cybersecurity initiatives. The growing emphasis on frictionless and adaptive authentication technologies positions the market for consistent growth as organizations seek to balance regulatory obligations with seamless end-user access.
The market is segmented by Component, Organization Size, Authentication Channels, Deployment Type, and Vertical and region. By Component, the market is divided into Solutions, Hardware Solutions, Software Solutions, Services, Professional Services, and Managed Services. In terms of Organization Size, the market is classified into SMEs and Large Enterprises. Based on Authentication Channels, the market is segmented into SMS, Email, Push Notification, Voice, Token-Based, and Others (Facial, Palm, IRIS, etc.). By Deployment Type, the market is divided into Cloud and On-premises.
By Vertical, the market is segmented into Banking, Financial Services, and Insurance, Government and Defense, Retail, Healthcare, IT and Telecom, Energy and Utilities, and Others (Manufacturing, Travel, etc.). Regionally, the market is classified into North America, Latin America, Western Europe, Eastern Europe, Balkan & Baltic Countries, Russia & Belarus, Central Asia, East Asia, South Asia & Pacific, and the Middle East & Africa.
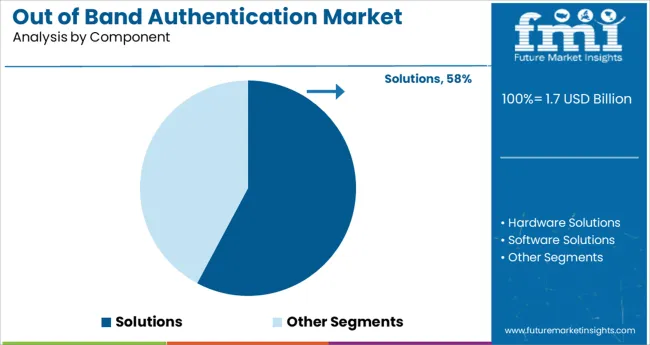
The solutions segment dominated the out of band authentication market with a commanding 57.8% market share, attributed to the growing necessity for comprehensive and scalable authentication frameworks among enterprises and digital service providers. The dominance of solutions offerings has been driven by the rising demand for integrated, configurable authentication platforms capable of supporting multi-channel, risk-based, and contextual access control.
Increasing incidents of data breaches and unauthorized system access have compelled organizations to deploy flexible authentication solutions that operate independently of the primary login channel, effectively minimizing the risk of credential compromise. Vendors in this space continue to enhance their product portfolios with capabilities such as biometric verification, AI-driven anomaly detection, and mobile push notifications, broadening their appeal across both enterprise and consumer applications.
The solutions segment is expected to maintain its market leadership as businesses increasingly prioritize advanced identity protection measures and seek adaptable authentication systems to secure digital transactions and cloud-hosted infrastructure.
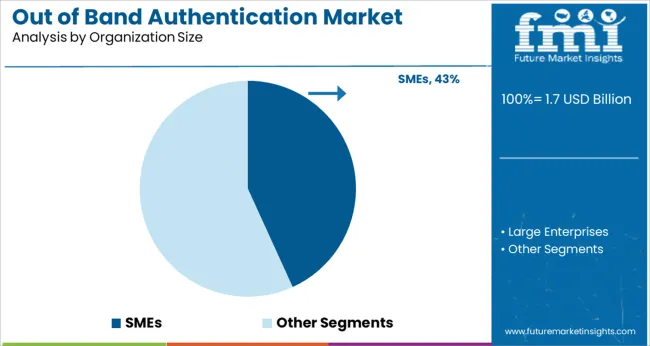
In terms of organization size, small and medium-sized enterprises (SMEs) represented a notable 43.2% share of the out of band authentication market, underscoring the increasing cybersecurity awareness within this traditionally underserved segment. The adoption of out of band authentication solutions by SMEs has been accelerated by the rapid digitalization of business operations and an uptick in online customer interactions, necessitating robust and cost-effective security measures.
Regulatory compliance pressures and heightened exposure to targeted attacks have further incentivized SMEs to invest in multi-factor and contextual authentication systems, ensuring business continuity and safeguarding sensitive data. The flexibility, affordability, and scalability of cloud-based and API-driven out of band authentication services have made them particularly attractive to SMEs with limited internal IT resources.
Continued market growth is expected as security solution providers introduce tailored, subscription-based offerings designed to meet the specific operational and budgetary requirements of this dynamic business segment.
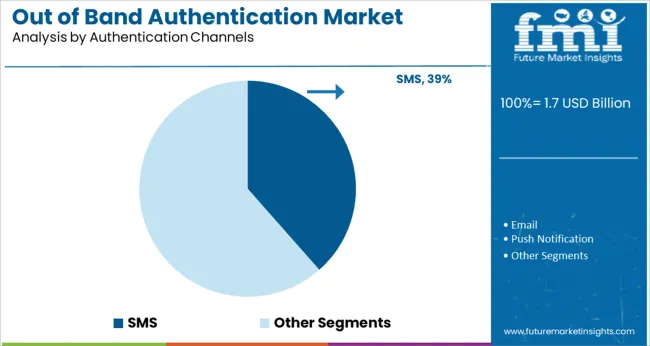
Among authentication channels, SMS emerged as the leading medium, capturing a 38.5% market share in the out of band authentication market due to its ubiquity, ease of implementation, and familiarity among end-users. Despite increasing scrutiny over potential vulnerabilities associated with SMS-based verification, it remains one of the most widely deployed out of band authentication methods across financial services, e-commerce, and enterprise applications.
Its ability to deliver timely one-time passcodes (OTPs) on devices independent of internet connectivity continues to support its use in diverse transactional environments. The cost-effectiveness and minimal infrastructure requirements associated with SMS authentication have contributed to its sustained adoption, particularly among SMEs and organizations in regions with limited access to advanced authentication alternatives.
While industry players progressively integrate mobile app-based push notifications and biometric modalities, the SMS channel is anticipated to maintain significant relevance as a complementary verification method, especially in multi-factor authentication frameworks targeting broad, geographically dispersed user bases.
Growing security and data privacy concerns to propel the growth of the market
Out of band authentication enable data security and data privacy, which is expected to be the most significant factor driving the market during the forecast period. Data privacy is the main concern in industries, such as financial services, payment cards, baking, insurance, and healthcare sectors. All these companies follow the data privacy and security requirement set by regulatory authorities. This results in increased demand for band authentication.
Also, the presence of stringent rules and regulations related to data privacy contributed to the growth of the out-of-band authentication market in the coming years. Also, developments in artificial intelligence (AI), the Internet of Things (IoT), and big data technologies are projected to boost the application of data privacy solutions among organizations.
Growing online transaction and compliance requirements boost the growth of the out-of-band authentication market
A growing number of online transactions and compliance requirements are one of the major driving factors of the out-of-band authentication market. The frequency of cyber-attack is high in online transactions thus to minimize the cyber-attack many organizations are adopting authentication methods such as phone-based authentication, software OTP tokens, hardware one-time passwords (OTP) tokens, and others to make secure online transactions. Moreover, hackers always target lucrative sectors, which have a huge online customer base.
For instance, in April 2020, Worldpay, Inc., a global payment technology provider, announced the launch of ‘FraudSight’, which is a new solution designed to prevent fraud and optimize approval rates, potentially boosting revenue across all channels. According to Worldpay, Inc., FraudSight can make transaction validity decisions for merchants of all sizes.
The increasing use of laptops, tablets, smartphones, and smart gadgets has increased the usability of various internet-based solutions and services across the world. For instance, as of April 2025, there were five billion internet users worldwide, which is 63% of the global population. Increasing use of cloud-based technology such as Artificial intelligence, big data, and blockchain in many enterprises impelled the growth of the market.
The growing trend of bring your own device (BYOD) in many industries allows their employees to utilize the benefits of greater flexibility, collaboration, and work-life balance for improving productivity due to this, there is a sudden hike in the number of businesses implementing enterprise mobility solutions that enable and encourage employees to work at anytime, anywhere, from a wide range of devices. This trend has raised security-related issues which are expected to drive the growth of the band authentication market.
With a major emphasis on the precision of out-of-band authentication, governments are augmenting capabilities by incorporating advanced systems such as information technology, cloud computing, AI, and cyber security among others. Innovative progression in authentication services to provide high security in financial institutions and different industries is a key factor driving market growth.
Adopting software solution that generates one-time passcodes (OTPs) and is sent using via email or SMS text message is expected to drive the out-of-band authentication market Also rising adoption of out-of-band authentication by small and medium-sized businesses is expected to provide numerous opportunities for out-of-band authentication market globally during the forecast period. Attributed to these promising trends, it is no surprise that demand for Out of band authentication systems is projected to rise significantly in forthcoming years.
High risks involved in out-of-band authentication with SMS and the high product association cost hampered the global out-of-band authentication market growth. The lack of out-of-band authentication AI experts is anticipated to act as a significant restraint to the market in the forecast period. Out-of-band authentication AI is at a nascent stage and is complex in nature.
Therefore, organizations demand expertise in managing out-of-band authentication solutions powered by AI. The technology offers various benefits, however, lack of awareness, inadequate funding, and poor investments are likely to hamper the market growth in the forecast period. Also, uncertain regulations are also projected to hinder the industry growth.
As per the analysis, by component, the solution segment is likely to expand at a CAGR of 12.4% during the forecast period. The solution segment is expected to flourish owing to the increasing demand for out-of-band authentication-based platforms across various spheres of enterprises to assure safe transaction models in their business units. On the other hand, the services segment is projected to witness significant demand in the coming time. The growth can be attributed to the growing demand for out-of-band authentication services like professional services and managed services is expected to boost the segment growth.
By organization size, the SME segment is projected to record a 12.4% CAGR in the forecast period. The segment is projected to garner a larger market share in the coming time. The growth of the segment can be attributed to the growing incidences of cyber-attacks on enterprises. SMEs serve many customers all over the world. On the other hand, the large enterprise segment is expected to record significant growth due to the growing investments in out-of-band authentication platforms by governments.
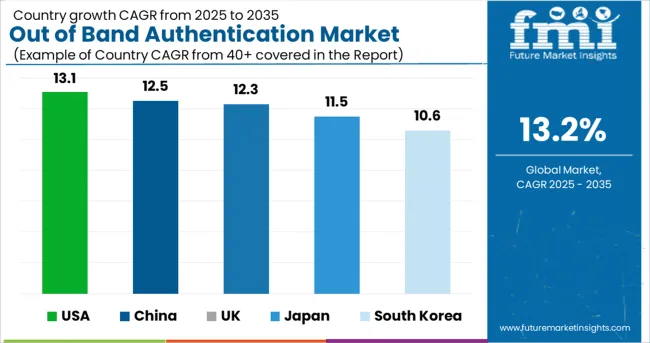
Country-wise Forecast CAGRs for the Out of Band Authentication Market.
| Countries | Estimated CAGR |
|---|---|
| USA | 13.1% |
| UK | 12.3% |
| China | 12.5% |
| Japan | 11.5% |
| South Korea | 10.6% |
According to the analysis, the global market is estimated to be dominated by North America. The USA is anticipated to garner the largest market share in the forecast period. It is estimated at USD 1.5 Billion, recording a CAGR of 13.1% during the forecast period. Also, the government in the USA is focused on deploying band authentication-based solutions in various spheres.
Increasing adoption of the use of information systems to support its basic and essential business functions in the region boost the growth of the market. North America accounts for the highest share during the forecast period due to the presence of many out-of-band authentication vendors. For instance, the Government of Canada uses an out-of-band token, a combination of a physical device (e.g., mobile phone, landline telephone), and a secret that is transmitted to the device by a verifier each time authentication is required.
Europe is likely to garner considerable market share with the UK contributing USD 179.2 Million, expanding at 12.3% CAGR. Sectors such as ITC, automotive, media, and entertainment, among others, are some of the most significant consumers. Also, rapid digitalization is expected to positively benefit the market in the region in the coming time. In addition, growing partnerships among players are expected to augment the market in the UK.
Asia Pacific is projected to be the most lucrative market in the assessment period. The region is witnessing rapid adoption of advanced technologies, which acts as a salient factor boosting the market in APAC.
Emerging nations such as China, Japan, and South Korea are recognized to be the most remunerative markets. As per the analysis, China, Japan, and South Korea are projected at USD 300.1 Million, USD 242.0 Million, and USD 151.0 Million respectively.
Also, the three countries are expected to flourish at a healthy CAGR with China expanding at 12.5%, Japan at 11.5%, and South Korea at 10.6% in the forecast period. The development of the region can be attributed to the increasing investments by governments.
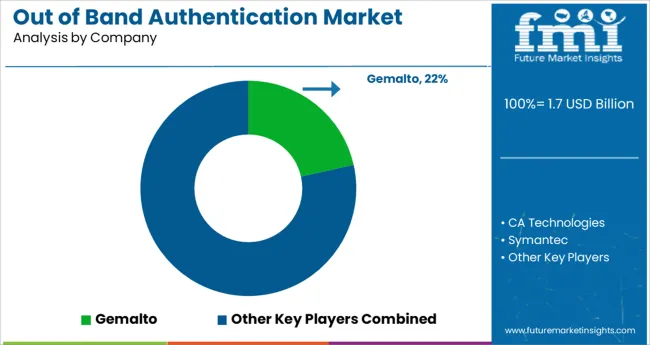
Key players in the global out-of-band authentication market include Gemalto, CA Technologies, Symantec, Ping Identity, and RSA Security among others. Market players are leveraging strategic collaborative initiatives to increase their market share and increase their profitability.
Recent developments among key players are:
The global out of band authentication market is estimated to be valued at USD 1.7 billion in 2025.
It is projected to reach USD 6.0 billion by 2035.
The market is expected to grow at a 13.2% CAGR between 2025 and 2035.
The key product types are solutions, hardware solutions, software solutions, services, professional services and managed services.
smes segment is expected to dominate with a 43.2% industry share in 2025.


Full Research Suite comprises of:
Market outlook & trends analysis
Interviews & case studies
Strategic recommendations
Vendor profiles & capabilities analysis
5-year forecasts
8 regions and 60+ country-level data splits
Market segment data splits
12 months of continuous data updates
DELIVERED AS:
PDF EXCEL ONLINE
Outbound Travel Industry Analysis in the United Kingdom Forecast and Outlook 2025 to 2035
Outdoor Boundary Vacuum Load Switch Market Size and Share Forecast Outlook 2025 to 2035
Outdoor LED Lighting Market Size and Share Forecast Outlook 2025 to 2035
Outdoor Payment Terminal Market Size and Share Forecast Outlook 2025 to 2035
Outbound Medical Tourism Market Size and Share Forecast Outlook 2025 to 2035
Outbound Logistics Market Size and Share Forecast Outlook 2025 to 2035
Outdoor Commercial Grills Market Size and Share Forecast Outlook 2025 to 2035
Outdoor Kitchen Appliances Market Size and Share Forecast Outlook 2025 to 2035
Outdoor Furniture Market Size and Share Forecast Outlook 2025 to 2035
Outdoor Safety Locks Market Size and Share Forecast Outlook 2025 to 2035
Outdoor LED Display Market Size and Share Forecast Outlook 2025 to 2035
Outdoor Residential Switchgear Market Size and Share Forecast Outlook 2025 to 2035
Outdoor Power Equipment Market Analysis Size and Share Forecast Outlook 2025 to 2035
Outdoor Living Structure Market Size and Share Forecast Outlook 2025 to 2035
Outdoor Toys Market Size and Share Forecast Outlook 2025 to 2035
Outdoor Apparel and Accessories Market Size and Share Forecast Outlook 2025 to 2035
Outpatient Clinics Market Trends and Forecast 2025 to 2035
Outsourced Testing Services Market Insights – Trends & Forecast 2025 to 2035
Outdoor Public Safety Market Growth Size, Demand & Forecast 2025 to 2035
Out-door Signage Market Growth – Demand & Forecast 2025 to 2035

Thank you!
You will receive an email from our Business Development Manager. Please be sure to check your SPAM/JUNK folder too.
Chat With
MaRIA