Outdoor Power Equipment Market Size and Share Forecast Outlook 2025 to 2035

The global outdoor power equipment market is projected to grow from USD 38.4 billion in 2025 to approximately USD 55.1 billion by 2035. This represents an absolute value addition of USD 16.7 billion over the decade, reflecting a total increase of 43.5% and an expected CAGR of 3.7%. Market size is anticipated to grow by nearly 1.44X during the forecast period, driven by growing landscaping activities, electrification of garden tools, and expansion in residential and commercial green space maintenance.
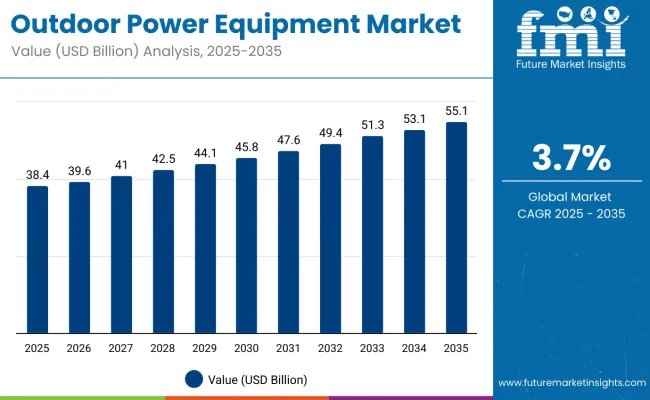
Quick Stats For Outdoor Power Equipment Market

  • Industry Value (2025): USD 38.4 billion
  • Forecast Value (2035): USD 55.1 billion
  • Forecast CAGR: 3.7%
  • Leading Segment (2025): Lawn Mowers (30% share)
  • Key Growth Region: North America and Europe
  • Top Key Players: Husqvarna, Deere & Company, Stanley Black & Decker, The Toro Company, Honda Motor Company

Outdoor Power Equipment Market

Metric Value
Industry Size (2025E) USD 38.4 billion
Industry Size (2035F) USD 55.1 billion
CAGR (2025-2035) 3.7%

Between 2025 and 2030, the outdoor power equipment market is projected to expand from USD 38.4 billion to USD 45.8 billion, adding USD 7.4 billion in value. This phase is expected to be led by rising homeowner interest in DIY landscaping and gardening, especially in North America and parts of Europe. Growth in battery-powered and low-emission equipment is also influencing replacement cycles for mowers, trimmers, and hedge cutters. Manufacturers are responding with modular platforms and app-based diagnostics to improve tool interoperability and user experience.

From 2030 to 2035, the market is projected to grow from USD 45.8 billion to USD 55.1 billion, registering a value addition of USD 9.3 billion. Demand will be reinforced by municipal investments in park maintenance and sports facility upgrades, along with commercial landscaping companies standardizing on robotic mowers and electric ride-on solutions. Regulatory trends toward noise and emission control in urban zones will continue to influence product development, especially for multi-purpose outdoor systems and autonomous equipment.

Between 2020 and 2025, the outdoor power equipment market expanded from USD 33.2 billion to USD 38.4 billion, recording an absolute growth of USD 5.2 billion. The period marked a transition from traditional gasoline-powered tools to electric and hybrid formats across key product categories such as lawn mowers, chainsaws, string trimmers, and snow blowers.

Lockdowns during 2020 and 2021 temporarily boosted residential landscaping demand as homeowners invested in lawn care and outdoor renovation, particularly in North America and parts of Europe. The demand gradually normalized by 2022, but the preference for battery-powered and noise-compliant equipment became more prominent.

Commercial buyers, especially landscaping firms and facility managers, began adopting zero-emission equipment to comply with evolving city ordinances and sustainability mandates. Manufacturers prioritized the development of brushless motors, modular battery platforms, and compact equipment with improved ergonomics to meet both residential and light commercial expectations.

Why the Outdoor Power Equipment Market is Growing?

The growth of the outdoor power equipment market is supported by rising demand for battery-powered tools, expanding urban landscaping projects, and stricter noise and emission regulations across developed and developing economies. The transition away from internal combustion engines is influencing both product development and procurement practices globally.

A key driver is the push toward sustainability and environmental compliance. Regulatory bodies in the United States, Europe, and parts of East Asia have introduced or proposed restrictions on gasoline-powered equipment, encouraging municipalities and commercial buyers to shift toward battery-electric alternatives. Residential users are increasingly choosing quieter, lighter, and low-maintenance products, accelerating the adoption of cordless tools for yard maintenance and gardening.

The market is also benefitting from improvements in lithium-ion battery performance, enabling longer runtime and faster charging, making battery-powered solutions more viable even for heavy-duty applications. Meanwhile, DIY trends and increased home ownership in suburban zones have expanded the user base of outdoor equipment, particularly in North America.

Segmentation Overview

The market is segmented by equipment type into lawn mowers, chainsaws, trimmers and edgers, blowers, tillers and cultivators, snow throwers, and others, supporting a range of landscaping and outdoor maintenance functions. Power source segmentation includes fuel-based, electric, battery-powered, and hybrid systems, offering varying degrees of mobility, runtime, and emissions control. End-use categories are divided into commercial, residential, and industrial users, each exhibiting distinct procurement behavior based on operational intensity, budget constraints, and equipment lifecycle priorities.
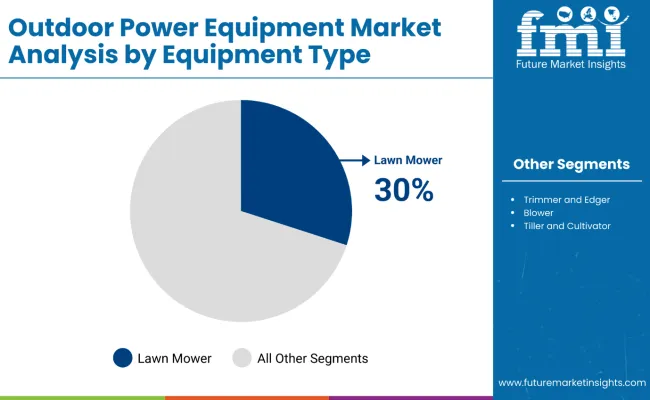
Lawn mower demand remains dominant in landscaping equipment usage

Outdoor Power Equipment Market By Equipment

Lawn mowers captured 30% of the market in 2025 and are projected to grow at a CAGR of 3.5% through 2035. Their widespread use in both residential and commercial lawn care continues to support consistent demand across developed regions. The segment benefits from broad product availability ranging from manual push mowers to robotic and ride-on variants.

Increasing emphasis on green space maintenance, particularly in municipalities and large real estate developments, has sustained volume demand. Features such as variable cutting height, GPS navigation, and noise reduction are being incorporated into newer models, particularly battery-powered ones, to appeal to eco-conscious buyers and commercial users alike.
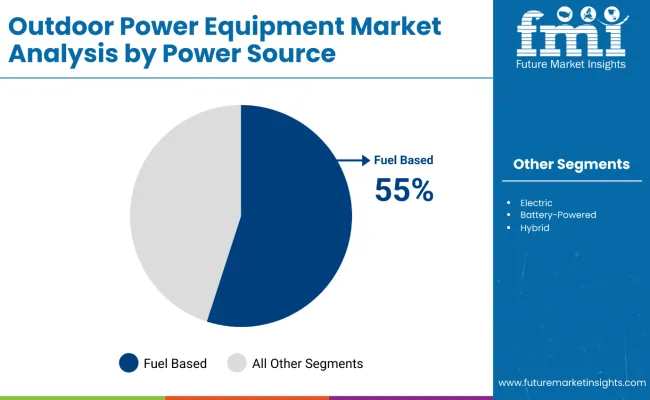
Gasoline-powered models retain preference in high-power applications

Outdoor Power Equipment Market By Power Source

Fuel-based outdoor equipment accounted for 55% of total sales in 2025, maintaining its lead due to high output suitability in intensive tasks. Despite regulatory pushback over emissions, gasoline-powered units remain widely used in commercial mowing, snow removal, and tilling due to their torque delivery and runtime flexibility. A CAGR of 3.1% is forecast for this segment through 2035, with demand being sustained in emerging economies and rural areas. However, urban restrictions and rising fuel costs are prompting a gradual shift toward battery-powered models, particularly in mid-size applications.
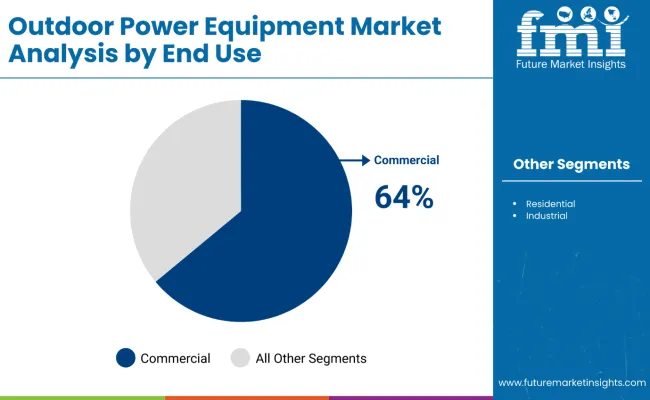
Commercial use continues to drive majority of outdoor equipment sales

Outdoor Power Equipment Market By End Use

Commercial applications represented 64% of the overall outdoor equipment market in 2025 and are anticipated to expand at a CAGR of 3.6% over the forecast period. Landscaping contractors, municipalities, facility managers, and infrastructure developers are the primary consumers in this segment. Procurement cycles are typically driven by equipment durability, service support, and low total cost of ownership.

Increasing focus on labor efficiency, noise control, and sustainability is influencing equipment selection, particularly in high-use environments like parks, airports, and educational campuses. Electrification and automation are gradually being introduced to enhance performance metrics in this user category.

Key Trends Shaping the Market?

The outdoor power equipment market is witnessing significant transformation due to the convergence of environmental mandates, electrification trends, and digital integration. The shift from gas-powered to electric and battery-operated tools is altering both the consumer and commercial landscaping segments. However, price sensitivity, performance expectations, and runtime limitations continue to shape buying behavior across regions.

Battery Innovation Accelerates Market Penetration

The evolution of battery platforms is acting as a key enabler for the transition from gasoline to electric-powered outdoor equipment. Advancements in lithium-ion battery density, thermal management, and fast-charging capabilities are supporting broader deployment across lawnmowers, hedge trimmers, and leaf blowers. Manufacturers are increasingly offering modular battery packs that are compatible across tool ecosystems, reducing operational complexity and boosting convenience for residential users.

Commercial-grade battery-powered equipment is also gaining traction as runtimes improve beyond 60 minutes per charge, and dual-battery configurations become common. Additionally, energy efficiency gains and regenerative braking technologies are emerging in premium robotic lawnmowers and autonomous garden tools. These battery innovations are accelerating replacement cycles in mature markets and opening up opportunities in urban regions where fuel use is restricted.

Emission Regulations Drive Shift to Low-Noise, Electric Equipment

Stringent emission and noise regulations are compelling both municipalities and private property owners to transition toward electric outdoor equipment. In the United States, states like California have announced bans on gas-powered landscaping tools in public areas, while the EU continues to enforce limits on carbon emissions and decibel thresholds for equipment used in dense residential and urban zones.

Contractors and landscaping service providers are under pressure to adopt cleaner tools that align with environmental regulations and community noise ordinances. The demand for battery-operated and hybrid tools is growing in city parks, golf courses, school campuses, and healthcare facility grounds where quiet, emission-free operation is prioritized. This transition is being supported by incentive programs that subsidize equipment upgrades and offer tax relief for adopting electric models.

Cost Parity and Runtime Constraints Continue to Impact Adoption

Despite rapid innovation, electric outdoor equipment still faces challenges related to cost competitiveness and uninterrupted operational performance. Battery-powered models generally carry a higher initial purchase price than gasoline variants, particularly in high-horsepower tools such as commercial mowers and snow blowers. For large property owners, municipalities, and commercial users, the cost of upgrading entire fleets remains a barrier, especially when factoring in charging infrastructure and battery replacement cycles.

Runtime limitations are also a constraint in high-duty-cycle operations like golf course maintenance or commercial landscaping, where continuous operation is needed for several hours a day. While dual-battery solutions and fast-charging stations are addressing this issue, the limitations in power delivery and torque for heavy-duty applications remain a restraint to full market conversion. As a result, a hybrid procurement model mixing electric for light-duty and gasoline for heavy-duty continues to prevail in many organizations.

Integration of Smart Features Enhances Product Appeal

The incorporation of IoT and smart connectivity into outdoor power equipment is emerging as a key differentiator in both consumer and professional segments. Equipment with app-based control, remote diagnostics, performance tracking, and anti-theft systems is being increasingly favored by users looking for better control, efficiency, and asset protection. Fleet managers in commercial landscaping businesses are using telemetry-enabled tools to monitor usage hours, battery status, and maintenance schedules in real time.

For residential users, robotic mowers with intelligent scheduling, boundary mapping, and weather-responsive features are growing in popularity, particularly in Europe and North America. These smart capabilities are enabling automation of routine landscaping tasks, reducing manual labor and improving outcomes.

Europe Market Value Split by Country

Countries Share (2025)
Germany 19%
UK 16%
Russia 15%
France 9%
Italy 9%
Spain 8%
BENELUX 4%
Rest of Europe 20%
Countries Share (2035)
Germany 18%
UK 15%
Russia 13%
France 10%
Italy 10%
Spain 9%
BENELUX 5%
Rest of Europe 20%

The outdoor power equipment market in Europe is forecast to grow from USD 9.1 billion in 2025 to USD 11.6 billion by 2035, registering a CAGR of 2.6%. Germany continues to lead the region, although its market share is projected to decline slightly from 19% to 18% as growth stabilizes in its mature consumer base. The UK follows with a share adjustment from 16% to 15%, influenced by a more competitive aftermarket and increased imports.

Russia’s share is expected to drop from 15% to 13%, reflecting slower economic activity and constrained investment in residential landscaping. France and Italy are projected to gain ground, each increasing their share by 1%, supported by strong consumer adoption of electric lawn and garden tools and local manufacturing initiatives. Spain and BENELUX are also set for modest gains.
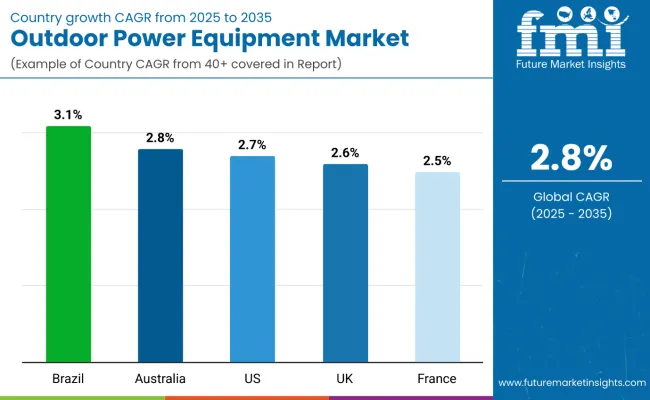
Key Countries Growth Outlook

Outdoor Power Equipment Market By Country

Brazil shows the fastest growth among key markets

Brazil is projected to grow at a CAGR of 3.1%, the highest among the five countries shown. Residential gardening is expanding due to increased housing activity in urban peripheries. Public landscaping initiatives in medium-sized cities are also supporting equipment deployment in parks and municipal gardens.

  • Backyard automation and smart irrigation systems improving product appeal
  • Import substitution and assembly of low-cost mower units boosting access
  • Expansion in government-maintained green zones pushing ride-on mower demand
  • Retail hardware chains expanding SKU portfolios across cities

Australia registers stable growth in semi-urban segments

Australia is expected to grow at 2.8% CAGR, supported by strong demand from hobby farmers, semi-urban homeowners, and aged care landscaping contractors. Electric and cordless tools are gaining traction as noise ordinances tighten in residential suburbs.
  • Lithium-ion powered equipment gaining traction due to noise regulations
  • Rental sector growth in lawn and tree maintenance services pushing commercial volumes
  • Government-supported greening programs adding to municipal-level equipment uptake
  • Declining use of petrol-driven machines creating opportunity for electric replacements

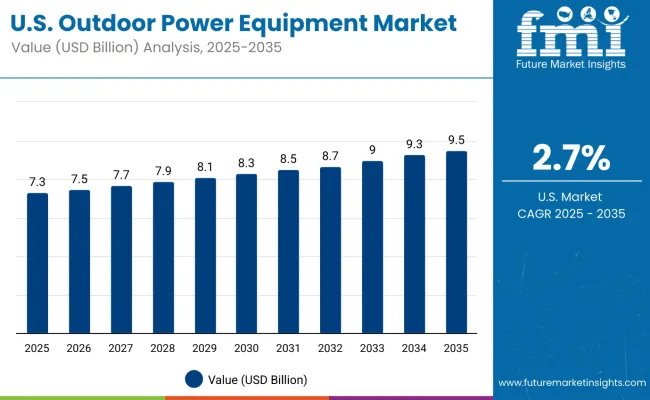
United States to sustain demand across homeowner and professional categories

Outdoor Power Equipment Market Usa

The USA outdoor power equipment market is projected to grow at a CAGR of 2.7%, with steady purchases from homeowners and service professionals. Robotic mowers, smart irrigation controllers, and cordless chainsaws are showing increased adoption.

  • Premium electric models being adopted in high-income suburban households
  • Rebates and incentives for eco-friendly lawn equipment supporting adoption
  • Expanding home improvement trends driving mower and trimmer purchases
  • Replacement cycles shortening for hedge trimmers, blowers, and edgers

United Kingdom sees consistent urban and public sector usage

The UK is anticipated to grow at 2.6% CAGR, with a notable focus on emission-compliant equipment for use in city parks and recreational areas. There is growing interest in compact, quiet electric tools among residential users with limited space.

  • Noise and emission policies driving shift toward battery-operated units
  • Preference for foldable and space-saving models among city dwellers
  • Landscaping contractors investing in efficient cordless brush cutters
  • Public green maintenance departments upgrading fleets under net-zero targets

France maintains steady momentum across regions

France is forecast to register a 2.5% CAGR, with demand sustained by both public sector procurement and consumer purchases in suburban communes. Government focus on green urban areas and rising preference for robotic lawn mowers are influencing trends.

  • High usage of mowers and trimmers in semi-rural communes and suburban homes
  • Innovation in robotic lawn mowers creating new consumer interest
  • Distribution growth in agricultural co-operatives and garden centers
  • Energy-efficient tool variants favored under national energy transition plans

Power source distribution in Japan points to the continued reliance on gasoline-powered outdoor tools, although battery-powered alternatives are gaining ground.

Gasoline-based equipment is estimated to represent 40% of total sales in 2025, sustained by its dominance in high-torque lawn mowers, trimmers, and blowers. Battery-powered tools are expected to account for 30%, supported by growing urban demand, emissions regulations, and convenience-led preferences. Electric (corded) tools maintain a 25% share due to lower operational costs and niche usage in fixed landscaping operations. Hybrid power systems, though limited, contribute around 5%, primarily in premium or large-area applications.

  • Fuel-based tools remain dominant in large gardens and semi-professional use cases
  • Battery tools rising due to lightweight formats and noise reduction
  • Electric corded units cater to compact space applications
  • Hybrid technology adoption is observed in parks and municipal upkeep sectors

In South Korea, commercial buyers continue to lead the adoption of outdoor power equipment, accounting for 45% of overall demand.

Landscaping contractors, facility managers, and municipal service providers are investing in performance tools with reliability and extended runtimes. The residential segment is close behind with a 40% share, driven by expanding suburban housing and DIY culture. Industrial users hold a 15% share, with applications spanning construction site cleanup, facility maintenance, and heavy brush clearance.
  • Commercial demand driven by landscape service growth and real estate maintenance
  • Residential users preferring battery tools for convenience and safety
  • Industrial users seeking durable equipment with multifunctional attachments
  • E-commerce and offline dealer networks expanding in residential segment

Competition Outlook

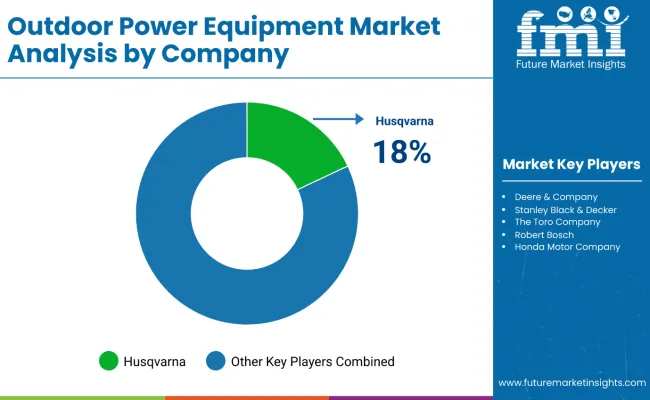
Outdoor Power Equipment Market By Company

Competition in the outdoor power equipment market is intensifying as players expand portfolios with high-performance and electric solutions. New product launches are addressing the needs of professional landscapers and commercial users, offering enhanced power, durability, and user comfort. The integration of advanced battery systems, smart fleet management, and zero-emission capabilities is gaining traction, reflecting the shift toward sustainable operations.

Companies are investing in innovation to differentiate offerings across chainsaws, blowers, trimmers, and commercial-grade mowers. The market is being shaped by the combination of performance-driven upgrades, electrification trends, and technology-enabled fleet solutions, creating a highly competitive landscape focused on efficiency and sustainability.

  • In July 2024, DEWALT expanded its lineup of outdoor power equipment with new high-performance tools, including a 60V MAX* Chainsaw and a 60V MAX* Blower. These additions are designed to meet the heavy-duty landscaping demands of professional users, enhancing the brand’s presence in the commercial segment.
  • In August 2024, ECHO launched nine new outdoor power equipment products during its annual Power-On-Athon event. The lineup includes new trimmers, blowers, and chainsaws, targeting both residential and professional landscapers, with a focus on performance, durability, and user comfort.
  • In March 2025, Greenworks Commercial unveiled the 2025 OPTIMUS series, a fully electric line of commercial-grade outdoor equipment. The launch includes zero-turn mowers and utility vehicles, integrating advanced battery systems and smart fleet management technology to support zero-emission landscaping operations.

Companies

  • Husqvarna
  • Deere & Company
  • Stanley Black & Decker
  • The Toro Company
  • Robert Bosch
  • Honda Motor Company
  • Makita Corporation
  • Techtronic Industries Co. Ltd.

Scope of the Report

Item Value
Quantitative Units USD 38.4 Billion (2025)
Equipment Type Lawn Mowers, Saws (Chainsaws), Trimmers and Edgers , Blowers, Tillers and Cultivators, Snow Throwers, Others
Power Source Fuel Based (Gasoline-powered), Electric, Battery-powered, Hybrid
End Use Commercial, Residential, Industrial
Regions Covered North America, Europe, East Asia, South Asia & Pacific, Latin America, Middle East & Africa
Countries Covered United States, Germany, United Kingdom, Japan, China
Key Companies Profiled Husqvarna Group, Honda Motor Co. Ltd., STIHL Group, Briggs & Stratton LLC, Deere & Company, Robert Bosch GmbH, MTD Products Inc., Stanley Black & Decker Inc., The Toro Company, Makita Corporation

Key Segments

By Equipment Types:

  • Lawn Mowers
  • Saws (Chainsaws)
  • Trimmers and edgers
  • Blowers
  • Tillers and Cultivators
  • Snow Throwers
  • Others

By Power Source Types:

  • Fuel Based (Gasoline-powered)
  • Electric
  • Battery-powered
  • Hybrid

By End User Types:

  • Commercial
  • Residential
  • Industrial

By Enterprise Size:

  • Large Enterprises
  • Small & Medium Sized Enterprises (SMEs)

By Region:

  • North America
  • Latin America
  • Western Europe
  • Eastern Europe
  • East Asia
  • South Asia & Pacific
  • Middle East & Africa

Table of Content

  1. Executive Summary
    • Global Market Outlook
    • Demand-side Trends
    • Supply-side Trends
    • Technology Roadmap Analysis
    • Analysis and Recommendations
  2. Market Overview
    • Market Coverage / Taxonomy
    • Market Definition / Scope / Limitations
  3. Market Background
    • Market Dynamics
      • Drivers
      • Restraints
      • Opportunity
      • Trends
    • Scenario Forecast
      • Demand in Optimistic Scenario
      • Demand in Likely Scenario
      • Demand in Conservative Scenario
    • Key Success Factors
    • Industry Developments
    • Supply Chain Analysis
      • Sourcing and Procurement
        • Raw Material / Component Suppliers
        • Technology Providers
      • Product Manufacturers
      • Channel Partners
      • End Users / Customers
    • Market Assessment Factors
      • Macro-economic Factors
      • Forecast Factors
  4. 3.10. Parent Market Outlook
  5. Global Market Analysis 2020 to 2024 and Forecast, 2025 to 2035
    • Historical Market Size Value (USD Billion) Analysis, 2020 to 2024
    • Current and Future Market Size Value (USD Billion) Projections, 2025 to 2035
      • Y-o-Y Growth Trend Analysis
      • Absolute $ Opportunity Analysis
  6. Global Market Pricing Analysis 2020 to 2024 and Forecast 2025 to 2035
  7. Global Market Analysis 2020 to 2024 and Forecast 2025 to 2035, By Equipment Types
    • Introduction / Key Findings
    • Historical Market Size Value (USD Billion) Analysis By Equipment Types , 2020 to 2024
    • Current and Future Market Size Value (USD Billion) Analysis and Forecast By Equipment Types , 2025 to 2035
      • Lawn Mowers
      • Saws (Chainsaws)
      • Trimmers and edgers
      • Blowers
      • Tillers and Cultivators
      • Snow Throwers
      • Others
    • Y-o-Y Growth Trend Analysis By Equipment Types , 2020 to 2024
    • Absolute $ Opportunity Analysis By Equipment Types , 2025 to 2035
  8. Global Market Analysis 2020 to 2024 and Forecast 2025 to 2035, By Power Source Types
    • Introduction / Key Findings
    • Historical Market Size Value (USD Billion) Analysis By Power Source Types , 2020 to 2024
    • Current and Future Market Size Value (USD Billion) Analysis and Forecast By Power Source Types , 2025 to 2035
      • Fuel Based (Gasoline-powered)
      • Electric
      • Battery-powered
      • Hybrid
    • Y-o-Y Growth Trend Analysis By Power Source Types , 2020 to 2024
    • Absolute $ Opportunity Analysis By Power Source Types , 2025 to 2035
  9. Global Market Analysis 2020 to 2024 and Forecast 2025 to 2035, By End User Types
    • Introduction / Key Findings
    • Historical Market Size Value (USD Billion) Analysis By End User Types , 2020 to 2024
    • Current and Future Market Size Value (USD Billion) Analysis and Forecast By End User Types , 2025 to 2035
      • Commercial
      • Residential
      • Industrial
    • Y-o-Y Growth Trend Analysis By End User Types , 2020 to 2024
    • Absolute $ Opportunity Analysis By End User Types , 2025 to 2035
  10. Global Market Analysis 2020 to 2024 and Forecast 2025 to 2035, By Enterprise Size
    • Introduction / Key Findings
    • Historical Market Size Value (USD Billion) Analysis By Enterprise Size, 2020 to 2024
    • Current and Future Market Size Value (USD Billion) Analysis and Forecast By Enterprise Size, 2025 to 2035
      • Large Enterprises
      • Small & Medium Sized Enterprises (SMEs)
    • Y-o-Y Growth Trend Analysis By Enterprise Size, 2020 to 2024
    • Absolute $ Opportunity Analysis By Enterprise Size, 2025 to 2035
  11. Global Market Analysis 2020 to 2024 and Forecast 2025 to 2035, By Region
    • Introduction
    • Historical Market Size Value (USD Billion) Analysis By Region, 2020 to 2024
    • Current Market Size Value (USD Billion) Analysis and Forecast By Region, 2025 to 2035
      • North America
      • Latin America
      • Western Europe
      • Eastern Europe
      • East Asia
      • South Asia & Pacific
      • Middle East & Africa
    • Market Attractiveness Analysis By Region
  12. North America Market Analysis 2020 to 2024 and Forecast 2025 to 2035, By Country
    • Historical Market Size Value (USD Billion) Trend Analysis By Market Taxonomy, 2020 to 2024
    • Market Size Value (USD Billion) Forecast By Market Taxonomy, 2025 to 2035
      • By Country
        • USA
        • Canada
        • Mexico
      • By Equipment Types
      • By Power Source Types
      • By End User Types
      • By Enterprise Size
    • Market Attractiveness Analysis
      • By Country
      • By Equipment Types
      • By Power Source Types
      • By End User Types
      • By Enterprise Size
    • Key Takeaways
  13. Latin America Market Analysis 2020 to 2024 and Forecast 2025 to 2035, By Country
    • Historical Market Size Value (USD Billion) Trend Analysis By Market Taxonomy, 2020 to 2024
    • Market Size Value (USD Billion) Forecast By Market Taxonomy, 2025 to 2035
      • By Country
        • Brazil
        • Argentina
        • Rest of Latin America
      • By Equipment Types
      • By Power Source Types
      • By End User Types
      • By Enterprise Size
    • Market Attractiveness Analysis
      • By Country
      • By Equipment Types
      • By Power Source Types
      • By End User Types
      • By Enterprise Size
    • Key Takeaways
  14. Western Europe Market Analysis 2020 to 2024 and Forecast 2025 to 2035, By Country
    • Historical Market Size Value (USD Billion) Trend Analysis By Market Taxonomy, 2020 to 2024
    • Market Size Value (USD Billion) Forecast By Market Taxonomy, 2025 to 2035
      • By Country
        • Germany
        • Italy
        • France
        • UK
        • Spain
        • BENELUX
        • Nordics
        • Rest of W. Europe
      • By Equipment Types
      • By Power Source Types
      • By End User Types
      • By Enterprise Size
    • Market Attractiveness Analysis
      • By Country
      • By Equipment Types
      • By Power Source Types
      • By End User Types
      • By Enterprise Size
    • Key Takeaways
  15. Eastern Europe Market Analysis 2020 to 2024 and Forecast 2025 to 2035, By Country
    • Historical Market Size Value (USD Billion) Trend Analysis By Market Taxonomy, 2020 to 2024
    • Market Size Value (USD Billion) Forecast By Market Taxonomy, 2025 to 2035
      • By Country
        • Hungary
        • Poland
        • Russia
        • Balkan & Baltics
        • Rest of E.Europe
      • By Equipment Types
      • By Power Source Types
      • By End User Types
      • By Enterprise Size
    • Market Attractiveness Analysis
      • By Country
      • By Equipment Types
      • By Power Source Types
      • By End User Types
      • By Enterprise Size
    • Key Takeaways
  16. East Asia Market Analysis 2020 to 2024 and Forecast 2025 to 2035, By Country
    • Historical Market Size Value (USD Billion) Trend Analysis By Market Taxonomy, 2020 to 2024
    • Market Size Value (USD Billion) Forecast By Market Taxonomy, 2025 to 2035
      • By Country
        • China
        • Japan
        • South Korea
      • By Equipment Types
      • By Power Source Types
      • By End User Types
      • By Enterprise Size
    • Market Attractiveness Analysis
      • By Country
      • By Equipment Types
      • By Power Source Types
      • By End User Types
      • By Enterprise Size
    • Key Takeaways
  17. South Asia & Pacific Market Analysis 2020 to 2024 and Forecast 2025 to 2035, By Country
    • Historical Market Size Value (USD Billion) Trend Analysis By Market Taxonomy, 2020 to 2024
    • Market Size Value (USD Billion) Forecast By Market Taxonomy, 2025 to 2035
      • By Country
        • India
        • ASEAN
        • Australia & New Zealand
      • By Equipment Types
      • By Power Source Types
      • By End User Types
      • By Enterprise Size
    • Market Attractiveness Analysis
      • By Country
      • By Equipment Types
      • By Power Source Types
      • By End User Types
      • By Enterprise Size
    • Key Takeaways
  18. Middle East & Africa Market Analysis 2020 to 2024 and Forecast 2025 to 2035, By Country
    • Historical Market Size Value (USD Billion) Trend Analysis By Market Taxonomy, 2020 to 2024
    • Market Size Value (USD Billion) Forecast By Market Taxonomy, 2025 to 2035
      • By Country
        • GCC Countries
        • Turkiye
        • Northern Africa
        • South Africa
        • Rest of MEA
      • By Equipment Types
      • By Power Source Types
      • By End User Types
      • By Enterprise Size
    • Market Attractiveness Analysis
      • By Country
      • By Equipment Types
      • By Power Source Types
      • By End User Types
      • By Enterprise Size
    • Key Takeaways
  19. Key Countries Market Analysis
    • USA
      • Pricing Analysis
      • Market Share Analysis, 2024
        • By Equipment Types
        • By Power Source Types
        • By End User Types
        • By Enterprise Size
    • Canada
      • Pricing Analysis
      • Market Share Analysis, 2024
        • By Equipment Types
        • By Power Source Types
        • By End User Types
        • By Enterprise Size
    • Mexico
      • Pricing Analysis
      • Market Share Analysis, 2024
        • By Equipment Types
        • By Power Source Types
        • By End User Types
        • By Enterprise Size
    • Brazil
      • Pricing Analysis
      • Market Share Analysis, 2024
        • By Equipment Types
        • By Power Source Types
        • By End User Types
        • By Enterprise Size
    • Argentina
      • Pricing Analysis
      • Market Share Analysis, 2024
        • By Equipment Types
        • By Power Source Types
        • By End User Types
        • By Enterprise Size
    • Germany
      • Pricing Analysis
      • Market Share Analysis, 2024
        • By Equipment Types
        • By Power Source Types
        • By End User Types
        • By Enterprise Size
    • Italy
      • Pricing Analysis
      • Market Share Analysis, 2024
        • By Equipment Types
        • By Power Source Types
        • By End User Types
        • By Enterprise Size
    • France
      • Pricing Analysis
      • Market Share Analysis, 2024
        • By Equipment Types
        • By Power Source Types
        • By End User Types
        • By Enterprise Size
    • UK
      • Pricing Analysis
      • Market Share Analysis, 2024
        • By Equipment Types
        • By Power Source Types
        • By End User Types
        • By Enterprise Size
    • Spain
      • Pricing Analysis
      • Market Share Analysis, 2024
        • By Equipment Types
        • By Power Source Types
        • By End User Types
        • By Enterprise Size
    • BENELUX
      • Pricing Analysis
      • Market Share Analysis, 2024
        • By Equipment Types
        • By Power Source Types
        • By End User Types
        • By Enterprise Size
    • Nordics
      • Pricing Analysis
      • Market Share Analysis, 2024
        • By Equipment Types
        • By Power Source Types
        • By End User Types
        • By Enterprise Size
    • Russia
      • Pricing Analysis
      • Market Share Analysis, 2024
        • By Equipment Types
        • By Power Source Types
        • By End User Types
        • By Enterprise Size
    • Hungary
      • Pricing Analysis
      • Market Share Analysis, 2024
        • By Equipment Types
        • By Power Source Types
        • By End User Types
        • By Enterprise Size
    • Poland
      • Pricing Analysis
      • Market Share Analysis, 2024
        • By Equipment Types
        • By Power Source Types
        • By End User Types
        • By Enterprise Size
    • Balkan & Baltics
      • Pricing Analysis
      • Market Share Analysis, 2024
        • By Equipment Types
        • By Power Source Types
        • By End User Types
        • By Enterprise Size
    • China
      • Pricing Analysis
      • Market Share Analysis, 2024
        • By Equipment Types
        • By Power Source Types
        • By End User Types
        • By Enterprise Size
    • Japan
      • Pricing Analysis
      • Market Share Analysis, 2024
        • By Equipment Types
        • By Power Source Types
        • By End User Types
        • By Enterprise Size
    • South Korea
      • Pricing Analysis
      • Market Share Analysis, 2024
        • By Equipment Types
        • By Power Source Types
        • By End User Types
        • By Enterprise Size
    • India
      • Pricing Analysis
      • Market Share Analysis, 2024
        • By Equipment Types
        • By Power Source Types
        • By End User Types
        • By Enterprise Size
    • ASEAN
      • Pricing Analysis
      • Market Share Analysis, 2024
        • By Equipment Types
        • By Power Source Types
        • By End User Types
        • By Enterprise Size
    • Australia & New Zealand
      • Pricing Analysis
      • Market Share Analysis, 2024
        • By Equipment Types
        • By Power Source Types
        • By End User Types
        • By Enterprise Size
    • GCC Countries
      • Pricing Analysis
      • Market Share Analysis, 2024
        • By Equipment Types
        • By Power Source Types
        • By End User Types
        • By Enterprise Size
    • Turkiye
      • Pricing Analysis
      • Market Share Analysis, 2024
        • By Equipment Types
        • By Power Source Types
        • By End User Types
        • By Enterprise Size
    • Northern Africa
      • Pricing Analysis
      • Market Share Analysis, 2024
        • By Equipment Types
        • By Power Source Types
        • By End User Types
        • By Enterprise Size
    • South Africa
      • Pricing Analysis
      • Market Share Analysis, 2024
        • By Equipment Types
        • By Power Source Types
        • By End User Types
        • By Enterprise Size
  20. Market Structure Analysis
    • Competition Dashboard
    • Competition Benchmarking
    • Market Share Analysis of Top Players
      • By Regional
      • By Equipment Types
      • By Power Source Types
      • By End User Types
      • By Enterprise Size
  21. Competition Analysis
    • Competition Deep Dive
      • Husqvarna
        • Overview
        • Product Portfolio
        • Profitability by Market Segments
        • Sales Footprint
        • Strategy Overview
      • Deere & Company
        • Overview
        • Product Portfolio
        • Profitability by Market Segments
        • Sales Footprint
        • Strategy Overview
      • Stanley Black & Decker
        • Overview
        • Product Portfolio
        • Profitability by Market Segments
        • Sales Footprint
        • Strategy Overview
      • The Toro Company
        • Overview
        • Product Portfolio
        • Profitability by Market Segments
        • Sales Footprint
        • Strategy Overview
      • Robert Bosch
        • Overview
        • Product Portfolio
        • Profitability by Market Segments
        • Sales Footprint
        • Strategy Overview
      • Honda Motor Company
        • Overview
        • Product Portfolio
        • Profitability by Market Segments
        • Sales Footprint
        • Strategy Overview
      • Makita Corporation
        • Overview
        • Product Portfolio
        • Profitability by Market Segments
        • Sales Footprint
        • Strategy Overview
      • Techtronic Industries Co. Ltd.
        • Overview
        • Product Portfolio
        • Profitability by Market Segments
        • Sales Footprint
        • Strategy Overview
  22. Assumptions & Acronyms Used
  23. Research Methodology

List of Tables

  • Table 1: Global Market Value (USD Billion) Forecast by Region, 2020-2035
  • Table 2: Global Market Value (USD Billion) Forecast by Equipment Types , 2020-2035
  • Table 3: Global Market Value (USD Billion) Forecast by Power Source Types , 2020-2035
  • Table 4: Global Market Value (USD Billion) Forecast by End User Types , 2020-2035
  • Table 5: Global Market Value (USD Billion) Forecast by Enterprise Size, 2020-2035
  • Table 6: North America Market Value (USD Billion) Forecast by Country, 2020-2035
  • Table 7: North America Market Value (USD Billion) Forecast by Equipment Types , 2020-2035
  • Table 8: North America Market Value (USD Billion) Forecast by Power Source Types , 2020-2035
  • Table 9: North America Market Value (USD Billion) Forecast by End User Types , 2020-2035
  • Table 10: North America Market Value (USD Billion) Forecast by Enterprise Size, 2020-2035
  • Table 11: Latin America Market Value (USD Billion) Forecast by Country, 2020-2035
  • Table 12: Latin America Market Value (USD Billion) Forecast by Equipment Types , 2020-2035
  • Table 13: Latin America Market Value (USD Billion) Forecast by Power Source Types , 2020-2035
  • Table 14: Latin America Market Value (USD Billion) Forecast by End User Types , 2020-2035
  • Table 15: Latin America Market Value (USD Billion) Forecast by Enterprise Size, 2020-2035
  • Table 16: Western Europe Market Value (USD Billion) Forecast by Country, 2020-2035
  • Table 17: Western Europe Market Value (USD Billion) Forecast by Equipment Types , 2020-2035
  • Table 18: Western Europe Market Value (USD Billion) Forecast by Power Source Types , 2020-2035
  • Table 19: Western Europe Market Value (USD Billion) Forecast by End User Types , 2020-2035
  • Table 20: Western Europe Market Value (USD Billion) Forecast by Enterprise Size, 2020-2035
  • Table 21: Eastern Europe Market Value (USD Billion) Forecast by Country, 2020-2035
  • Table 22: Eastern Europe Market Value (USD Billion) Forecast by Equipment Types , 2020-2035
  • Table 23: Eastern Europe Market Value (USD Billion) Forecast by Power Source Types , 2020-2035
  • Table 24: Eastern Europe Market Value (USD Billion) Forecast by End User Types , 2020-2035
  • Table 25: Eastern Europe Market Value (USD Billion) Forecast by Enterprise Size, 2020-2035
  • Table 26: East Asia Market Value (USD Billion) Forecast by Country, 2020-2035
  • Table 27: East Asia Market Value (USD Billion) Forecast by Equipment Types , 2020-2035
  • Table 28: East Asia Market Value (USD Billion) Forecast by Power Source Types , 2020-2035
  • Table 29: East Asia Market Value (USD Billion) Forecast by End User Types , 2020-2035
  • Table 30: East Asia Market Value (USD Billion) Forecast by Enterprise Size, 2020-2035
  • Table 31: South Asia & Pacific Market Value (USD Billion) Forecast by Country, 2020-2035
  • Table 32: South Asia & Pacific Market Value (USD Billion) Forecast by Equipment Types , 2020-2035
  • Table 33: South Asia & Pacific Market Value (USD Billion) Forecast by Power Source Types , 2020-2035
  • Table 34: South Asia & Pacific Market Value (USD Billion) Forecast by End User Types , 2020-2035
  • Table 35: South Asia & Pacific Market Value (USD Billion) Forecast by Enterprise Size, 2020-2035
  • Table 36: Middle East & Africa Market Value (USD Billion) Forecast by Country, 2020-2035
  • Table 37: Middle East & Africa Market Value (USD Billion) Forecast by Equipment Types , 2020-2035
  • Table 38: Middle East & Africa Market Value (USD Billion) Forecast by Power Source Types , 2020-2035
  • Table 39: Middle East & Africa Market Value (USD Billion) Forecast by End User Types , 2020-2035
  • Table 40: Middle East & Africa Market Value (USD Billion) Forecast by Enterprise Size, 2020-2035

List of Figures

  • Figure 1: Global Market Pricing Analysis
  • Figure 2: Global Market Value (USD Billion) Forecast 2020-2035
  • Figure 3: Global Market Value Share and BPS Analysis by Equipment Types , 2025 and 2035
  • Figure 4: Global Market Y-o-Y Growth Comparison by Equipment Types , 2025-2035
  • Figure 5: Global Market Attractiveness Analysis by Equipment Types
  • Figure 6: Global Market Value Share and BPS Analysis by Power Source Types , 2025 and 2035
  • Figure 7: Global Market Y-o-Y Growth Comparison by Power Source Types , 2025-2035
  • Figure 8: Global Market Attractiveness Analysis by Power Source Types
  • Figure 9: Global Market Value Share and BPS Analysis by End User Types , 2025 and 2035
  • Figure 10: Global Market Y-o-Y Growth Comparison by End User Types , 2025-2035
  • Figure 11: Global Market Attractiveness Analysis by End User Types
  • Figure 12: Global Market Value Share and BPS Analysis by Enterprise Size, 2025 and 2035
  • Figure 13: Global Market Y-o-Y Growth Comparison by Enterprise Size, 2025-2035
  • Figure 14: Global Market Attractiveness Analysis by Enterprise Size
  • Figure 15: Global Market Value (USD Billion) Share and BPS Analysis by Region, 2025 and 2035
  • Figure 16: Global Market Y-o-Y Growth Comparison by Region, 2025-2035
  • Figure 17: Global Market Attractiveness Analysis by Region
  • Figure 18: North America Market Incremental $ Opportunity, 2025-2035
  • Figure 19: Latin America Market Incremental $ Opportunity, 2025-2035
  • Figure 20: Western Europe Market Incremental $ Opportunity, 2025-2035
  • Figure 21: Eastern Europe Market Incremental $ Opportunity, 2025-2035
  • Figure 22: East Asia Market Incremental $ Opportunity, 2025-2035
  • Figure 23: South Asia & Pacific Market Incremental $ Opportunity, 2025-2035
  • Figure 24: Middle East & Africa Market Incremental $ Opportunity, 2025-2035
  • Figure 25: North America Market Value Share and BPS Analysis by Country, 2025 and 2035
  • Figure 26: North America Market Value Share and BPS Analysis by Equipment Types , 2025 and 2035
  • Figure 27: North America Market Y-o-Y Growth Comparison by Equipment Types , 2025-2035
  • Figure 28: North America Market Attractiveness Analysis by Equipment Types
  • Figure 29: North America Market Value Share and BPS Analysis by Power Source Types , 2025 and 2035
  • Figure 30: North America Market Y-o-Y Growth Comparison by Power Source Types , 2025-2035
  • Figure 31: North America Market Attractiveness Analysis by Power Source Types
  • Figure 32: North America Market Value Share and BPS Analysis by End User Types , 2025 and 2035
  • Figure 33: North America Market Y-o-Y Growth Comparison by End User Types , 2025-2035
  • Figure 34: North America Market Attractiveness Analysis by End User Types
  • Figure 35: North America Market Value Share and BPS Analysis by Enterprise Size, 2025 and 2035
  • Figure 36: North America Market Y-o-Y Growth Comparison by Enterprise Size, 2025-2035
  • Figure 37: North America Market Attractiveness Analysis by Enterprise Size
  • Figure 38: Latin America Market Value Share and BPS Analysis by Country, 2025 and 2035
  • Figure 39: Latin America Market Value Share and BPS Analysis by Equipment Types , 2025 and 2035
  • Figure 40: Latin America Market Y-o-Y Growth Comparison by Equipment Types , 2025-2035
  • Figure 41: Latin America Market Attractiveness Analysis by Equipment Types
  • Figure 42: Latin America Market Value Share and BPS Analysis by Power Source Types , 2025 and 2035
  • Figure 43: Latin America Market Y-o-Y Growth Comparison by Power Source Types , 2025-2035
  • Figure 44: Latin America Market Attractiveness Analysis by Power Source Types
  • Figure 45: Latin America Market Value Share and BPS Analysis by End User Types , 2025 and 2035
  • Figure 46: Latin America Market Y-o-Y Growth Comparison by End User Types , 2025-2035
  • Figure 47: Latin America Market Attractiveness Analysis by End User Types
  • Figure 48: Latin America Market Value Share and BPS Analysis by Enterprise Size, 2025 and 2035
  • Figure 49: Latin America Market Y-o-Y Growth Comparison by Enterprise Size, 2025-2035
  • Figure 50: Latin America Market Attractiveness Analysis by Enterprise Size
  • Figure 51: Western Europe Market Value Share and BPS Analysis by Country, 2025 and 2035
  • Figure 52: Western Europe Market Value Share and BPS Analysis by Equipment Types , 2025 and 2035
  • Figure 53: Western Europe Market Y-o-Y Growth Comparison by Equipment Types , 2025-2035
  • Figure 54: Western Europe Market Attractiveness Analysis by Equipment Types
  • Figure 55: Western Europe Market Value Share and BPS Analysis by Power Source Types , 2025 and 2035
  • Figure 56: Western Europe Market Y-o-Y Growth Comparison by Power Source Types , 2025-2035
  • Figure 57: Western Europe Market Attractiveness Analysis by Power Source Types
  • Figure 58: Western Europe Market Value Share and BPS Analysis by End User Types , 2025 and 2035
  • Figure 59: Western Europe Market Y-o-Y Growth Comparison by End User Types , 2025-2035
  • Figure 60: Western Europe Market Attractiveness Analysis by End User Types
  • Figure 61: Western Europe Market Value Share and BPS Analysis by Enterprise Size, 2025 and 2035
  • Figure 62: Western Europe Market Y-o-Y Growth Comparison by Enterprise Size, 2025-2035
  • Figure 63: Western Europe Market Attractiveness Analysis by Enterprise Size
  • Figure 64: Eastern Europe Market Value Share and BPS Analysis by Country, 2025 and 2035
  • Figure 65: Eastern Europe Market Value Share and BPS Analysis by Equipment Types , 2025 and 2035
  • Figure 66: Eastern Europe Market Y-o-Y Growth Comparison by Equipment Types , 2025-2035
  • Figure 67: Eastern Europe Market Attractiveness Analysis by Equipment Types
  • Figure 68: Eastern Europe Market Value Share and BPS Analysis by Power Source Types , 2025 and 2035
  • Figure 69: Eastern Europe Market Y-o-Y Growth Comparison by Power Source Types , 2025-2035
  • Figure 70: Eastern Europe Market Attractiveness Analysis by Power Source Types
  • Figure 71: Eastern Europe Market Value Share and BPS Analysis by End User Types , 2025 and 2035
  • Figure 72: Eastern Europe Market Y-o-Y Growth Comparison by End User Types , 2025-2035
  • Figure 73: Eastern Europe Market Attractiveness Analysis by End User Types
  • Figure 74: Eastern Europe Market Value Share and BPS Analysis by Enterprise Size, 2025 and 2035
  • Figure 75: Eastern Europe Market Y-o-Y Growth Comparison by Enterprise Size, 2025-2035
  • Figure 76: Eastern Europe Market Attractiveness Analysis by Enterprise Size
  • Figure 77: East Asia Market Value Share and BPS Analysis by Country, 2025 and 2035
  • Figure 78: East Asia Market Value Share and BPS Analysis by Equipment Types , 2025 and 2035
  • Figure 79: East Asia Market Y-o-Y Growth Comparison by Equipment Types , 2025-2035
  • Figure 80: East Asia Market Attractiveness Analysis by Equipment Types
  • Figure 81: East Asia Market Value Share and BPS Analysis by Power Source Types , 2025 and 2035
  • Figure 82: East Asia Market Y-o-Y Growth Comparison by Power Source Types , 2025-2035
  • Figure 83: East Asia Market Attractiveness Analysis by Power Source Types
  • Figure 84: East Asia Market Value Share and BPS Analysis by End User Types , 2025 and 2035
  • Figure 85: East Asia Market Y-o-Y Growth Comparison by End User Types , 2025-2035
  • Figure 86: East Asia Market Attractiveness Analysis by End User Types
  • Figure 87: East Asia Market Value Share and BPS Analysis by Enterprise Size, 2025 and 2035
  • Figure 88: East Asia Market Y-o-Y Growth Comparison by Enterprise Size, 2025-2035
  • Figure 89: East Asia Market Attractiveness Analysis by Enterprise Size
  • Figure 90: South Asia & Pacific Market Value Share and BPS Analysis by Country, 2025 and 2035
  • Figure 91: South Asia & Pacific Market Value Share and BPS Analysis by Equipment Types , 2025 and 2035
  • Figure 92: South Asia & Pacific Market Y-o-Y Growth Comparison by Equipment Types , 2025-2035
  • Figure 93: South Asia & Pacific Market Attractiveness Analysis by Equipment Types
  • Figure 94: South Asia & Pacific Market Value Share and BPS Analysis by Power Source Types , 2025 and 2035
  • Figure 95: South Asia & Pacific Market Y-o-Y Growth Comparison by Power Source Types , 2025-2035
  • Figure 96: South Asia & Pacific Market Attractiveness Analysis by Power Source Types
  • Figure 97: South Asia & Pacific Market Value Share and BPS Analysis by End User Types , 2025 and 2035
  • Figure 98: South Asia & Pacific Market Y-o-Y Growth Comparison by End User Types , 2025-2035
  • Figure 99: South Asia & Pacific Market Attractiveness Analysis by End User Types
  • Figure 100: South Asia & Pacific Market Value Share and BPS Analysis by Enterprise Size, 2025 and 2035
  • Figure 101: South Asia & Pacific Market Y-o-Y Growth Comparison by Enterprise Size, 2025-2035
  • Figure 102: South Asia & Pacific Market Attractiveness Analysis by Enterprise Size
  • Figure 103: Middle East & Africa Market Value Share and BPS Analysis by Country, 2025 and 2035
  • Figure 104: Middle East & Africa Market Value Share and BPS Analysis by Equipment Types , 2025 and 2035
  • Figure 105: Middle East & Africa Market Y-o-Y Growth Comparison by Equipment Types , 2025-2035
  • Figure 106: Middle East & Africa Market Attractiveness Analysis by Equipment Types
  • Figure 107: Middle East & Africa Market Value Share and BPS Analysis by Power Source Types , 2025 and 2035
  • Figure 108: Middle East & Africa Market Y-o-Y Growth Comparison by Power Source Types , 2025-2035
  • Figure 109: Middle East & Africa Market Attractiveness Analysis by Power Source Types
  • Figure 110: Middle East & Africa Market Value Share and BPS Analysis by End User Types , 2025 and 2035
  • Figure 111: Middle East & Africa Market Y-o-Y Growth Comparison by End User Types , 2025-2035
  • Figure 112: Middle East & Africa Market Attractiveness Analysis by End User Types
  • Figure 113: Middle East & Africa Market Value Share and BPS Analysis by Enterprise Size, 2025 and 2035
  • Figure 114: Middle East & Africa Market Y-o-Y Growth Comparison by Enterprise Size, 2025-2035
  • Figure 115: Middle East & Africa Market Attractiveness Analysis by Enterprise Size
  • Figure 116: Global Market - Tier Structure Analysis
  • Figure 117: Global Market - Company Share Analysis

Frequently Asked Questions

What is the current market size of the outdoor power equipment market?

The global outdoor power equipment market is estimated to be valued at USD 38.4 billion in 2025.

What is the expected market size by 2035?

The market is projected to reach approximately USD 55.1 billion by 2035.

What is the compound annual growth rate (CAGR) for the forecast period?

The market is expected to grow at a CAGR of 3.7% between 2025 and 2035.

Which equipment type leads the market demand?

Lawn mowers are projected to remain the leading equipment category due to high demand from both residential and commercial end users.

Which power source segment is gaining traction fastest?

Battery-powered tools are witnessing rapid growth driven by increased adoption in noise-sensitive urban zones and sustainability efforts.

Who are the major players operating in this market?

Key companies include Husqvarna, Honda, STIHL, Briggs & Stratton, Bosch, Toro, and Stanley Black & Decker, among others.

What are the primary end-use segments in the market?

The market is segmented into commercial, residential, and industrial applications, with commercial holding the largest share.

Which region offers the strongest growth potential?

Asia Pacific, led by China and India, is expected to offer significant growth opportunities due to increasing urbanization and landscaping activities.

Explore Similar Insights

Future Market Insights

Outdoor Power Equipment Market