Reports

- Global Locations -

Headquarters

Future Market Insights, Inc.

Christiana Corporate, 200
Continental Drive, Suite 401,
Newark, Delaware - 19713,
United States

T: +1-845-579-5705

Americas

Future Market Insights, Inc.

616 Corporate Way, Suite 2-9018,
Valley Cottage, NY 10989, United States

T: +1-347-918-3531

MEA

Future Market Insights

1602-6 Jumeirah Bay X2 Tower, Plot No: JLT-PH2-X2A,
Jumeirah Lakes Towers, Dubai,
United Arab Emirates

Europe

Future Market Insights

3rd Floor, 207 Regent Street,
W1B 3HH London
United Kingdom

T: + 44 (0) 20 8123 9659
D: +44 (0) 20 3287 4268

Asia Pacific

Future Market Insights

IndiaLand Global Tech Park, Unit UG-1, Behind Grand HighStreet, Phase 1, Hinjawadi, MH, Pune – 411057, India

Flash Calling Authentication Market Outlook (2023 to 2033)

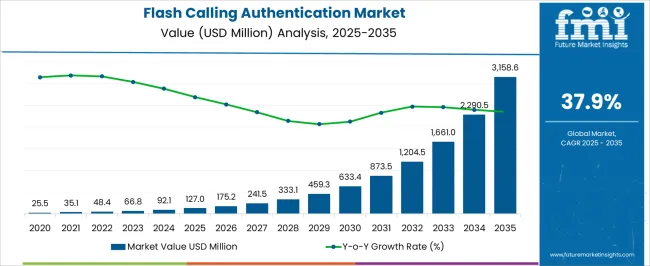
The flash calling authentication market size is projected to be worth US$ 66,792.7 million in 2023. The market is likely to surpass US$ 1, 6454,800.0 million by 2033 securing a CAGR of 37.9% during the forecast period.

Flash calling authentication is a telecommunications concept that includes authenticating the validity of phone calls via a fast, automated verification process.

The primary goal of the flash calling authentication market is to improve the security and reliability of phone calls. This authentication method adds an extra degree of protection against fraudulent activity by using flash calls with unique verification codes or tokens. It allows recipients to validate incoming calls and confirm the caller's identity before engaging in discussion.

Other Drivers Propelling the Demand for Flash Calling Authentication include:

  • Rising Phone Scams and Fraudulent Activities: The increasing prevalence of phone scams, spoofing, and identity theft has created a need for strong authentication methods.
  • Regulatory Requirements and Compliance: Governments and regulatory bodies are introducing strict regulations to combat phone fraud and protect consumers’ identities.
  • Advancements in Technology: Continuous advancements in technology, such as artificial intelligence, machine learning, and voice recognition, enable sophisticated flash calling authentication solutions.
  • Cost Efficiency: Flash calling Authentication offers a cost-effective solution compared to traditional methods such as hardware-based authentication systems.
  • Industry Collaboration: Collaboration between telecommunications service providers, technology companies, and cybersecurity firms fosters the development and deployment of flash calling authentication solutions.

Challenges for Companies /Manufacturers in the Flash Calling Authentication Market:

  • Technological Complexity: The complexity of integrating these solutions into existing communication networks can pose challenges.
  • Scalability and Interoperability: Ensuring interoperability with different telecommunication networks and devices can be a complex task, requiring compatibility across various platforms and systems.
  • Fraudulent Techniques and Evolving Threats: Staying ahead of fraudsters and maintaining robust security measures is an ongoing challenge.
  • Cost and Return on Investment: Companies need to assess the cost-effectiveness and the return on investment of these solutions, considering factors such as implementation expenses, maintenance costs, and the potential reduction in fraud-related losses.

Opportunities in the Flash Calling Authentication Industry:

  • Adoption by Service Providers: By offering secure calling services to their customers, service providers can differentiate themselves in the market and enhance customer loyalty.
  • Integration with Existing Security Systems: Flash calling authentication solutions can be integrated with existing security systems and platforms, such as authentication apps, biometric technologies, and fraud detection systems. This integration can provide a multi-layered security approach and strengthen overall call security.
  • Expansion to New Geographies: The need for secure call authentication is not limited to specific regions. Emerging economies with a growing mobile subscriber base offer untapped potential for market penetration.
  • Rising Demand for Remote Authentication: Flash calling authentication can provide an added layer of security for remote communications, such as video conferencing and virtual meetings.

Latest Trends in the Flash Calling Authentication Market:

  • Artificial Intelligence and Machine Learning: These technologies enable an intelligent analysis of call patterns, behavior, and voice characteristics, allowing for accurate and efficient authentication processes.
  • Real-Time Call Authentication: Real-time call authentication is a growing trend in the flash calling authentication market. This approach verifies the caller's identity during the call, allowing for immediate detection of fraudulent or suspicious activities.
  • Cloud-based Flash Calling Authentication: Cloud deployment offers scalability, flexibility, and cost-effectiveness, allowing organizations to easily implement and manage authentication services without significant infrastructure investments.
  • Regulatory Compliance: Compliance with data protection and privacy regulations, such as GDPR and CCPA, is a growing concern in the flash calling authentication market.
Attributes Details
Flash Calling Authentication Market Size (2023) US$ 66,792.7 million
Flash Calling Authentication Market Projected Size (2033) US$ 1,6454,800.0 million
Value CAGR (2023 to 2033) 37.9%

Don't pay for what you don't need

Customize your report by selecting specific countries or regions and save 30%!

2018 to 2022 Flash Calling Authentication Demand Outlook Compared to 2023 to 2033 Forecast

The flash calling authentication market witnessed a growth rate of 35.4% from 2018 to 2022.

Historically, the demand for flash calling authentication solutions has been driven by the need for enhanced call security and the rising threat of fraudulent activities, such as identity theft and phone scams. Organizations and individuals have recognized the importance of verifying caller identities to prevent unauthorized access and protect sensitive information.

The Future Sales Outlook for the Flash Calling Authentication Market is Optimistic, Driven by Several Factors.

The flash calling authentication market size is projected to be worth US$ 66,792.7 million in 2023. The market is likely to surpass US$ 1, 6454,800.0 million by 2033 at a CAGR of 37.9% during the forecast period.

With the proliferation of smartphones and the increasing reliance on mobile devices for communication, the need for secure mobile calling solutions is growing. The evolving regulatory landscape, including regulations related to data protection and privacy, is significantly contributing to the increased demand for flash calling Authentication.

Various industries, such as finance, healthcare, and e-commerce, have specific security requirements and face high risks of fraudulent activities. These industries are expected to drive the demand for flash calling authentication as they seek robust authentication solutions to protect sensitive customer information and maintain trust.
Sudip Saha
Sudip Saha

Principal Consultant

Talk to Analyst

Find your sweet spots for generating winning opportunities in this market.

Comparative View of the Flash Calling Authentication Market

Flash Calling Authentication Market:

Attributes Flash Calling Authentication Market
CAGR (2023 to 2033) 37.9%
Market Value (2033) US$ 1,6454,800.0 million
Opportunity By offering secure calling services to their customers, service providers can differentiate themselves in the market and enhance customer loyalty.
Key Trends Real-time call authentication is a growing trend in the flash calling authentication market. This approach verifies the caller's identity during the call, allowing for immediate detection of fraudulent or suspicious activities.

Passwordless Authentication Market:

Attributes Passwordless Authentication Market
CAGR (2023 to 2033) 15.3%
Market Value (2033) US$ 55,679.4 million
Opportunity The Internet of Things (IoT) and artificial intelligence in smartphones and tablets among other things, are driving the emergence of password-less authentication solutions.
Key Trends To authenticate and verify their personnel, businesses use facial recognition, speech analysis, and iris recognition.

Authentication Solution Market:

Attributes Authentication Solution Market
CAGR (2023 to 2033) 7.1%
Market Value (2033) US$ 56.3 billion
Opportunity Given the increase in cyber-attacks, it is critical to employ an authentication solution. Furthermore, the rise in online fraud has become a key driver of the authentication solution market.
Key Trends Integration of machine learning and artificial intelligence is the key trend in the authentication market.

Country-Wise Insights

Europe’s Market for Flash Calling Authentication is a Prominent and Growing Segment in the Telecommunications and Cybersecurity Industry.

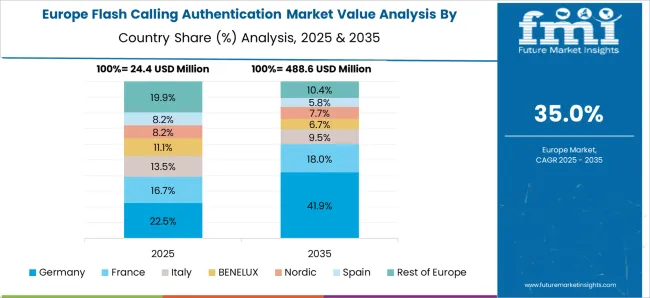
Europe captured a sizeable share of 24.3% in 2022. The region's businesses, government organizations, and individuals prioritize secure communication to protect against fraudulent activities and ensure privacy.

People in Europe have a strong focus on privacy and security concerns. Flash calling authentication, with its ability to verify caller identities and protect against fraudulent activities, aligns well with the privacy and security expectations of consumers in Europe and organizations. This drives the adoption of flash calling authentication solutions across various sectors in Europe.
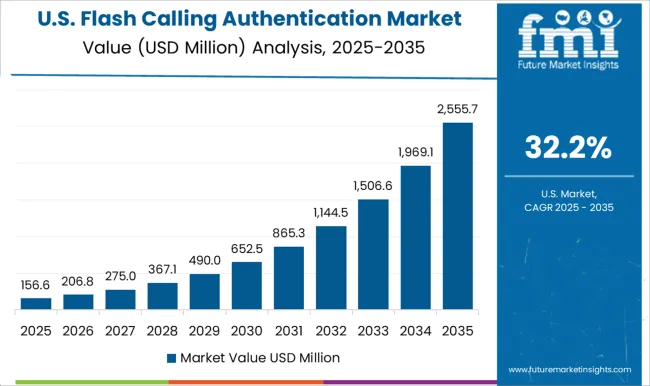
The United States is a Key Market for Flash Calling Authentication, Given its Large Population and Advanced Telecommunication Infrastructure.

The United States market holds a commanding share of 18.7%, highly influencing North American region. The United States is renowned for its technological innovations, and the flash calling authentication market is no exception.

Companies and research institutions in America are at the forefront of developing cutting-edge technologies and solutions to combat identity theft, spoofing, and other forms of fraudulent activities in phone calls. These advancements contribute to the growth and competitiveness of the United States market.

With the increasing prevalence of phone scams and fraudulent calls, consumer protection has become a significant concern in the United States market. Flash calling authentication addresses this concern by providing reliable methods to verify caller identities and protect individuals from falling victim to scams.

British Companies and Research Institutions are Actively Involved in Developing Advanced Technologies and Solutions to Combat Identity Theft, Spoofing, and other forms of Phone Call Fraud.

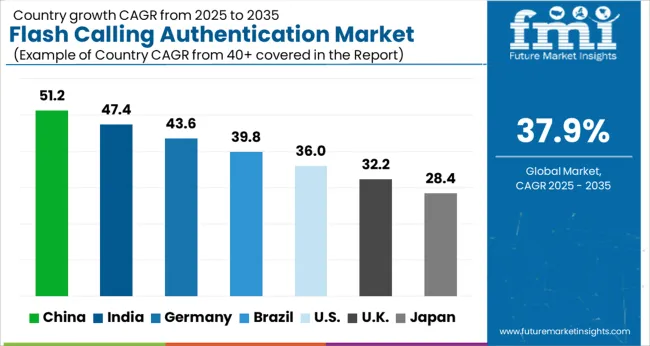
The United Kingdom market in flash calling authentication is anticipated to record a progressive CAGR of 36.5% from 2023 to 2033. The United Kingdom has established regulatory frameworks to address privacy, data protection, and consumer rights in the telecommunications sector. Regulatory bodies such as Ofcom (Office of Communications) and the Information Commissioner's Office (ICO) play a vital role in promoting secure communication practices. Compliance with regulations and guidelines related to consumer privacy and call security drives the adoption of Flash calling authentication solutions in the United Kingdom market.

With a Booming Telecommunication Industry and Increasing Concerns about Phone Call Fraud and Identity Theft, there is a Growing Demand for Secure Communication Solutions in China.

China is showing all the signs to be one of the notable markets globally, witnessing an astonishing CAGR of 37.4% between 2023 and 2033. China is a mobile-first market, with a significant number of smartphone users and a high reliance on mobile communication. Flash calling authentication solutions cater to the mobile-centric nature of the market, providing secure and convenient authentication methods for phone calls.

Government support, policies, and regulations drive the adoption of flash calling authentication solutions in the market. Additionally, regulatory measures are in place to ensure compliance and promote secure communication practices.

Get the data you need at a Fraction of the cost

Personalize your report by choosing insights you need
and save 40%!

Category-Wise Insights

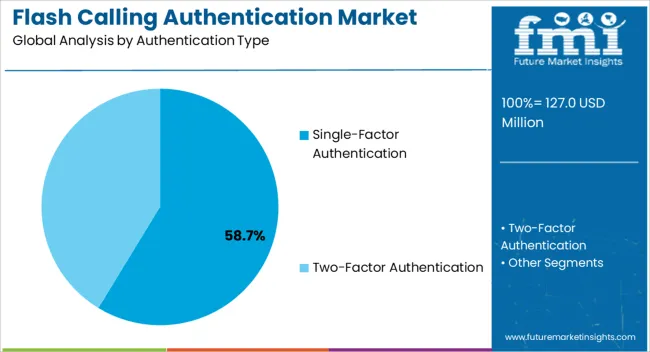
Single Factor Authentications Commands a Sizeable Share of 61.7% in the Market due to its User-friendliness

The single factor authentication (SFA) holds a significant share of the flash calling authentication market. SFA refers to the use of a single method or factor, such as a password or a PIN to authenticate the identity of a caller during a phone call.

SFA remains prevalent in certain scenarios while the market is witnessing advancements in multi-factor authentication (MFA) and strong security measures. It is particularly utilized in situations where a basic level of identity verification is sufficient or where convenience and ease of use are prioritized over heightened security.

The Adoption of MFA in the Flash Calling Authentication Market is Driven by the Need to Combat Evolving Security Threats, Protect Sensitive Information, and Prevent Fraudulent Activities.

The multi factor authentication segment is likely to hold 39.3% of the market share. As the importance of securing phone communications increases, organizations and users are recognizing the limitations of relying solely on a single authentication factor like a password or PIN.

MFA combines multiple factors, including something the caller knows (e.g., password or PIN), has (e.g., mobile device or token), or is (e.g., biometric data like fingerprint or voice recognition), to establish a robust and reliable identity verification process.
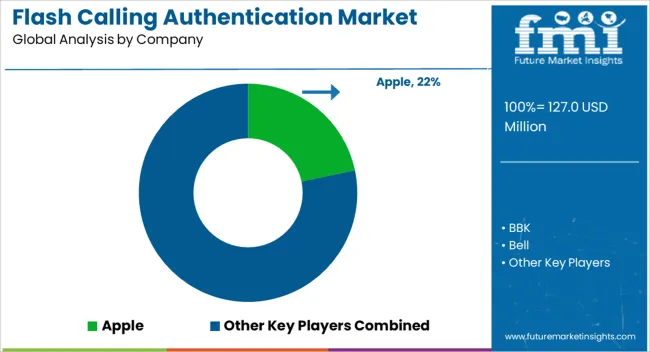
Competitive Landscape

Manufacturers can improve output and match consumer demand through strategic alliances, improving both revenues and market share. End-users profit from new technologies as new items and technologies are introduced. One of the potential benefits of strategic cooperation is increased manufacturing capacity.

Recent Developments:

  • WhatsApp started testing a feature in May 2021 that allows users to verify their phone numbers while connecting to a new device. WhatsApp allows users to verify their phone numbers when they sign up by delivering a verification code to their mobile phones. Meanwhile, WhatsApp wants to add a function called flash call, which is going to allow an automated phone call to validate the phone number.
  • Verihubs, an Indonesian business concentrating on ID and data verification, revealed in September 2021 that it had raised $ 2.8 million in seed funding to become Southeast Asia's one-stop shop for verification. According to Verihubs, many financial institutions in Southeast Asia require two or three weeks to authenticate new customers.

Segmentation Analysis of the Flash Calling Authentication Market

By Authentication Type:

  • Single-factor Authentication
  • Two-factor Authentication

By Region:

  • North America
  • Latin America
  • Europe
  • East Asia
  • South Asia
  • Oceania
  • The Middle East & Africa

Frequently Asked Questions

What is the anticipated size of the Flash Calling Authentication market in 2023?

The market is expected to reach a valuation of US$ 66,792.7 million in 2023.

What is the expected CAGR of the market in China by 2023?

China flash calling authentication market is anticipated to surge at a CAGR of 37.4% through 2033.

What is the anticipated value of the market by the end of 2033?

The flash calling authentication market is anticipated to reach US$ 1,454,800.0 million in 2033.

What is the expected revenue for United States Flash Calling Authentication Industry?

The United States industry is likely to garner 19% in revenue through 2023.

What opportunities await the industry players?

Growing demand for remote authentication to present a significant opportunity for the industry players.

Table of Content

1. Executive Summary

    1.1. Global Market Outlook

    1.2. Demand-side Trends

    1.3. Supply-side Trends

    1.4. Technology Roadmap Analysis

    1.5. Analysis and Recommendations

2. Market Overview

    2.1. Market Coverage / Taxonomy

    2.2. Market Definition / Scope / Limitations

3. Market Background

    3.1. Market Dynamics

        3.1.1. Drivers

        3.1.2. Restraints

        3.1.3. Opportunity

        3.1.4. Trends

    3.2. Scenario Forecast

        3.2.1. Demand in Optimistic Scenario

        3.2.2. Demand in Likely Scenario

        3.2.3. Demand in Conservative Scenario

    3.3. Opportunity Map Analysis

    3.4. Investment Feasibility Matrix

    3.5. PESTLE and Porter’s Analysis

    3.6. Regulatory Landscape

        3.6.1. By Key Regions

        3.6.2. By Key Countries

    3.7. Regional Parent Market Outlook

4. Global Market Analysis 2018 to 2022 and Forecast, 2023 to 2033

    4.1. Historical Market Size Value (US$ Million) Analysis, 2018 to 2022

    4.2. Current and Future Market Size Value (US$ Million) Projections, 2023 to 2033

        4.2.1. Y-o-Y Growth Trend Analysis

        4.2.2. Absolute $ Opportunity Analysis

5. Global Market Analysis 2018 to 2022 and Forecast 2023 to 2033, By Authentication Type

    5.1. Introduction / Key Findings

    5.2. Historical Market Size Value (US$ Million) Analysis By Authentication Type, 2018 to 2022

    5.3. Current and Future Market Size Value (US$ Million) Analysis and Forecast By Authentication Type, 2023 to 2033

        5.3.1. Two-Factor Authentication (2FA)

        5.3.2. Multi-Factor Authentication (MFA)

        5.3.3. Biometric Authentication

        5.3.4. Single Sign-On (SSO)

        5.3.5. Passwordless Authentication

        5.3.6. Others

    5.4. Y-o-Y Growth Trend Analysis By Authentication Type, 2018 to 2022

    5.5. Absolute $ Opportunity Analysis By Authentication Type, 2023 to 2033

6. Global Market Analysis 2018 to 2022 and Forecast 2023 to 2033, By End User

    6.1. Introduction / Key Findings

    6.2. Historical Market Size Value (US$ Million) Analysis By End User, 2018 to 2022

    6.3. Current and Future Market Size Value (US$ Million) Analysis and Forecast By End User, 2023 to 2033

        6.3.1. Individual Consumers

        6.3.2. Enterprises

    6.4. Y-o-Y Growth Trend Analysis By End User, 2018 to 2022

    6.5. Absolute $ Opportunity Analysis By End User, 2023 to 2033

7. Global Market Analysis 2018 to 2022 and Forecast 2023 to 2033, By Region

    7.1. Introduction

    7.2. Historical Market Size Value (US$ Million) Analysis By Region, 2018 to 2022

    7.3. Current Market Size Value (US$ Million) Analysis and Forecast By Region, 2023 to 2033

        7.3.1. North America

        7.3.2. Latin America

        7.3.3. Europe

        7.3.4. South Asia

        7.3.5. East Asia

        7.3.6. Oceania

        7.3.7. MEA

    7.4. Market Attractiveness Analysis By Region

8. North America Market Analysis 2018 to 2022 and Forecast 2023 to 2033, By Country

    8.1. Historical Market Size Value (US$ Million) Trend Analysis By Market Taxonomy, 2018 to 2022

    8.2. Market Size Value (US$ Million) Forecast By Market Taxonomy, 2023 to 2033

        8.2.1. By Country

            8.2.1.1. U.S.

            8.2.1.2. Canada

        8.2.2. By Authentication Type

        8.2.3. By End User

    8.3. Market Attractiveness Analysis

        8.3.1. By Country

        8.3.2. By Authentication Type

        8.3.3. By End User

    8.4. Key Takeaways

9. Latin America Market Analysis 2018 to 2022 and Forecast 2023 to 2033, By Country

    9.1. Historical Market Size Value (US$ Million) Trend Analysis By Market Taxonomy, 2018 to 2022

    9.2. Market Size Value (US$ Million) Forecast By Market Taxonomy, 2023 to 2033

        9.2.1. By Country

            9.2.1.1. Brazil

            9.2.1.2. Mexico

            9.2.1.3. Rest of Latin America

        9.2.2. By Authentication Type

        9.2.3. By End User

    9.3. Market Attractiveness Analysis

        9.3.1. By Country

        9.3.2. By Authentication Type

        9.3.3. By End User

    9.4. Key Takeaways

10. Europe Market Analysis 2018 to 2022 and Forecast 2023 to 2033, By Country

    10.1. Historical Market Size Value (US$ Million) Trend Analysis By Market Taxonomy, 2018 to 2022

    10.2. Market Size Value (US$ Million) Forecast By Market Taxonomy, 2023 to 2033

        10.2.1. By Country

            10.2.1.1. Germany

            10.2.1.2. U.K.

            10.2.1.3. France

            10.2.1.4. Spain

            10.2.1.5. Italy

            10.2.1.6. Rest of Europe

        10.2.2. By Authentication Type

        10.2.3. By End User

    10.3. Market Attractiveness Analysis

        10.3.1. By Country

        10.3.2. By Authentication Type

        10.3.3. By End User

    10.4. Key Takeaways

11. South Asia Market Analysis 2018 to 2022 and Forecast 2023 to 2033, By Country

    11.1. Historical Market Size Value (US$ Million) Trend Analysis By Market Taxonomy, 2018 to 2022

    11.2. Market Size Value (US$ Million) Forecast By Market Taxonomy, 2023 to 2033

        11.2.1. By Country

            11.2.1.1. India

            11.2.1.2. Malaysia

            11.2.1.3. Singapore

            11.2.1.4. Thailand

            11.2.1.5. Rest of South Asia

        11.2.2. By Authentication Type

        11.2.3. By End User

    11.3. Market Attractiveness Analysis

        11.3.1. By Country

        11.3.2. By Authentication Type

        11.3.3. By End User

    11.4. Key Takeaways

12. East Asia Market Analysis 2018 to 2022 and Forecast 2023 to 2033, By Country

    12.1. Historical Market Size Value (US$ Million) Trend Analysis By Market Taxonomy, 2018 to 2022

    12.2. Market Size Value (US$ Million) Forecast By Market Taxonomy, 2023 to 2033

        12.2.1. By Country

            12.2.1.1. China

            12.2.1.2. Japan

            12.2.1.3. South Korea

        12.2.2. By Authentication Type

        12.2.3. By End User

    12.3. Market Attractiveness Analysis

        12.3.1. By Country

        12.3.2. By Authentication Type

        12.3.3. By End User

    12.4. Key Takeaways

13. Oceania Market Analysis 2018 to 2022 and Forecast 2023 to 2033, By Country

    13.1. Historical Market Size Value (US$ Million) Trend Analysis By Market Taxonomy, 2018 to 2022

    13.2. Market Size Value (US$ Million) Forecast By Market Taxonomy, 2023 to 2033

        13.2.1. By Country

            13.2.1.1. Australia

            13.2.1.2. New Zealand

        13.2.2. By Authentication Type

        13.2.3. By End User

    13.3. Market Attractiveness Analysis

        13.3.1. By Country

        13.3.2. By Authentication Type

        13.3.3. By End User

    13.4. Key Takeaways

14. MEA Market Analysis 2018 to 2022 and Forecast 2023 to 2033, By Country

    14.1. Historical Market Size Value (US$ Million) Trend Analysis By Market Taxonomy, 2018 to 2022

    14.2. Market Size Value (US$ Million) Forecast By Market Taxonomy, 2023 to 2033

        14.2.1. By Country

            14.2.1.1. GCC Countries

            14.2.1.2. South Africa

            14.2.1.3. Israel

            14.2.1.4. Rest of MEA

        14.2.2. By Authentication Type

        14.2.3. By End User

    14.3. Market Attractiveness Analysis

        14.3.1. By Country

        14.3.2. By Authentication Type

        14.3.3. By End User

    14.4. Key Takeaways

15. Key Countries Market Analysis

    15.1. U.S.

        15.1.1. Pricing Analysis

        15.1.2. Market Share Analysis, 2022

            15.1.2.1. By Authentication Type

            15.1.2.2. By End User

    15.2. Canada

        15.2.1. Pricing Analysis

        15.2.2. Market Share Analysis, 2022

            15.2.2.1. By Authentication Type

            15.2.2.2. By End User

    15.3. Brazil

        15.3.1. Pricing Analysis

        15.3.2. Market Share Analysis, 2022

            15.3.2.1. By Authentication Type

            15.3.2.2. By End User

    15.4. Mexico

        15.4.1. Pricing Analysis

        15.4.2. Market Share Analysis, 2022

            15.4.2.1. By Authentication Type

            15.4.2.2. By End User

    15.5. Germany

        15.5.1. Pricing Analysis

        15.5.2. Market Share Analysis, 2022

            15.5.2.1. By Authentication Type

            15.5.2.2. By End User

    15.6. U.K.

        15.6.1. Pricing Analysis

        15.6.2. Market Share Analysis, 2022

            15.6.2.1. By Authentication Type

            15.6.2.2. By End User

    15.7. France

        15.7.1. Pricing Analysis

        15.7.2. Market Share Analysis, 2022

            15.7.2.1. By Authentication Type

            15.7.2.2. By End User

    15.8. Spain

        15.8.1. Pricing Analysis

        15.8.2. Market Share Analysis, 2022

            15.8.2.1. By Authentication Type

            15.8.2.2. By End User

    15.9. Italy

        15.9.1. Pricing Analysis

        15.9.2. Market Share Analysis, 2022

            15.9.2.1. By Authentication Type

            15.9.2.2. By End User

    15.10. India

        15.10.1. Pricing Analysis

        15.10.2. Market Share Analysis, 2022

            15.10.2.1. By Authentication Type

            15.10.2.2. By End User

    15.11. Malaysia

        15.11.1. Pricing Analysis

        15.11.2. Market Share Analysis, 2022

            15.11.2.1. By Authentication Type

            15.11.2.2. By End User

    15.12. Singapore

        15.12.1. Pricing Analysis

        15.12.2. Market Share Analysis, 2022

            15.12.2.1. By Authentication Type

            15.12.2.2. By End User

    15.13. Thailand

        15.13.1. Pricing Analysis

        15.13.2. Market Share Analysis, 2022

            15.13.2.1. By Authentication Type

            15.13.2.2. By End User

    15.14. China

        15.14.1. Pricing Analysis

        15.14.2. Market Share Analysis, 2022

            15.14.2.1. By Authentication Type

            15.14.2.2. By End User

    15.15. Japan

        15.15.1. Pricing Analysis

        15.15.2. Market Share Analysis, 2022

            15.15.2.1. By Authentication Type

            15.15.2.2. By End User

    15.16. South Korea

        15.16.1. Pricing Analysis

        15.16.2. Market Share Analysis, 2022

            15.16.2.1. By Authentication Type

            15.16.2.2. By End User

    15.17. Australia

        15.17.1. Pricing Analysis

        15.17.2. Market Share Analysis, 2022

            15.17.2.1. By Authentication Type

            15.17.2.2. By End User

    15.18. New Zealand

        15.18.1. Pricing Analysis

        15.18.2. Market Share Analysis, 2022

            15.18.2.1. By Authentication Type

            15.18.2.2. By End User

    15.19. GCC Countries

        15.19.1. Pricing Analysis

        15.19.2. Market Share Analysis, 2022

            15.19.2.1. By Authentication Type

            15.19.2.2. By End User

    15.20. South Africa

        15.20.1. Pricing Analysis

        15.20.2. Market Share Analysis, 2022

            15.20.2.1. By Authentication Type

            15.20.2.2. By End User

    15.21. Israel

        15.21.1. Pricing Analysis

        15.21.2. Market Share Analysis, 2022

            15.21.2.1. By Authentication Type

            15.21.2.2. By End User

16. Market Structure Analysis

    16.1. Competition Dashboard

    16.2. Competition Benchmarking

    16.3. Market Share Analysis of Top Players

        16.3.1. By Regional

        16.3.2. By Authentication Type

        16.3.3. By End User

17. Competition Analysis

    17.1. Competition Deep Dive

        17.1.1. Apple

            17.1.1.1. Overview

            17.1.1.2. Product Portfolio

            17.1.1.3. Profitability by Market Segments

            17.1.1.4. Sales Footprint

            17.1.1.5. Strategy Overview

                17.1.1.5.1. Marketing Strategy

        17.1.2. BBK

            17.1.2.1. Overview

            17.1.2.2. Product Portfolio

            17.1.2.3. Profitability by Market Segments

            17.1.2.4. Sales Footprint

            17.1.2.5. Strategy Overview

                17.1.2.5.1. Marketing Strategy

        17.1.3. Bell

            17.1.3.1. Overview

            17.1.3.2. Product Portfolio

            17.1.3.3. Profitability by Market Segments

            17.1.3.4. Sales Footprint

            17.1.3.5. Strategy Overview

                17.1.3.5.1. Marketing Strategy

        17.1.4. Deutsche Telekom

            17.1.4.1. Overview

            17.1.4.2. Product Portfolio

            17.1.4.3. Profitability by Market Segments

            17.1.4.4. Sales Footprint

            17.1.4.5. Strategy Overview

                17.1.4.5.1. Marketing Strategy

        17.1.5. Facebook Messenger

            17.1.5.1. Overview

            17.1.5.2. Product Portfolio

            17.1.5.3. Profitability by Market Segments

            17.1.5.4. Sales Footprint

            17.1.5.5. Strategy Overview

                17.1.5.5.1. Marketing Strategy

        17.1.6. Huawei

            17.1.6.1. Overview

            17.1.6.2. Product Portfolio

            17.1.6.3. Profitability by Market Segments

            17.1.6.4. Sales Footprint

            17.1.6.5. Strategy Overview

                17.1.6.5.1. Marketing Strategy

        17.1.7. Imo

            17.1.7.1. Overview

            17.1.7.2. Product Portfolio

            17.1.7.3. Profitability by Market Segments

            17.1.7.4. Sales Footprint

            17.1.7.5. Strategy Overview

                17.1.7.5.1. Marketing Strategy

        17.1.8. Kakao Talk

            17.1.8.1. Overview

            17.1.8.2. Product Portfolio

            17.1.8.3. Profitability by Market Segments

            17.1.8.4. Sales Footprint

            17.1.8.5. Strategy Overview

                17.1.8.5.1. Marketing Strategy

        17.1.9. Lenovo

            17.1.9.1. Overview

            17.1.9.2. Product Portfolio

            17.1.9.3. Profitability by Market Segments

            17.1.9.4. Sales Footprint

            17.1.9.5. Strategy Overview

                17.1.9.5.1. Marketing Strategy

        17.1.10. LINE

            17.1.10.1. Overview

            17.1.10.2. Product Portfolio

            17.1.10.3. Profitability by Market Segments

            17.1.10.4. Sales Footprint

            17.1.10.5. Strategy Overview

                17.1.10.5.1. Marketing Strategy

        17.1.11. Meta

            17.1.11.1. Overview

            17.1.11.2. Product Portfolio

            17.1.11.3. Profitability by Market Segments

            17.1.11.4. Sales Footprint

            17.1.11.5. Strategy Overview

                17.1.11.5.1. Marketing Strategy

        17.1.12. Orange

            17.1.12.1. Overview

            17.1.12.2. Product Portfolio

            17.1.12.3. Profitability by Market Segments

            17.1.12.4. Sales Footprint

            17.1.12.5. Strategy Overview

                17.1.12.5.1. Marketing Strategy

        17.1.13. Samsung

            17.1.13.1. Overview

            17.1.13.2. Product Portfolio

            17.1.13.3. Profitability by Market Segments

            17.1.13.4. Sales Footprint

            17.1.13.5. Strategy Overview

                17.1.13.5.1. Marketing Strategy

        17.1.14. Telefonica

            17.1.14.1. Overview

            17.1.14.2. Product Portfolio

            17.1.14.3. Profitability by Market Segments

            17.1.14.4. Sales Footprint

            17.1.14.5. Strategy Overview

                17.1.14.5.1. Marketing Strategy

18. Assumptions & Acronyms Used

19. Research Methodology

Don't pay for what you don't need

Customize your report by selecting specific countries or regions and save 30%!

List of Tables

Table 1: Global Market Value (US$ Million) Forecast by Region, 2018 to 2033

Table 2: Global Market Value (US$ Million) Forecast by Authentication Type, 2018 to 2033

Table 3: Global Market Value (US$ Million) Forecast by End User, 2018 to 2033

Table 4: North America Market Value (US$ Million) Forecast by Country, 2018 to 2033

Table 5: North America Market Value (US$ Million) Forecast by Authentication Type, 2018 to 2033

Table 6: North America Market Value (US$ Million) Forecast by End User, 2018 to 2033

Table 7: Latin America Market Value (US$ Million) Forecast by Country, 2018 to 2033

Table 8: Latin America Market Value (US$ Million) Forecast by Authentication Type, 2018 to 2033

Table 9: Latin America Market Value (US$ Million) Forecast by End User, 2018 to 2033

Table 10: Europe Market Value (US$ Million) Forecast by Country, 2018 to 2033

Table 11: Europe Market Value (US$ Million) Forecast by Authentication Type, 2018 to 2033

Table 12: Europe Market Value (US$ Million) Forecast by End User, 2018 to 2033

Table 13: South Asia Market Value (US$ Million) Forecast by Country, 2018 to 2033

Table 14: South Asia Market Value (US$ Million) Forecast by Authentication Type, 2018 to 2033

Table 15: South Asia Market Value (US$ Million) Forecast by End User, 2018 to 2033

Table 16: East Asia Market Value (US$ Million) Forecast by Country, 2018 to 2033

Table 17: East Asia Market Value (US$ Million) Forecast by Authentication Type, 2018 to 2033

Table 18: East Asia Market Value (US$ Million) Forecast by End User, 2018 to 2033

Table 19: Oceania Market Value (US$ Million) Forecast by Country, 2018 to 2033

Table 20: Oceania Market Value (US$ Million) Forecast by Authentication Type, 2018 to 2033

Table 21: Oceania Market Value (US$ Million) Forecast by End User, 2018 to 2033

Table 22: MEA Market Value (US$ Million) Forecast by Country, 2018 to 2033

Table 23: MEA Market Value (US$ Million) Forecast by Authentication Type, 2018 to 2033

Table 24: MEA Market Value (US$ Million) Forecast by End User, 2018 to 2033
Sudip Saha
Sudip Saha

Principal Consultant

Talk to Analyst

Find your sweet spots for generating winning opportunities in this market.

List of Charts

Figure 1: Global Market Value (US$ Million) by Authentication Type, 2023 to 2033

Figure 2: Global Market Value (US$ Million) by End User, 2023 to 2033

Figure 3: Global Market Value (US$ Million) by Region, 2023 to 2033

Figure 4: Global Market Value (US$ Million) Analysis by Region, 2018 to 2033

Figure 5: Global Market Value Share (%) and BPS Analysis by Region, 2023 to 2033

Figure 6: Global Market Y-o-Y Growth (%) Projections by Region, 2023 to 2033

Figure 7: Global Market Value (US$ Million) Analysis by Authentication Type, 2018 to 2033

Figure 8: Global Market Value Share (%) and BPS Analysis by Authentication Type, 2023 to 2033

Figure 9: Global Market Y-o-Y Growth (%) Projections by Authentication Type, 2023 to 2033

Figure 10: Global Market Value (US$ Million) Analysis by End User, 2018 to 2033

Figure 11: Global Market Value Share (%) and BPS Analysis by End User, 2023 to 2033

Figure 12: Global Market Y-o-Y Growth (%) Projections by End User, 2023 to 2033

Figure 13: Global Market Attractiveness by Authentication Type, 2023 to 2033

Figure 14: Global Market Attractiveness by End User, 2023 to 2033

Figure 15: Global Market Attractiveness by Region, 2023 to 2033

Figure 16: North America Market Value (US$ Million) by Authentication Type, 2023 to 2033

Figure 17: North America Market Value (US$ Million) by End User, 2023 to 2033

Figure 18: North America Market Value (US$ Million) by Country, 2023 to 2033

Figure 19: North America Market Value (US$ Million) Analysis by Country, 2018 to 2033

Figure 20: North America Market Value Share (%) and BPS Analysis by Country, 2023 to 2033

Figure 21: North America Market Y-o-Y Growth (%) Projections by Country, 2023 to 2033

Figure 22: North America Market Value (US$ Million) Analysis by Authentication Type, 2018 to 2033

Figure 23: North America Market Value Share (%) and BPS Analysis by Authentication Type, 2023 to 2033

Figure 24: North America Market Y-o-Y Growth (%) Projections by Authentication Type, 2023 to 2033

Figure 25: North America Market Value (US$ Million) Analysis by End User, 2018 to 2033

Figure 26: North America Market Value Share (%) and BPS Analysis by End User, 2023 to 2033

Figure 27: North America Market Y-o-Y Growth (%) Projections by End User, 2023 to 2033

Figure 28: North America Market Attractiveness by Authentication Type, 2023 to 2033

Figure 29: North America Market Attractiveness by End User, 2023 to 2033

Figure 30: North America Market Attractiveness by Country, 2023 to 2033

Figure 31: Latin America Market Value (US$ Million) by Authentication Type, 2023 to 2033

Figure 32: Latin America Market Value (US$ Million) by End User, 2023 to 2033

Figure 33: Latin America Market Value (US$ Million) by Country, 2023 to 2033

Figure 34: Latin America Market Value (US$ Million) Analysis by Country, 2018 to 2033

Figure 35: Latin America Market Value Share (%) and BPS Analysis by Country, 2023 to 2033

Figure 36: Latin America Market Y-o-Y Growth (%) Projections by Country, 2023 to 2033

Figure 37: Latin America Market Value (US$ Million) Analysis by Authentication Type, 2018 to 2033

Figure 38: Latin America Market Value Share (%) and BPS Analysis by Authentication Type, 2023 to 2033

Figure 39: Latin America Market Y-o-Y Growth (%) Projections by Authentication Type, 2023 to 2033

Figure 40: Latin America Market Value (US$ Million) Analysis by End User, 2018 to 2033

Figure 41: Latin America Market Value Share (%) and BPS Analysis by End User, 2023 to 2033

Figure 42: Latin America Market Y-o-Y Growth (%) Projections by End User, 2023 to 2033

Figure 43: Latin America Market Attractiveness by Authentication Type, 2023 to 2033

Figure 44: Latin America Market Attractiveness by End User, 2023 to 2033

Figure 45: Latin America Market Attractiveness by Country, 2023 to 2033

Figure 46: Europe Market Value (US$ Million) by Authentication Type, 2023 to 2033

Figure 47: Europe Market Value (US$ Million) by End User, 2023 to 2033

Figure 48: Europe Market Value (US$ Million) by Country, 2023 to 2033

Figure 49: Europe Market Value (US$ Million) Analysis by Country, 2018 to 2033

Figure 50: Europe Market Value Share (%) and BPS Analysis by Country, 2023 to 2033

Figure 51: Europe Market Y-o-Y Growth (%) Projections by Country, 2023 to 2033

Figure 52: Europe Market Value (US$ Million) Analysis by Authentication Type, 2018 to 2033

Figure 53: Europe Market Value Share (%) and BPS Analysis by Authentication Type, 2023 to 2033

Figure 54: Europe Market Y-o-Y Growth (%) Projections by Authentication Type, 2023 to 2033

Figure 55: Europe Market Value (US$ Million) Analysis by End User, 2018 to 2033

Figure 56: Europe Market Value Share (%) and BPS Analysis by End User, 2023 to 2033

Figure 57: Europe Market Y-o-Y Growth (%) Projections by End User, 2023 to 2033

Figure 58: Europe Market Attractiveness by Authentication Type, 2023 to 2033

Figure 59: Europe Market Attractiveness by End User, 2023 to 2033

Figure 60: Europe Market Attractiveness by Country, 2023 to 2033

Figure 61: South Asia Market Value (US$ Million) by Authentication Type, 2023 to 2033

Figure 62: South Asia Market Value (US$ Million) by End User, 2023 to 2033

Figure 63: South Asia Market Value (US$ Million) by Country, 2023 to 2033

Figure 64: South Asia Market Value (US$ Million) Analysis by Country, 2018 to 2033

Figure 65: South Asia Market Value Share (%) and BPS Analysis by Country, 2023 to 2033

Figure 66: South Asia Market Y-o-Y Growth (%) Projections by Country, 2023 to 2033

Figure 67: South Asia Market Value (US$ Million) Analysis by Authentication Type, 2018 to 2033

Figure 68: South Asia Market Value Share (%) and BPS Analysis by Authentication Type, 2023 to 2033

Figure 69: South Asia Market Y-o-Y Growth (%) Projections by Authentication Type, 2023 to 2033

Figure 70: South Asia Market Value (US$ Million) Analysis by End User, 2018 to 2033

Figure 71: South Asia Market Value Share (%) and BPS Analysis by End User, 2023 to 2033

Figure 72: South Asia Market Y-o-Y Growth (%) Projections by End User, 2023 to 2033

Figure 73: South Asia Market Attractiveness by Authentication Type, 2023 to 2033

Figure 74: South Asia Market Attractiveness by End User, 2023 to 2033

Figure 75: South Asia Market Attractiveness by Country, 2023 to 2033

Figure 76: East Asia Market Value (US$ Million) by Authentication Type, 2023 to 2033

Figure 77: East Asia Market Value (US$ Million) by End User, 2023 to 2033

Figure 78: East Asia Market Value (US$ Million) by Country, 2023 to 2033

Figure 79: East Asia Market Value (US$ Million) Analysis by Country, 2018 to 2033

Figure 80: East Asia Market Value Share (%) and BPS Analysis by Country, 2023 to 2033

Figure 81: East Asia Market Y-o-Y Growth (%) Projections by Country, 2023 to 2033

Figure 82: East Asia Market Value (US$ Million) Analysis by Authentication Type, 2018 to 2033

Figure 83: East Asia Market Value Share (%) and BPS Analysis by Authentication Type, 2023 to 2033

Figure 84: East Asia Market Y-o-Y Growth (%) Projections by Authentication Type, 2023 to 2033

Figure 85: East Asia Market Value (US$ Million) Analysis by End User, 2018 to 2033

Figure 86: East Asia Market Value Share (%) and BPS Analysis by End User, 2023 to 2033

Figure 87: East Asia Market Y-o-Y Growth (%) Projections by End User, 2023 to 2033

Figure 88: East Asia Market Attractiveness by Authentication Type, 2023 to 2033

Figure 89: East Asia Market Attractiveness by End User, 2023 to 2033

Figure 90: East Asia Market Attractiveness by Country, 2023 to 2033

Figure 91: Oceania Market Value (US$ Million) by Authentication Type, 2023 to 2033

Figure 92: Oceania Market Value (US$ Million) by End User, 2023 to 2033

Figure 93: Oceania Market Value (US$ Million) by Country, 2023 to 2033

Figure 94: Oceania Market Value (US$ Million) Analysis by Country, 2018 to 2033

Figure 95: Oceania Market Value Share (%) and BPS Analysis by Country, 2023 to 2033

Figure 96: Oceania Market Y-o-Y Growth (%) Projections by Country, 2023 to 2033

Figure 97: Oceania Market Value (US$ Million) Analysis by Authentication Type, 2018 to 2033

Figure 98: Oceania Market Value Share (%) and BPS Analysis by Authentication Type, 2023 to 2033

Figure 99: Oceania Market Y-o-Y Growth (%) Projections by Authentication Type, 2023 to 2033

Figure 100: Oceania Market Value (US$ Million) Analysis by End User, 2018 to 2033

Figure 101: Oceania Market Value Share (%) and BPS Analysis by End User, 2023 to 2033

Figure 102: Oceania Market Y-o-Y Growth (%) Projections by End User, 2023 to 2033

Figure 103: Oceania Market Attractiveness by Authentication Type, 2023 to 2033

Figure 104: Oceania Market Attractiveness by End User, 2023 to 2033

Figure 105: Oceania Market Attractiveness by Country, 2023 to 2033

Figure 106: MEA Market Value (US$ Million) by Authentication Type, 2023 to 2033

Figure 107: MEA Market Value (US$ Million) by End User, 2023 to 2033

Figure 108: MEA Market Value (US$ Million) by Country, 2023 to 2033

Figure 109: MEA Market Value (US$ Million) Analysis by Country, 2018 to 2033

Figure 110: MEA Market Value Share (%) and BPS Analysis by Country, 2023 to 2033

Figure 111: MEA Market Y-o-Y Growth (%) Projections by Country, 2023 to 2033

Figure 112: MEA Market Value (US$ Million) Analysis by Authentication Type, 2018 to 2033

Figure 113: MEA Market Value Share (%) and BPS Analysis by Authentication Type, 2023 to 2033

Figure 114: MEA Market Y-o-Y Growth (%) Projections by Authentication Type, 2023 to 2033

Figure 115: MEA Market Value (US$ Million) Analysis by End User, 2018 to 2033

Figure 116: MEA Market Value Share (%) and BPS Analysis by End User, 2023 to 2033

Figure 117: MEA Market Y-o-Y Growth (%) Projections by End User, 2023 to 2033

Figure 118: MEA Market Attractiveness by Authentication Type, 2023 to 2033

Figure 119: MEA Market Attractiveness by End User, 2023 to 2033

Figure 120: MEA Market Attractiveness by Country, 2023 to 2033

Recommendations

Technology

3D Secure Payment Authentication Market

Published : January 2023

Technology

Device-Embedded Biometric Authentication Market

Published : December 2022

Explore Technology Insights

View Reports

Flash Calling Authentication Market