The All Flash Array Market is estimated to be valued at USD 31.6 billion in 2025 and is projected to reach USD 132.2 billion by 2035, registering a compound annual growth rate (CAGR) of 15.4% over the forecast period.
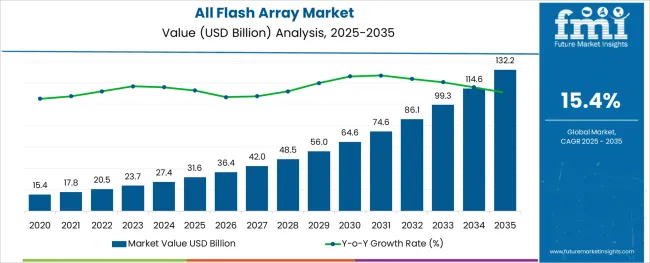
The All Flash Array market is experiencing rapid growth driven by increasing enterprise demand for high-speed data storage and real-time analytics capabilities. As businesses generate growing volumes of data, the need for faster storage systems that reduce latency and improve performance has become critical. The adoption of flash storage technology is supported by its advantages in speed, reliability, and energy efficiency compared to traditional hard disk drives.
Organizations across industries are investing in advanced storage solutions to support digital transformation initiatives, cloud computing, and big data analytics. Enhanced data security and scalability are also driving factors as enterprises seek storage systems that can accommodate expanding workloads while maintaining compliance.
Looking ahead, growth opportunities are expected from ongoing innovation in flash memory technology and integration with software-defined storage platforms. Segmental growth is anticipated to be led by Storage Area Network as the primary storage system, Large Scale Enterprises as the main enterprise segment, and BFSI as a key vertical due to its stringent data management needs.
The market is segmented by Storage System, Enterprise, and Vertical and region. By Storage System, the market is divided into Storage Area Network, Direct-attached Storage, Network-attached Storage, Cloud Storage, Unified Storage, and Software-defined Storage. In terms of Enterprise, the market is classified into Large Scale Enterprises and SMEs.
Based on Vertical, the market is segmented into BFSI, IT & Telecommunications, Government & Defense, Transportation, Manufacturing, Healthcare, Retail, Energy & Utilities, and Others. Regionally, the market is classified into North America, Latin America, Western Europe, Eastern Europe, Balkan & Baltic Countries, Russia & Belarus, Central Asia, East Asia, South Asia & Pacific, and the Middle East & Africa.
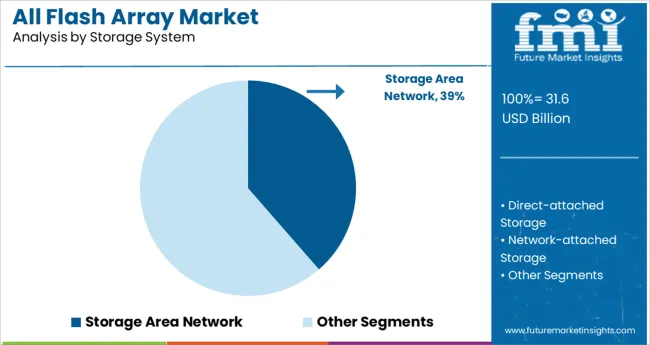
The Storage Area Network segment is projected to hold 38.6% of the All Flash Array market revenue in 2025, retaining its position as the leading storage system type. This segment’s prominence is driven by its ability to provide high-speed, block-level storage access, making it ideal for mission-critical enterprise applications.
Storage Area Networks offer superior performance and reliability, facilitating efficient data transfer between servers and storage devices. The growth of virtualization and cloud infrastructure has further expanded the need for SAN-based flash arrays to ensure rapid access and storage scalability.
As enterprises prioritize reducing downtime and improving application performance, Storage Area Network solutions continue to dominate the market.
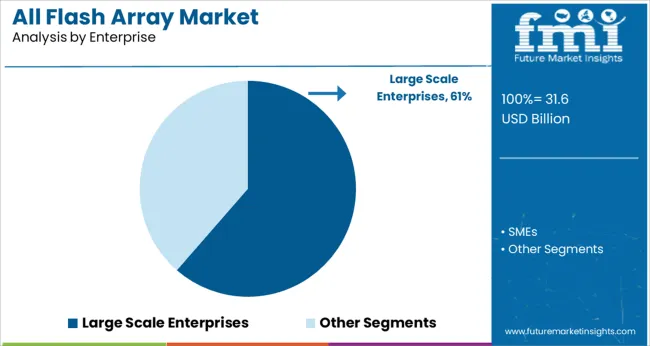
The Large Scale Enterprises segment is expected to contribute 61.4% of the All Flash Array market revenue in 2025, maintaining its leadership in enterprise adoption. Larger organizations require robust, scalable storage solutions capable of handling extensive data workloads with low latency.
These enterprises often operate data centers with complex infrastructure that demands high-performance storage to support critical business applications and analytics. Investments in digital transformation and cloud migration strategies have accelerated the deployment of all flash arrays among large enterprises.
The segment benefits from the increasing emphasis on data-driven decision making and the need for real-time data access. As a result, Large Scale Enterprises remain the primary consumers of all flash array storage systems.
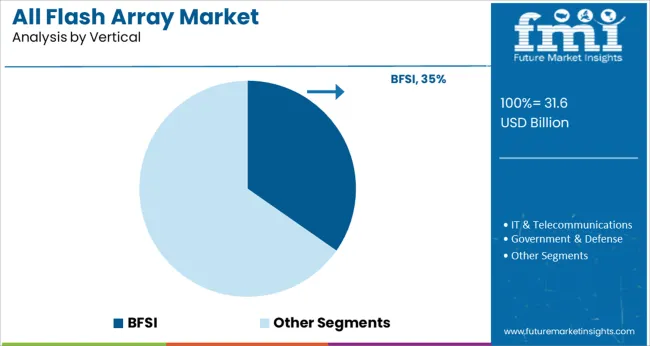
The BFSI vertical is projected to account for 34.7% of the All Flash Array market revenue in 2025, positioning it as a key industry sector. This vertical is characterized by high transaction volumes, stringent data security requirements, and the necessity for uninterrupted service availability.
Financial institutions and insurance companies rely heavily on fast and reliable data storage to support critical applications such as fraud detection, risk management, and customer analytics. Compliance with regulatory standards related to data privacy and protection has also driven investment in advanced storage infrastructures.
The increasing adoption of digital banking and fintech solutions has further spurred demand for all flash arrays in the BFSI sector. Given the sector’s reliance on secure and efficient data management, it continues to lead the adoption of cutting-edge storage technologies.
Flash drives are small in size and attributed with lower disk space and rack requirements, hence lending for easy device management. They have high data transfer rates in comparison to HDDs which is another factor in favor of the product. All Flash arrays score over their opponents, with their relevant cooling quotient that dissipates less heat and helps save on power. Hence they are more adaptive in data centers where they dot draw substantially less air-conditioning power.
All flash drives have a restraining feature that includes its non-volatile structure which fails to retain data in times of a power failure, as also with data recovery which in comparison with standard disks is even more difficult. Thus proper back-up of data is required in the event of power failure with subsequent data loss. Flash drives are also costlier than spinning media.
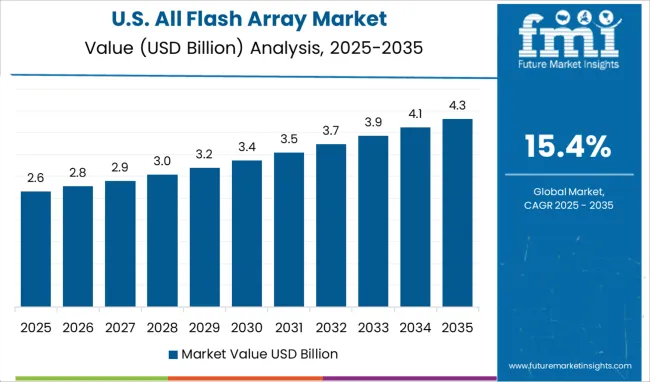
North America and Europe are geared for growth in the all flash array market. The market is concentrated in North America due to technological advancements in the region. A market share worth 30.5% is expected for the all flash array market in North America.
Besides, North America is attributed with high growth because of proliferating data centers in the region. Europe is next ranked for growth due to the significance of the all flash arrays in the industry verticals with an all-encompassing growth for the industry. Across Europe, all flash array is expected to yield 22.4% revenue in 2025.
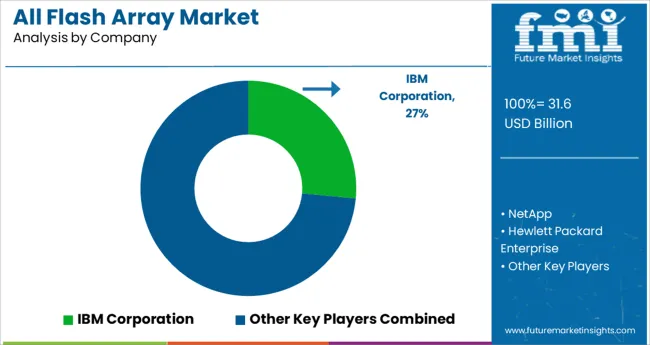
Some of the key participants present in the global all flash arrays market include IBM Corporation, NetApp., Hewlett Packard Enterprise, Dell Inc., Hitachi Ltd., Seagate Technology LLC, SanDisk Corporation and Pure Storage, Inc. among others.
Attributed to the presence of such high number of participants, the market is highly competitive. While global players such as IBM Corporation and NetApp, Inc. account for a considerable market size, several regional level players are also operating across key growth regions.
| Report Attribute | Details |
|---|---|
| Growth Rate | CAGR of 15.4% from 2025 to 2035 |
| Market Value in 2025 | USD 20,545 Million |
| Market Value in 2035 | USD 85,990 Million |
| Base Year for Estimation | 2024 |
| Historical Data | 2020 to 2024 |
| Forecast Period | 2025 to 2035 |
| Quantitative Units | Revenue in million and CAGR from 2025 to 2035 |
| Report Coverage | Revenue Forecast, Volume Forecast, Company Ranking, Competitive Landscape, Growth Factors, Trends and Pricing Analysis |
| Segments Covered | Storage System, Enterprise, Vertical, Region |
| Regions Covered | North America; Latin America; Europe; Asia Pacific; Middle East and Africa |
| Key Countries Profiled | USA, Canada, Brazil, Mexico, Germany, UK, France, Spain, Italy, China, Japan, South Korea, Malaysia, Singapore, Australia, New Zealand, GCC, South Africa, Israel |
| Key Companies Profiled | IBM Corporation; NetApp.; Hewlett Packard Enterprise; Dell Inc.; Hitachi Ltd.; Seagate Technology LLC; SanDisk Corporation; Pure Storage, Inc. |
| Customization | Available Upon Request |
The global all flash array market is estimated to be valued at USD 31.6 billion in 2025.
It is projected to reach USD 132.2 billion by 2035.
The market is expected to grow at a 15.4% CAGR between 2025 and 2035.
The key product types are storage area network, direct-attached storage, network-attached storage, cloud storage, unified storage and software-defined storage.
large scale enterprises segment is expected to dominate with a 61.4% industry share in 2025.


Our Research Products

The "Full Research Suite" delivers actionable market intel, deep dives on markets or technologies, so clients act faster, cut risk, and unlock growth.

The Leaderboard benchmarks and ranks top vendors, classifying them as Established Leaders, Leading Challengers, or Disruptors & Challengers.

Locates where complements amplify value and substitutes erode it, forecasting net impact by horizon

We deliver granular, decision-grade intel: market sizing, 5-year forecasts, pricing, adoption, usage, revenue, and operational KPIs—plus competitor tracking, regulation, and value chains—across 60 countries broadly.

Spot the shifts before they hit your P&L. We track inflection points, adoption curves, pricing moves, and ecosystem plays to show where demand is heading, why it is changing, and what to do next across high-growth markets and disruptive tech

Real-time reads of user behavior. We track shifting priorities, perceptions of today’s and next-gen services, and provider experience, then pace how fast tech moves from trial to adoption, blending buyer, consumer, and channel inputs with social signals (#WhySwitch, #UX).

Partner with our analyst team to build a custom report designed around your business priorities. From analysing market trends to assessing competitors or crafting bespoke datasets, we tailor insights to your needs.
Supplier Intelligence
Discovery & Profiling
Capacity & Footprint
Performance & Risk
Compliance & Governance
Commercial Readiness
Who Supplies Whom
Scorecards & Shortlists
Playbooks & Docs
Category Intelligence
Definition & Scope
Demand & Use Cases
Cost Drivers
Market Structure
Supply Chain Map
Trade & Policy
Operating Norms
Deliverables
Buyer Intelligence
Account Basics
Spend & Scope
Procurement Model
Vendor Requirements
Terms & Policies
Entry Strategy
Pain Points & Triggers
Outputs
Pricing Analysis
Benchmarks
Trends
Should-Cost
Indexation
Landed Cost
Commercial Terms
Deliverables
Brand Analysis
Positioning & Value Prop
Share & Presence
Customer Evidence
Go-to-Market
Digital & Reputation
Compliance & Trust
KPIs & Gaps
Outputs
Full Research Suite comprises of:
Market outlook & trends analysis
Interviews & case studies
Strategic recommendations
Vendor profiles & capabilities analysis
5-year forecasts
8 regions and 60+ country-level data splits
Market segment data splits
12 months of continuous data updates
DELIVERED AS:
PDF EXCEL ONLINE
Flash Calling Authentication Market Size and Share Forecast Outlook 2025 to 2035
BGA Packaging Market Insights – Size, Demand & Growth through 2034
Flash-based Arrays Market Insights - Trends & Growth Forecast 2025 to 2035
Electronically Scanned Arrays System Market Size and Share Forecast Outlook 2025 to 2035
All Electric Box Truck Market Size and Share Forecast Outlook 2025 to 2035
Flash LED Driver ICs Market Size and Share Forecast Outlook 2025 to 2035
All Electric Multipurpose Goods Vehicle Market Forecast and Outlook 2025 to 2035
Allergy Diagnostic Market Forecast and Outlook 2025 to 2035
Allergy Tester Market Size and Share Forecast Outlook 2025 to 2035
Allyl Chloride Market Size and Share Forecast Outlook 2025 to 2035
Flash Point Tester Market Size and Share Forecast Outlook 2025 to 2035
All-in-One LC Adapters Market Size and Share Forecast Outlook 2025 to 2035
All-In-One Under Sink Water Purifier Market Size and Share Forecast Outlook 2025 to 2035
Allergy Immunotherapy Market Analysis - Size, Share & Forecast 2025 to 2035
Allergen-Free Food Market Analysis - Size, Share, and Forecast Outlook 2025 to 2035
Allura Red AC Market Analysis - Size, Share, and Forecast Outlook 2025 to 2035
Allantoin Extract for Skincare Products Market Analysis – Trends, Growth & Forecast 2025 to 2035
Allogeneic T Cell Therapies Market - Trends, Growth & Forecast 2025 to 2035
Allen Key Market Growth - Trends & Forecast 2025 to 2035
Market Share Breakdown of Allergy Immunotherapy Providers

Thank you!
You will receive an email from our Business Development Manager. Please be sure to check your SPAM/JUNK folder too.
Chat With
MaRIA