Allura Red AC Market Size, Share, and Forecast Outlook 2025 to 2035

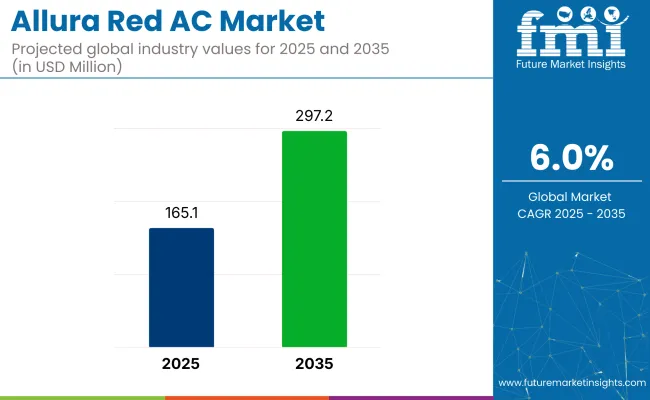
The global allura red ac market was valued at USD 140.0 million in 2022, growing at 5.2% in 2024 and expected to reach USD 165.1 million by 2025. The industry is projected to expand at a 6.0% CAGR during 2025 to 2035, totaling USD 297.2 million by 2035.
Quick Stats of Allura Red AC Market

  • Market Value (2025): USD 165.1 million
  • Forecast Value (2035): USD 297.2 million
  • Forecast CAGR: 6.0%
  • Leading Product Type: Dyes (80% industry share)
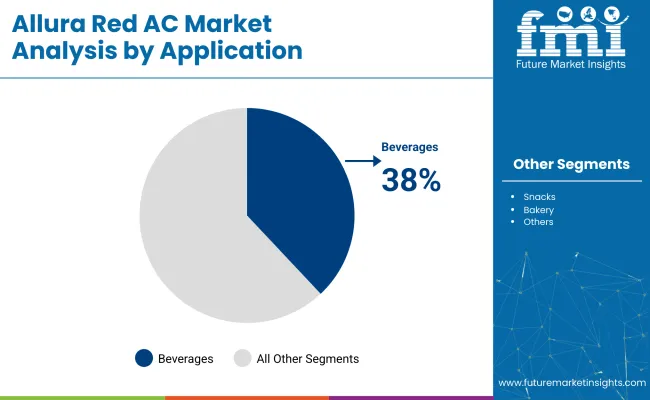
  • Top Application Segment: Beverages (38% share)
  • Key Growth Region: India (fastest-growing industry with 5.8% CAGR)
  • Leading Player: SensientColors LLC. 20-25 % Industry Share

Allura Red Ac Market

Used extensively in food and beverage industries, allura red ac adds vibrant red hues to products like confectionery, soft drinks, pastries, and processed snacks, especially appealing to children and young adults. Companies like Sensient Technologies and Dynemic Products focus on enhancing production efficiency while meeting regulatory standards to ensure product consistency and safety.

The allura red ac industry is heavily concentrated in the food and beverage sector, which accounts for approximately 65-70% of total demand. This includes its use in confectionery, soft drinks, flavored dairy, and bakery products. The cosmetics and personal care segment indicate about 10% of the market, where the dye is used in lipsticks, creams, and shampoos.

Pharmaceuticals contribute another 8-10%, mainly in tablet coatings and syrups. The animal feed sector holds a modest 5-7% share, while industrial applications, such as textiles and inks, account for the remaining 5-8%. This distribution reflects the strong regulatory acceptance of allura red ac in consumables and its limited, but strategic, presence in non-food sectors.

Ramon Laguarta, CEO of PepsiCo, confirmed the company’s ongoing efforts to remove artificial colors from its products. “As we continue to evolve our product portfolio, over 60% of our USA food lineup is now free from artificial colors. Brands like Lay’s and Tostitos will complete the phase-out by the end of this year, reflecting our commitment to aligning with consumer demand for cleaner, more natural ingredients,” Laguarta stated.

The shift toward specialty formulations to meet industry-specific demands, such as improved solubility in beverages and stability in bakery products, is driving growth in the allura red ac segment. To combat increasing regulatory scrutiny and consumer pushback against artificial coloring, companies are focusing on transparency in labeling and adherence to regulated usage levels.

Analysis of Allura Red AC Market by Top Segments

The industry in 2025 will be driven by dyes holding 80% share and food-grade formulations accounting for 50%. Beverage applications will lead usage, while cans dominate packaging with a 55% share. Hypermarkets and supermarkets signify 60% of distribution. Growth is supported by regulatory approvals and steady demand in processed food and drink sectors.

Dyes Lead Product Demand

Dyes are projected to account for nearly 80% of the allura red ac product segment in 2025, supported by steady consumption in soft drinks, fruit syrups, and flavored dairy. FMCG producers in the United States, Germany, and India continue to standardize synthetic dyes due to cost-efficiency and regulatory allowances.
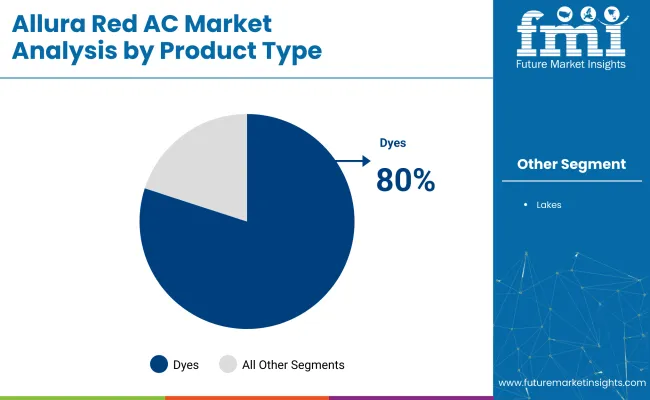
  • Lakes are expected to retain a 20% share, used in dry mix formulations, seasoning blends, and powdered confectionery where oil dispersibility is required.
  • According to Codex Alimentarius standards, dyes are preferred in liquid products due to their higher solubility index and broader temperature tolerance.
  • Demand concentration remains highest in APAC and North America, where beverages make up over 60% of colored food consumption.

Allura Red Ac Market Analysis By Product Type

Food Grade Dominates the Grade Segment

The food grade allura red ac is expected to hold 50% of the industry share in 2025, driven by its use in packaged foods, bakery coatings, jellies, and dessert toppings. Products compliant with FDA, EFSA, and FSSAI approvals have lower entry barriers and broader distribution opportunities.

  • Pharmaceutical grade applications, accounting for 25%, are mainly in chewable tablets, capsules, and paediatric syrups where color enhances differentiation.
  • Feed grade use stands at 15%, particularly in aqua feed and poultry premixes across ASEAN and LATAM countries.
  • Food-grade colors must comply with regional specifications such as E129 (EU) or FD\&C Red 40 (US), which are aligned for cross-border export channels.

Beverages Drive the Application Segment

The beverage segment is anticipated to generate 38% of allura red ac’s demand in 2025. This segment comprises carbonated soft drinks, flavored waters, energy drinks, and sports beverages. The United States beverage sector alone accounts for 42% of synthetic colorant imports, led by demand for visual branding and flavor alignment.
  • Flavored milk, dairy-based drinks, and shelf-stable juices are additional users, especially in Middle Eastern and African markets.
  • Candy and confectionery segments, contributing around 24%, use allura red ac in gummies, hard candies, and fillings.
  • In Japan and South Korea, beverage innovation tied to youth-targeted branding continues to pull synthetic colors despite market-level regulatory scrutiny.

Allura Red Ac Market By Application

Cans Lead Packaging Type Segment

Cans are projected to secure 55% of allura red ac packaging demand in 2025, due to their compatibility with carbonated beverage formats. Lightweight aluminum offers a low-reactivity surface that reduces pigment degradation, extending shelf life in tropical regions.

  • Glass bottles will cover 30%, used mostly in wine coolers, sodas, and imported drinks targeted at premium consumers in EU and North America.
  • Plastic containers hold a 15% share, popular among local and regional drink manufacturers across India and Indonesia.
  • Data from the Can Manufacturers Institute suggests that 70% of carbonated drinks in the USA are packaged in aluminum due to recyclability and unit cost benefits.

Hypermarkets and Supermarkets Lead Distribution Channels

Hypermarkets and supermarkets are expected to capture the 60% of allura red ac’s distribution share in 2025. Retail chains such as Walmart, Carrefour, and Big Bazaar prioritize visual merchandising, which boosts off-the-shelf movement of color-enhanced products.

  • E-commerce platforms, contributing 20%, are expanding reach for specialty and imported food and drink products. Amazon and JD.com report a 15-18% YoY rise in food additive orders across key APAC cities.
  • Wholesale and specialty retailers make up the balance of 20%, with key operators such as Costco, METRO, and Horeca suppliers stocking allura red ac-containing items in bulk for B2B buyers.
  • Barcode-based traceability in retail ensures regulatory compliance, helping food companies maintain batch-level quality control of dyed products.

Top Allura Red AC Market Dynamics

Allura Red AC experiences growth due to expanding food and beverage applications, increased regulatory scrutiny on additives, and innovation by key manufacturers. Rising consumer preference challenges purity standards, while industry leaders introduce cleaner, high performance formulations.

Recent Industry trends and innovations by key players

  • Chemical companies have introduced purer Allura Red AC variants with improved color stability under light and heat.
  • Producers are expanding into beverage and confectionery sectors, leveraging Allura Red AC for vivid coloring in lowacid environments.
  • Packaginggrade versions optimized for shelf life are emerging to support long distance logistics.
  • Formulators are blending red 40 with natural dyes to meet evolving cleanlabel demands.
  • R&D teams are developing micro encapsulation technology to prevent dye fading during processing.

Frictions Slowing Allura Red AC’s Commercial Momentum
  • Regulatory variations across regions complicate global formulation strategies.
  • Consumer skepticism around artificial colorants pressures manufacturers to justify red 40 usages.
  • Competition from plant based alternatives forces innovation in performance and labeling.

Top Countries Manufacturing, Synthesizing, Distributing, and Generating Demand for Allura Red AC

Country Wise Analysis Of Allura Red Ac Market Cagr 2025 To 2035

Countries CAGR (2025 to 2035)
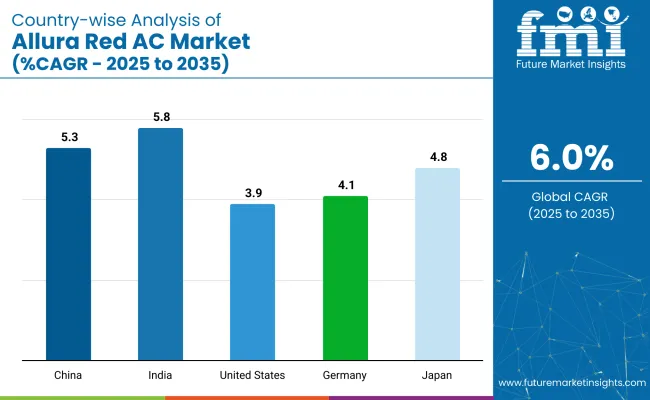
United States 3.9%
China 5.3%
India 5.8%
Germany 4.1%
Japan 4.8%

India’s momentum is driven by the expanding processed food and beverage industries, alongside rising demand for vibrant food products. China follows closely, with a projected 5.3% CAGR, supported by its growing food production sector and increasing demand for food additives. In contrast, developed economies such as Japan (4.8%), Germany (4.1%), and the United States (3.9%) are expanding at a steady 0.95-1.03x rate.

The United States leads the demand for allura red ac, driven by the growing popularity of artificial food coloring in the food and beverage sectors. Japan focuses on high-quality additives for vibrant food products, while Germany and the United States benefit from steady demand in both the food and beverage industries. The industry adds significant value by 2035, both high-growth regions like India and China, and stable demand from OECD countries will shape its trajectory.

The report covers detailed analysis of 40+ countries, with the top five countries shared as a reference.

An Overview of USA Synthetic Red Dye Market Growth

The allura red ac industry in the United States is expected to grow at a CAGR of 3.9% between 2025 and 2035. While consumer preference increasingly shifts toward natural food colors, synthetic dyes such as allura red ac remain widely used due to their cost-efficiency and color stability. The USA Food and Drug Administration (FDA) enforces strict controls, especially in beverages, confectionery, and over-the-counter pharmaceuticals.

  • Allura red ac is used in powdered drink mixes, value-tier desserts, and low-cost condiments.
  • Pharmaceutical applications include film-coated tablets and chewable formulations.
  • Regional school nutrition programs are initiating reformulations, reducing dye content in institutional meals.

China Red 40 Market Analysis and Growth

The industry in China is forecast to expand at a CAGR of 5.3% from 2025 to 2035, driven by demand from domestic processed food sectors. With fewer regulatory hurdles compared to OECD nations, synthetic dyes are used extensively in beverage concentrates, packaged snacks, and dairy-based products.

  • Usage is common in children-targeted products like jelly cups and ice-based snacks.
  • Allura red ac blends with tartrazine to achieve enhanced visual appeal in soft drinks.
  • Home baking kits and direct-to-consumer dye products are gaining traction via online platforms.

India Synthetic Red 40 Market Analysis and Growth

The industry in India is set to grow at a CAGR of 5.8% from 2025 to 2035, the highest among the analyzed countries. Broad consumption across traditional sweets, instant foods, and street beverages continues to support volume expansion. The Food Safety and Standards Authority of India (FSSAI) regulates permitted limits, but synthetic dye penetration remains high in cost-sensitive regions.

  • High-volume use occurs in festive-season sweets and regional mithai across Tier 2 and Tier 3 cities.
  • Synthetic colors are preferred in falooda, flavored ices, and slush-based refreshments.
  • Regional brands enhance product shelf appeal by intensifying red shades in sauces and snacks.

In-Depth Analysis of Germany Synthetic Food Dye Usage

Germany’s allura red ac industry is projected to grow at a CAGR of 4.1% through 2035. The European Union’s tight food additive regulations restrict synthetic dye use, but budget-tier applications persist. Demand is concentrated in discount private-label products, flavored processed meats, and imported confectionery.

  • Discount retailers incorporate Red 40 in low-cost candies and jellies.
  • Permitted use cases include paprika-flavored meat snacks under defined additive limits.
  • Intra-EU imports from Eastern Europe help sustain dye availability in lower price bands.

An Overview of Japan Color Additive Market Growth

The red40 industry in Japan is forecast to expand at a CAGR of 4.8% from 2025 to 2035. Although consumer sentiment in Japan leans toward natural food colors, synthetic dyes remain permitted in approved food categories under guidelines from Japan’s Ministry of Health, Labour and Welfare.

  • Synthetic colorants remain prevalent in instant ramen seasoning packets and processed curry meals.
  • The red 40 continues to be used in character-themed confections and anime-branded candy lines.
  • Hotel chains and foodservice operators apply it in bulk desserts to achieve uniform appearance and stability.

Leading Allura Red AC Suppliers

Leading Player -Sensient Colors LLC. Holding 20-25% Industry Share
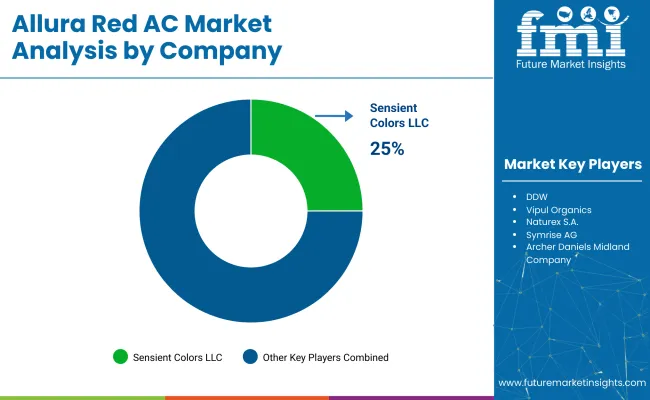
Allura Red Ac Market Analysis By Company

The industry is shaped by both well-established players and new entrants, with key industry leaders such as Archer Daniels Midland, Sensient Colors, and Symrise driving growth through continuous innovation and diverse product portfolios. R&D investments are a primary focus, as seen in Symrise’s launch of new natural colorants aimed at meeting the increasing demand for clean-label products.

Companies like DIC Corporation and Chr. Hansen have expanded their global presence, with DIC’s acquisition of BASF’s colorants division further consolidating its standing. Despite the dominance of major players, the sector remains fragmented, with numerous smaller companies competing for market share.

High capital investment, complex regulatory requirements, and the demand for consistent innovation create significant entry barriers within the red 40 sector. Companies face ongoing pressure to meet stringent food safety standards while addressing evolving consumer preferences for natural and plant-based products. The competitive environment demands that both established companies and emerging players prioritize continuous product development and strategic partnerships to maintain the industry position.

Recent Allura Red AC Industry news

  • In February 2024, Chr. Hansen upgraded its Denmark facility to enhance the synthesis efficiency of Red 40 blends, aiming to reduce solvent usage and improve batch yields.
  • In April 2024, KoelColours Pvt. Ltd. expanded its distribution networks in India, Nigeria, and Mexico, leading to a 12% increase in red 40 sales among small and medium food producers.

Allura Red AC Market - Report Scope

Report Attributes Details
Industry Size (2025) USD 165.1 million
Projected Market Size (2035) USD 297.2 million
CAGR (2025 to 2035) 6%
Base Year for Estimation 2024
Historical Period 2020 to 2024
Projections Period 2025 to 2035
Quantitative Units USD million for value
Types Analyzed Dyes, Lakes
Grades Analyzed Food Grade, Pharmaceutical Grade, Feed Grade, Industrial Grade
Applications Analyzed Beverage, Bakery, Snacks and Cereals, Candy/Confectionery, Dairy, Fruit Preparations/Fillings, Meat, Poultry, Fish, and Eggs, Potatoes, Pasta and Rice, Sauces, Soups, and Dressings, Seasonings, Pet Food, Others
Packaging Types Analyzed Cans, Glass Bottles, Others
Distribution Channels Analyzed HoReCa (Hotels, Restaurants, Cafés), Cafés, Bakeries & Patisseries, Hypermarkets / Supermarkets, Convenience Stores, Wholesale Stores, Online Retail
Regions Covered North America, Latin America, Western Europe, Eastern Europe, Balkans & Baltic, Russia & Belarus, Central Asia, East Asia, South Asia & Pacific, Middle East & Africa
Countries Covered United States, Canada, Brazil, Mexico, Germany, France, United Kingdom, Italy, Spain, China, Japan, South Korea, India, Australia, UAE, South Africa
Key Players Archer Daniels Midland Company, Allied Biotech Corporation, Sensient Colors LLC, Symrise AG, Chr. Hansen Holding A/S, DIC Corporation (BASF SE), BioconColors, DSM, DDW, Vipul Organics, Naturex S.A., San- Ei Gen F.F.I., Inc., Others
Additional Attributes Dollar sales growth by application (beverages, confectionery), regional demand trends, competitive landscape, pricing strategies, distribution channel insights, product innovation, regulatory landscape, and application-specific growth drivers.

Leading Players

  • Archer Daniels Midland Company
  • Allied Biotech Corporation
  • Sensient Colors LLC.
  • Symrise AG
  • Chr. Hansen Holding A/S
  • DIC Corporation (BASF SE)
  • BioconColors; DSM
  • DDW
  • Vipul Organics
  • Naturex S.A.
  • San-Ei Gen F.F.I., Inc.
  • Others

Allura Red AC Market Analyzed by Key Investment Segments 

By Type:

DyesandLakes.

By Grade:

Food Grade, Pharmaceutical Grade, Feed Grade, and Industrial Grade.

By Application:

Beverage, Bakery, Snacks, and Cereals, Candy/Confectionery, Dairy, Fruit Preparations/Fillings, Meat, Poultry, Fish, and Eggs, Potatoes, Pasta, and Rice, Sauces, Soups, and Dressings, Seasonings, Pet Food, and Others.

By Packaging Type:

Cans, Glass Bottles, andOthers.

By Distribution Channel:

HoReCa (Hotels, Restaurants, and Cafés), Cafés, Bakeries & Patisseries, Hypermarkets / Supermarkets, Convenience Stores, Wholesale Stores, and Online Retail.

By Region:

North America, Latin America, Western Europe, Eastern Europe, Balkans & Baltic, Russia & Belarus, Central Asia, East Asia, South Asia & Pacific, and theMiddle East & Africa.

Table of Content

  1. Executive Summary
  2. Industry Introduction, including Taxonomy and Market Definition
  3. Trends and Success Factors, including Macro-economic Factors, Market Dynamics, and Recent Industry Developments
  4. Global Market Demand Analysis 2020 to 2024 and Forecast 2025 to 2035, including Historical Analysis and Future Projections
  5. Pricing Analysis
  6. Global Market Analysis 2020 to 2024 and Forecast 2025 to 2035
    • Type
    • grade
    • Application
  7. Global Market Analysis 2020 to 2024 and Forecast 2025 to 2035, By Type
    • Dyes
    • Lakes
    • By grade
    • Food Grade
    • Pharmaceutical Grade
    • Feed Grade
    • Industrial Grade
  8. Global Market Analysis 2020 to 2024 and Forecast 2025 to 2035, By Application
    • Beverage
    • Bakery, Snacks, and Cereals
    • Candy/ Confectionery
    • Dairy
    • Fruit Preparations/ Fillings
    • Meat, Poultry, Fish, and Eggs
    • Potatoes, Pasta, and Rice
    • Sauces, Soups, and Dressings
    • Seasonings
    • Pet Food
    • Others
  9. Global Market Analysis 2020 to 2024 and Forecast 2025 to 2035, By Region
    • North America
    • Latin America
    • Western Europe
    • Eastern Europe
    • East Asia
    • South Asia & Pacific
    • Central Asia
    • Russia and Belarus
    • Balkan & Baltic Countries
    • Middle East and Africa
  10. North America Sales Analysis 2020 to 2024 and Forecast 2025 to 2035, by Key Segments and Countries
  11. Latin America Sales Analysis 2020 to 2024 and Forecast 2025 to 2035, by Key Segments and Countries
  12. Western Europe Sales Analysis 2020 to 2024 and Forecast 2025 to 2035, by Key Segments and Countries
  13. Eastern Europe Sales Analysis 2020 to 2024 and Forecast 2025 to 2035, by Key Segments and Countries
  14. East Asia Sales Analysis 2020 to 2024 and Forecast 2025 to 2035, by Key Segments and Countries
  15. South Asia & Pacific Sales Analysis 2020 to 2024 and Forecast 2025 to 2035, by Key Segments and Countries
  16. Central Asia Sales Analysis 2020 to 2024 and Forecast 2025 to 2035, by Key Segments and Countries
  17. Russia and Belarus Sales Analysis 2020 to 2024 and Forecast 2025 to 2035, by Key Segments and Countries
  18. Balkan & Baltic Countries Sales Analysis 2020 to 2024 and Forecast 2025 to 2035, by Key Segments and Countries
  19. Middle East and Africa Sales Analysis 2020 to 2024 and Forecast 2025 to 2035, by Key Segments and Countries
  20. Sales Forecast to 2035 by Type, grade, and Application for 30 Countries
  21. Competitive Assessment, Company Share Analysis by Key Players, and Competition Dashboard
  22. Company Profile
    • Archer Daniels Midland Company
    • Allied Biotech Corporation
    • Sensient Colors LLC.
    • Symrise AG
    • Chr. Hansen Holding A/S
    • DIC Corporation (BASF SE)
    • BioconColors; DSM
    • DDW
    • Vipul Organics
    • Naturex S.A.

List of Tables

  • Table 1: Global Market Value (USD Million) & Volume(Mt) Forecast by Region, 2020 to 2035
  • Table 2: Global Market Value (USD Million) & Volume(Mt) Forecast by Type, 2020 to 2035
  • Table 3: Global Market Value (USD Million) & Volume(Mt) Forecast by grade, 2020 to 2035
  • Table 4: Global Market Value (USD Million) & Volume(Mt) Forecast by Application, 2020 to 2035
  • Table 5: North America Market Value (USD Million) & Volume(Mt) Forecast by Country, 2020 to 2035
  • Table 6: North America Market Value (USD Million) & Volume(Mt) Forecast by Type, 2020 to 2035
  • Table 7: North America Market Value (USD Million) & Volume(Mt) Forecast by grade, 2020 to 2035
  • Table 8: North America Market Value (USD Million) & Volume(Mt) Forecast by Application, 2020 to 2035
  • Table 9: Latin America Market Value (USD Million) & Volume(Mt) Forecast by Country, 2020 to 2035
  • Table 10: Latin America Market Value (USD Million) & Volume(Mt) Forecast by Type, 2020 to 2035
  • Table 11: Latin America Market Value (USD Million) & Volume(Mt) Forecast by grade, 2020 to 2035
  • Table 12: Latin America Market Value (USD Million) & Volume(Mt) Forecast by Application, 2020 to 2035
  • Table 13: Western Europe Market Value (USD Million) & Volume(Mt) Forecast by Country, 2020 to 2035
  • Table 14: Western Europe Market Value (USD Million) & Volume(Mt) Forecast by Type, 2020 to 2035
  • Table 15: Western Europe Market Value (USD Million) & Volume(Mt) Forecast by grade, 2020 to 2035
  • Table 16: Western Europe Market Value (USD Million) & Volume(Mt) Forecast by Application, 2020 to 2035
  • Table 17: Eastern Europe Market Value (USD Million) & Volume(Mt) Forecast by Country, 2020 to 2035
  • Table 18: Eastern Europe Market Value (USD Million) & Volume(Mt) Forecast by Type, 2020 to 2035
  • Table 19: Eastern Europe Market Value (USD Million) & Volume(Mt) Forecast by grade, 2020 to 2035
  • Table 20: Eastern Europe Market Value (USD Million) & Volume(Mt) Forecast by Application, 2020 to 2035
  • Table 21: East Asia Market Value (USD Million) & Volume(Mt) Forecast by Country, 2020 to 2035
  • Table 22: East Asia Market Value (USD Million) & Volume(Mt) Forecast by Type, 2020 to 2035
  • Table 23: East Asia Market Value (USD Million) & Volume(Mt) Forecast by grade, 2020 to 2035
  • Table 24: East Asia Market Value (USD Million) & Volume(Mt) Forecast by Application, 2020 to 2035
  • Table 25: South Asia & Pacific Market Value (USD Million) & Volume(Mt) Forecast by Country, 2020 to 2035
  • Table 26: South Asia & Pacific Market Value (USD Million) & Volume(Mt) Forecast by Type, 2020 to 2035
  • Table 27: South Asia & Pacific Market Value (USD Million) & Volume(Mt) Forecast by grade, 2020 to 2035
  • Table 28: South Asia & Pacific Market Value (USD Million) & Volume(Mt) Forecast by Application, 2020 to 2035
  • Table 29: Central Asia Market Value (USD Million) & Volume(Mt) Forecast by Country, 2020 to 2035
  • Table 30: Central Asia Market Value (USD Million) & Volume(Mt) Forecast by Type, 2020 to 2035
  • Table 31: Central Asia Market Value (USD Million) & Volume(Mt) Forecast by grade, 2020 to 2035
  • Table 32: Central Asia Market Value (USD Million) & Volume(Mt) Forecast by Application, 2020 to 2035
  • Table 33: Russia and Belarus Market Value (USD Million) & Volume(Mt) Forecast by Country, 2020 to 2035
  • Table 34: Russia and Belarus Market Value (USD Million) & Volume(Mt) Forecast by Type, 2020 to 2035
  • Table 35: Russia and Belarus Market Value (USD Million) & Volume(Mt) Forecast by grade, 2020 to 2035
  • Table 36: Russia and Belarus Market Value (USD Million) & Volume(Mt) Forecast by Application, 2020 to 2035
  • Table 37: Balkan & Baltic Countries Market Value (USD Million) & Volume(Mt) Forecast by Country, 2020 to 2035
  • Table 38: Balkan & Baltic Countries Market Value (USD Million) & Volume(Mt) Forecast by Type, 2020 to 2035
  • Table 39: Balkan & Baltic Countries Market Value (USD Million) & Volume(Mt) Forecast by grade, 2020 to 2035
  • Table 40: Balkan & Baltic Countries Market Value (USD Million) & Volume(Mt) Forecast by Application, 2020 to 2035
  • Table 41: Middle East and Africa Market Value (USD Million) & Volume(Mt) Forecast by Country, 2020 to 2035
  • Table 42: Middle East and Africa Market Value (USD Million) & Volume(Mt) Forecast by Type, 2020 to 2035
  • Table 43: Middle East and Africa Market Value (USD Million) & Volume(Mt) Forecast by grade, 2020 to 2035
  • Table 44: Middle East and Africa Market Value (USD Million) & Volume(Mt) Forecast by Application, 2020 to 2035

List of Figures

  • Figure 1: Global Market Value Share (%), Growth Rate (Y-o-Y), and Value (USD Million) & Volume(Mt) Projection by Type, 2020 to 2035
  • Figure 2: Global Market Value Share (%), Growth Rate (Y-o-Y), and Value (USD Million) & Volume(Mt) Projection by grade, 2020 to 2035
  • Figure 3: Global Market Value Share (%), Growth Rate (Y-o-Y), and Value (USD Million) & Volume(Mt) Projection by Application, 2020 to 2035
  • Figure 4: Global Market Value Share (%), Growth Rate (Y-o-Y), and Value (USD Million) & Volume(Mt) Projection by Region, 2020 to 2035
  • Figure 5: North America Market Value Share (%), Growth Rate (Y-o-Y), and Value (USD Million) & Volume(Mt) Projection by Type, 2020 to 2035
  • Figure 6: North America Market Value Share (%), Growth Rate (Y-o-Y), and Value (USD Million) & Volume(Mt) Projection by grade, 2020 to 2035
  • Figure 7: North America Market Value Share (%), Growth Rate (Y-o-Y), and Value (USD Million) & Volume(Mt) Projection by Application, 2020 to 2035
  • Figure 8: North America Market Value Share (%), Growth Rate (Y-o-Y), and Value (USD Million) & Volume(Mt) Projection by Country, 2020 to 2035
  • Figure 9: Latin America Market Value Share (%), Growth Rate (Y-o-Y), and Value (USD Million) & Volume(Mt) Projection by Type, 2020 to 2035
  • Figure 10: Latin America Market Value Share (%), Growth Rate (Y-o-Y), and Value (USD Million) & Volume(Mt) Projection by grade, 2020 to 2035
  • Figure 11: Latin America Market Value Share (%), Growth Rate (Y-o-Y), and Value (USD Million) & Volume(Mt) Projection by Application, 2020 to 2035
  • Figure 12: Latin America Market Value Share (%), Growth Rate (Y-o-Y), and Value (USD Million) & Volume(Mt) Projection by Country, 2020 to 2035
  • Figure 13: Western Europe Market Value Share (%), Growth Rate (Y-o-Y), and Value (USD Million) & Volume(Mt) Projection by Type, 2020 to 2035
  • Figure 14: Western Europe Market Value Share (%), Growth Rate (Y-o-Y), and Value (USD Million) & Volume(Mt) Projection by grade, 2020 to 2035
  • Figure 15: Western Europe Market Value Share (%), Growth Rate (Y-o-Y), and Value (USD Million) & Volume(Mt) Projection by Application, 2020 to 2035
  • Figure 16: Western Europe Market Value Share (%), Growth Rate (Y-o-Y), and Value (USD Million) & Volume(Mt) Projection by Country, 2020 to 2035
  • Figure 17: Eastern Europe Market Value Share (%), Growth Rate (Y-o-Y), and Value (USD Million) & Volume(Mt) Projection by Type, 2020 to 2035
  • Figure 18: Eastern Europe Market Value Share (%), Growth Rate (Y-o-Y), and Value (USD Million) & Volume(Mt) Projection by grade, 2020 to 2035
  • Figure 19: Eastern Europe Market Value Share (%), Growth Rate (Y-o-Y), and Value (USD Million) & Volume(Mt) Projection by Application, 2020 to 2035
  • Figure 20: Eastern Europe Market Value Share (%), Growth Rate (Y-o-Y), and Value (USD Million) & Volume(Mt) Projection by Country, 2020 to 2035
  • Figure 21: East Asia Market Value Share (%), Growth Rate (Y-o-Y), and Value (USD Million) & Volume(Mt) Projection by Type, 2020 to 2035
  • Figure 22: East Asia Market Value Share (%), Growth Rate (Y-o-Y), and Value (USD Million) & Volume(Mt) Projection by grade, 2020 to 2035
  • Figure 23: East Asia Market Value Share (%), Growth Rate (Y-o-Y), and Value (USD Million) & Volume(Mt) Projection by Application, 2020 to 2035
  • Figure 24: East Asia Market Value Share (%), Growth Rate (Y-o-Y), and Value (USD Million) & Volume(Mt) Projection by Country, 2020 to 2035
  • Figure 25: South Asia & Pacific Market Value Share (%), Growth Rate (Y-o-Y), and Value (USD Million) & Volume(Mt) Projection by Type, 2020 to 2035
  • Figure 26: South Asia & Pacific Market Value Share (%), Growth Rate (Y-o-Y), and Value (USD Million) & Volume(Mt) Projection by grade, 2020 to 2035
  • Figure 27: South Asia & Pacific Market Value Share (%), Growth Rate (Y-o-Y), and Value (USD Million) & Volume(Mt) Projection by Application, 2020 to 2035
  • Figure 28: South Asia & Pacific Market Value Share (%), Growth Rate (Y-o-Y), and Value (USD Million) & Volume(Mt) Projection by Country, 2020 to 2035
  • Figure 29: Central Asia Market Value Share (%), Growth Rate (Y-o-Y), and Value (USD Million) & Volume(Mt) Projection by Type, 2020 to 2035
  • Figure 30: Central Asia Market Value Share (%), Growth Rate (Y-o-Y), and Value (USD Million) & Volume(Mt) Projection by grade, 2020 to 2035
  • Figure 31: Central Asia Market Value Share (%), Growth Rate (Y-o-Y), and Value (USD Million) & Volume(Mt) Projection by Application, 2020 to 2035
  • Figure 32: Central Asia Market Value Share (%), Growth Rate (Y-o-Y), and Value (USD Million) & Volume(Mt) Projection by Country, 2020 to 2035
  • Figure 33: Russia and Belarus Market Value Share (%), Growth Rate (Y-o-Y), and Value (USD Million) & Volume(Mt) Projection by Type, 2020 to 2035
  • Figure 34: Russia and Belarus Market Value Share (%), Growth Rate (Y-o-Y), and Value (USD Million) & Volume(Mt) Projection by grade, 2020 to 2035
  • Figure 35: Russia and Belarus Market Value Share (%), Growth Rate (Y-o-Y), and Value (USD Million) & Volume(Mt) Projection by Application, 2020 to 2035
  • Figure 36: Russia and Belarus Market Value Share (%), Growth Rate (Y-o-Y), and Value (USD Million) & Volume(Mt) Projection by Country, 2020 to 2035
  • Figure 37: Balkan & Baltic Countries Market Value Share (%), Growth Rate (Y-o-Y), and Value (USD Million) & Volume(Mt) Projection by Type, 2020 to 2035
  • Figure 38: Balkan & Baltic Countries Market Value Share (%), Growth Rate (Y-o-Y), and Value (USD Million) & Volume(Mt) Projection by grade, 2020 to 2035
  • Figure 39: Balkan & Baltic Countries Market Value Share (%), Growth Rate (Y-o-Y), and Value (USD Million) & Volume(Mt) Projection by Application, 2020 to 2035
  • Figure 40: Balkan & Baltic Countries Market Value Share (%), Growth Rate (Y-o-Y), and Value (USD Million) & Volume(Mt) Projection by Country, 2020 to 2035
  • Figure 41: Middle East and Africa Market Value Share (%), Growth Rate (Y-o-Y), and Value (USD Million) & Volume(Mt) Projection by Type, 2020 to 2035
  • Figure 42: Middle East and Africa Market Value Share (%), Growth Rate (Y-o-Y), and Value (USD Million) & Volume(Mt) Projection by grade, 2020 to 2035
  • Figure 43: Middle East and Africa Market Value Share (%), Growth Rate (Y-o-Y), and Value (USD Million) & Volume(Mt) Projection by Application, 2020 to 2035
  • Figure 44: Middle East and Africa Market Value Share (%), Growth Rate (Y-o-Y), and Value (USD Million) & Volume(Mt) Projection by Country, 2020 to 2035

Frequently Asked Questions

What is the projected market size of the allura red AC market in 2025 and 2035?

The industry size is projected to be USD 165.1 million in 2025 and USD 297.2 million by 2035.

What is the expected CAGR for the allura red AC market from 2025 to 2035?

The expected CAGR is 6.0% from 2025 to 2035.

Which product type holds the largest market share in the allura red AC market?

Dyes hold the largest industry share at 80% in 2025.

Who is the leading company in the Allura Red AC Market?

Sensient Colors LLC is the leading company in the industry, holding 20-25% industry share.

What is the projected CAGR of the allura red AC industry in india?

India is the fastest-growing industry with a projected CAGR of 5.8%.

Explore Similar Insights

Future Market Insights

Allura Red AC Market