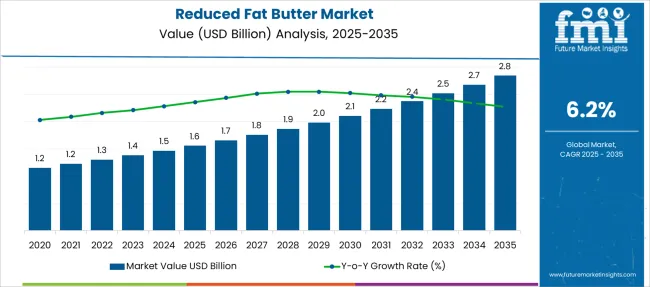
The global reduced Fat Butter Market is expected to reach a market valuation of USD 1.3 Billion by the year 2022, accelerating with a CAGR of 6.2% by 2022 to 2032, to reach a value of 2.37 Billion by 2032.
Reduced fat butter accounted for 10% of the total butter market globally in 2022 and is expected to rise due to consumer inclination towards a healthy lifestyle and the availability of healthy alternatives in the market.
Attribute | Details |
---|---|
Reduced Fat Butter Market Size (2022E) | USD 1.3 Billion |
Reduced Fat Butter Market Projected Size (2032F) | USD 2.37 Billion |
Value CAGR (2022 to 2032) | 6.2% |
Top 3 Countries' Market Share | 35% |
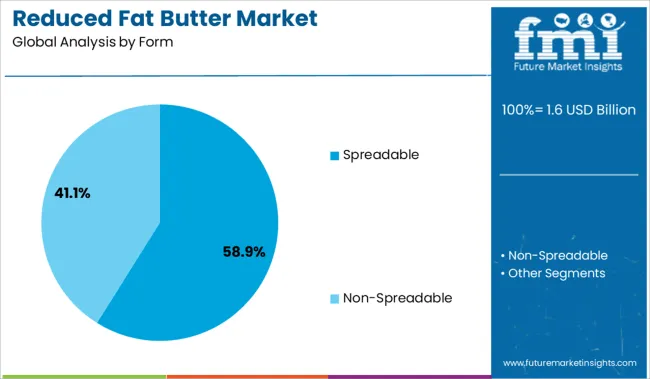
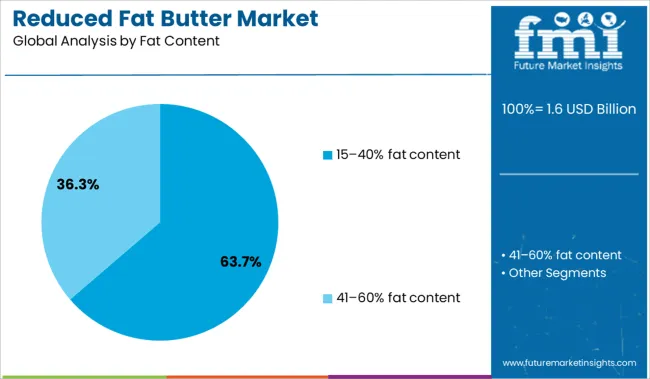
Newly released data from Future Market Insights for reduced fat butter market analysis shows the 15-40% fat content butter form segment grew 5.2%, while the 41-60% fat content butter form segment is expected to be 5.5% in 2022.
Reduced-fat butter is made by cutting the fat level to 40% while maintaining the same flavor and texture as ordinary butter. It contains plant stanols and sterols, which restrict the absorption of harmful cholesterol and help to prevent heart disease.
Reduced fat butter had a CAGR of 5.5% between 2017 and 2021. The period marked heavy investment in research and developmental activities by reduced fat butter market key players.
There has been a considerable increase in the number of consumers that lay special emphasis on healthy eating habits. Consumer inclination towards products that minimize intake of trans-fats and saturated fats to boost body immunity has increased multifold, which in turn increases the reduced fat butter market size.
They are more aware of what goes into producing food products and carefully choose products that provide health benefits in addition to good taste. Companies are investing in developing butter substitutes that have low-fat content, due to which organic reduced-fat butter is in high demand.
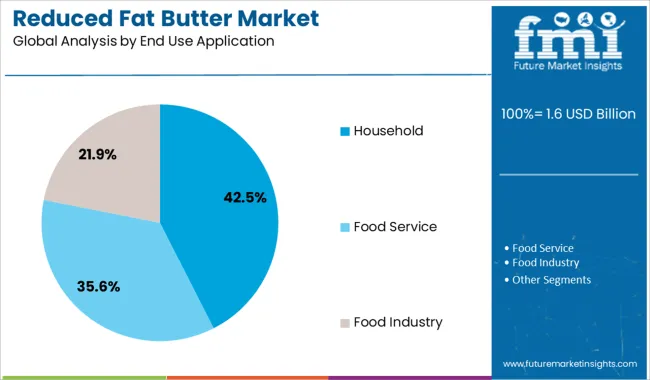
Consumers are on the lookout for products that keep their cholesterol levels in check to avoid any heart ailments. Owing to this reason, demand for reduced-fat butter which does not contain dietary cholesterol and can be used in wide end-use applications like baking cakes, crusts deserts, and vegetables for daily consumption is expected to surge. This enhances the demand for reduced-fat butter in hotels, restaurants, and catering.
The increase of the reduced butter market share is fueled by a surge in various health conditions like obesity, cardiovascular illnesses, diabetes, and the numerous health benefits due to increased intake of reduced fat butter.
Many fast-food outlets are endorsing and frequently incorporating reduced-fat butter on their menus, which has heightened the awareness amongst consumers, further accelerating the expansion of the reduced-fat butter market.
In recent years, the scientific consensus behind food product claims has become more important for enticing customers, and as a result, positive recommendations from the medical community, such as The Dietary Guidelines Committee, have helped the reduced fat butter market flourish.
The World Health Organization claims that the total fat intake should be no more than 30% of the total calories and that the intake of saturated fat should not go beyond 10% of the total calories. This is expected to create many opportunities for the reduced-fat butter market globally.
People have now understood the advantages of consuming a low-fat diet and avoiding the excess energy that gets converted to fat depositions in the body. These factors are expected to positively impact the sales of reduced-fat butter during the assessment period.
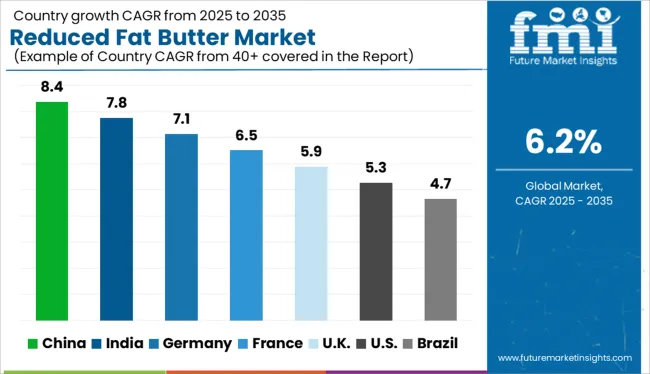
North America is one of the promising regions in the global reduced fat butter market. Due to high consumer spending capacity and emphasis on maintaining a healthy lifestyle by people in countries like the USA, and Canada. Changes in dietary habits like reduction in the consumption of unhealthy fats to boost immunity against infections are expected to increase the sales of reduced-fat butter.
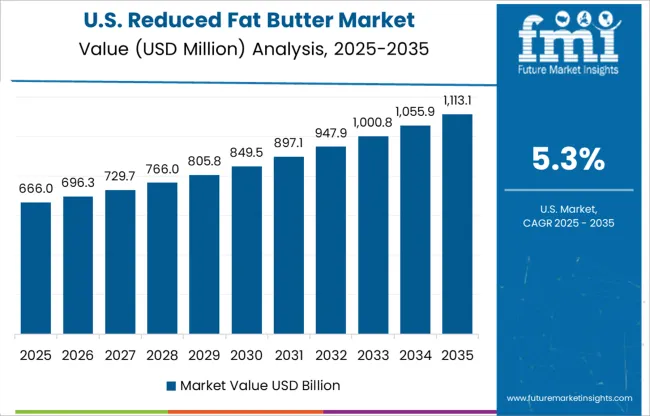
According to FMI, the USA reduced fat butter market is expected to reach a value of about USD 249.6 Million in 2022 which is approximately 24% of the global reduced butter market.
Asia Pacific is expected to generate many opportunities for a reduced fat butter market during the assessment year due to rising awareness of healthy food alternatives among people. Traditionally consumption of fresh butter in households is high.
Top retailers in the reduced-fat butter market are focusing on developing products with low-fat content, and low price points to make them accessible to everyone. As per FMI, the Indian reduced-fat butter market is expected to account for USD 121.5 Million in 2022 which is approximately 17% of the global reduced-butter market.
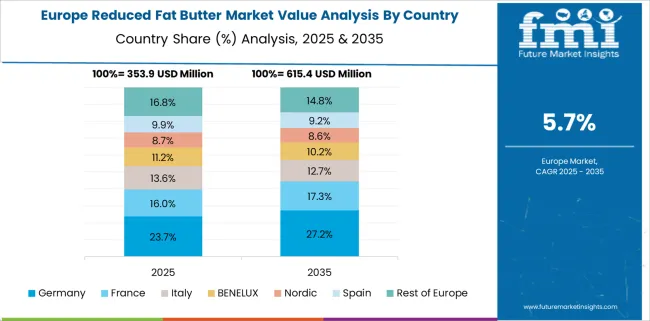
Consumers are increasingly preferring low-fat butter in making daily food products due to rising cases of cardiovascular disease, obesity, and other health-related problems In Europe. They are adopting healthy lifestyles to remain fit.
To satisfy the European reduced-fat butter market need companies are offering a wide variety of butter that are plant-based, vegan, and have significantly low-fat content. Owing to these factors, the demand from regional markets like the United Kingdom, and Germany is expected to surge in the near future.
Carton Packs account for 55% of the total reduced butter market. Different pack sizes ranging from 20gm to 1000 gm are easily available in the market. Consumer inclination towards healthy snacking habits and emphasis on ingredients that are used to produce final products is also expected to register steady growth in the reduced fat butter market share during the forecast period.
Consumers are emphasizing labeling and packaging and are well-informed before making a final purchase. Packaging also plays an important role to maintain the quality of products in transit by prohibiting any reaction with the outer environment. Reduced fat butter market key players are focusing on branding and tamper seals to avoid any mishandling of products.
From 2022 to 2023, the online distribution channel is predicted to grow at a rate of 5.5% and account for 40% of sales. Top companies in the reduced fat butter market are collaborating with online marketplaces such as Amazon and Big Basket.
Their products are displayed on various online portals and company websites to increase product visibility to boost sales of the reduced fat butter market. The online sales channel has made it easy for consumers to choose from reduced fat butter of different brands in different pack sizes and price ranges and choose one suitable for their needs.
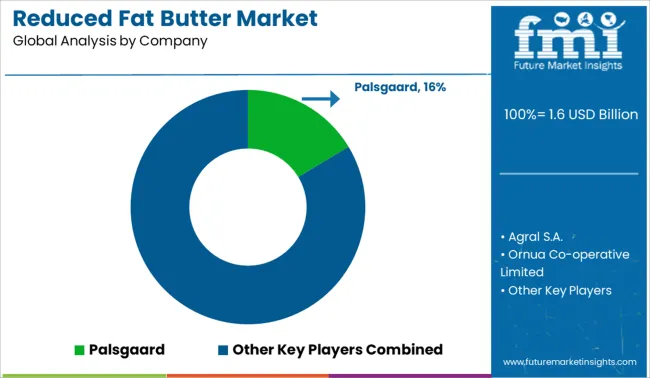
Reduced Fat Butter manufacturers are exploring new technologies that fulfill rising consumer demand for healthy food. Key manufacturers are developing new varieties of butter with varying levels of fat content.
Some of the major key players in the reduced fat butter market are Palsgaard Agral S.A., Ornua Co-operative Limited, Upfield, Finlandia Cheese, Inc., Saputo Dairy Australia Pty Ltd., Kerry Gold, Land O'Lakes, Arla Foods, Lam Soon Group, Aurivo Co-operative Society Ltd., Rockview Farms.
Attribute | Details |
---|---|
Forecast Period | 2022 to 2032 |
Historical Data Available for | 2017 to 2021 |
Market Analysis | USD Million for Value and Million. Sq. M. for Volume |
Key Regions Covered | North America; Latin America; Europe; East Asia; South Asia; and the Middle East & Africa |
Key Countries Covered | USA, Brazil, Mexico, Germany, United Kingdom, China, India, Japan, Australia, and GCC Countries |
Key Segments Covered | Form, Fat Content, End-Use Application, Packaging, Sales Channel, and Region |
Key Companies Profiled | Palsgaard; Agral S.A.; Ornua Co-operative Limited; Upfield; Finlandia Cheese, Inc.; Saputo Dairy Australia Pty Ltd.; Kerry gold; Land O'Lakes; Arla Foods; Lam Soon Group; Aurivo Co-operative Society Ltd.; Rockview Farms |
Report Coverage | Market Forecast, Company Share Analysis, Competition Intelligence, Drivers, Restraints, Opportunities and Threats Analysis, Market Dynamics and Challenges, and Strategic Growth Initiatives |
Customization & Pricing | Available upon Request |
Table 01: Global Market Value (US$ Million) Forecast by Region, 2017 to 2032
Table 02: Global Market Volume (MT) Forecast by Region, 2017 to 2032
Table 03: Global Market Value (US$ Million) Forecast by Form, 2017 to 2032
Table 04: Global Market Volume (MT) Forecast by Form, 2017 to 2032
Table 05: Global Market Value (US$ Million) Forecast by Fat Content, 2017 to 2032
Table 06: Global Market Volume (MT) Forecast by Fat Content, 2017 to 2032
Table 07: Global Market Value (US$ Million) Forecast by End Use Application, 2017 to 2032
Table 08: Global Market Volume (MT) Forecast by End Use Application, 2017 to 2032
Table 09: Global Market Value (US$ Million) Forecast by Packaging, 2017 to 2032
Table 10: Global Market Volume (MT) Forecast by Packaging, 2017 to 2032
Table 11: Global Market Value (US$ Million) Forecast by Sales Channel, 2017 to 2032
Table 12: Global Market Volume (MT) Forecast by Sales Channel, 2017 to 2032
Table 13: North America Market Value (US$ Million) Forecast by Country, 2017 to 2032
Table 14: North America Market Volume (MT) Forecast by Country, 2017 to 2032
Table 15: North America Market Value (US$ Million) Forecast by Form, 2017 to 2032
Table 16: North America Market Volume (MT) Forecast by Form, 2017 to 2032
Table 17: North America Market Value (US$ Million) Forecast by Fat Content, 2017 to 2032
Table 18: North America Market Volume (MT) Forecast by Fat Content, 2017 to 2032
Table 19: North America Market Value (US$ Million) Forecast by End Use Application, 2017 to 2032
Table 20: North America Market Volume (MT) Forecast by End Use Application, 2017 to 2032
Table 21: North America Market Value (US$ Million) Forecast by Packaging, 2017 to 2032
Table 22: North America Market Volume (MT) Forecast by Packaging, 2017 to 2032
Table 23: North America Market Value (US$ Million) Forecast by Sales Channel, 2017 to 2032
Table 24: North America Market Volume (MT) Forecast by Sales Channel, 2017 to 2032
Table 25: Latin America Market Value (US$ Million) Forecast by Country, 2017 to 2032
Table 26: Latin America Market Volume (MT) Forecast by Country, 2017 to 2032
Table 27: Latin America Market Value (US$ Million) Forecast by Form, 2017 to 2032
Table 28: Latin America Market Volume (MT) Forecast by Form, 2017 to 2032
Table 29: Latin America Market Value (US$ Million) Forecast by Fat Content, 2017 to 2032
Table 30: Latin America Market Volume (MT) Forecast by Fat Content, 2017 to 2032
Table 31: Latin America Market Value (US$ Million) Forecast by End Use Application, 2017 to 2032
Table 32: Latin America Market Volume (MT) Forecast by End Use Application, 2017 to 2032
Table 33: Latin America Market Value (US$ Million) Forecast by Packaging, 2017 to 2032
Table 34: Latin America Market Volume (MT) Forecast by Packaging, 2017 to 2032
Table 35: Latin America Market Value (US$ Million) Forecast by Sales Channel, 2017 to 2032
Table 36: Latin America Market Volume (MT) Forecast by Sales Channel, 2017 to 2032
Table 37: Europe Market Value (US$ Million) Forecast by Country, 2017 to 2032
Table 38: Europe Market Volume (MT) Forecast by Country, 2017 to 2032
Table 39: Europe Market Value (US$ Million) Forecast by Form, 2017 to 2032
Table 40: Europe Market Volume (MT) Forecast by Form, 2017 to 2032
Table 41: Europe Market Value (US$ Million) Forecast by Fat Content, 2017 to 2032
Table 42: Europe Market Volume (MT) Forecast by Fat Content, 2017 to 2032
Table 43: Europe Market Value (US$ Million) Forecast by End Use Application, 2017 to 2032
Table 44: Europe Market Volume (MT) Forecast by End Use Application, 2017 to 2032
Table 45: Europe Market Value (US$ Million) Forecast by Packaging, 2017 to 2032
Table 46: Europe Market Volume (MT) Forecast by Packaging, 2017 to 2032
Table 47: Europe Market Value (US$ Million) Forecast by Sales Channel, 2017 to 2032
Table 48: Europe Market Volume (MT) Forecast by Sales Channel, 2017 to 2032
Table 49: East Asia Market Value (US$ Million) Forecast by Country, 2017 to 2032
Table 50: East Asia Market Volume (MT) Forecast by Country, 2017 to 2032
Table 51: East Asia Market Value (US$ Million) Forecast by Form, 2017 to 2032
Table 52: East Asia Market Volume (MT) Forecast by Form, 2017 to 2032
Table 53: East Asia Market Value (US$ Million) Forecast by Fat Content, 2017 to 2032
Table 54: East Asia Market Volume (MT) Forecast by Fat Content, 2017 to 2032
Table 55: East Asia Market Value (US$ Million) Forecast by End Use Application, 2017 to 2032
Table 56: East Asia Market Volume (MT) Forecast by End Use Application, 2017 to 2032
Table 57: East Asia Market Value (US$ Million) Forecast by Packaging, 2017 to 2032
Table 58: East Asia Market Volume (MT) Forecast by Packaging, 2017 to 2032
Table 59: East Asia Market Value (US$ Million) Forecast by Sales Channel, 2017 to 2032
Table 60: East Asia Market Volume (MT) Forecast by Sales Channel, 2017 to 2032
Table 61: South Asia Market Value (US$ Million) Forecast by Country, 2017 to 2032
Table 62: South Asia Market Volume (MT) Forecast by Country, 2017 to 2032
Table 63: South Asia Market Value (US$ Million) Forecast by Form, 2017 to 2032
Table 64: South Asia Market Volume (MT) Forecast by Form, 2017 to 2032
Table 65: South Asia Market Value (US$ Million) Forecast by Fat Content, 2017 to 2032
Table 66: South Asia Market Volume (MT) Forecast by Fat Content, 2017 to 2032
Table 67: South Asia Market Value (US$ Million) Forecast by End Use Application, 2017 to 2032
Table 68: South Asia Market Volume (MT) Forecast by End Use Application, 2017 to 2032
Table 69: South Asia Market Value (US$ Million) Forecast by Packaging, 2017 to 2032
Table 70: South Asia Market Volume (MT) Forecast by Packaging, 2017 to 2032
Table 71: South Asia Market Value (US$ Million) Forecast by Sales Channel, 2017 to 2032
Table 72: South Asia Market Volume (MT) Forecast by Sales Channel, 2017 to 2032
Table 73: Oceania Market Value (US$ Million) Forecast by Country, 2017 to 2032
Table 74: Oceania Market Volume (MT) Forecast by Country, 2017 to 2032
Table 75: Oceania Market Value (US$ Million) Forecast by Form, 2017 to 2032
Table 76: Oceania Market Volume (MT) Forecast by Form, 2017 to 2032
Table 77: Oceania Market Value (US$ Million) Forecast by Fat Content, 2017 to 2032
Table 78: Oceania Market Volume (MT) Forecast by Fat Content, 2017 to 2032
Table 79: Oceania Market Value (US$ Million) Forecast by End Use Application, 2017 to 2032
Table 80: Oceania Market Volume (MT) Forecast by End Use Application, 2017 to 2032
Table 81: Oceania Market Value (US$ Million) Forecast by Packaging, 2017 to 2032
Table 82: Oceania Market Volume (MT) Forecast by Packaging, 2017 to 2032
Table 83: Oceania Market Value (US$ Million) Forecast by Sales Channel, 2017 to 2032
Table 84: Oceania Market Volume (MT) Forecast by Sales Channel, 2017 to 2032
Table 85: MEA Market Value (US$ Million) Forecast by Country, 2017 to 2032
Table 86: MEA Market Volume (MT) Forecast by Country, 2017 to 2032
Table 87: MEA Market Value (US$ Million) Forecast by Form, 2017 to 2032
Table 88: MEA Market Volume (MT) Forecast by Form, 2017 to 2032
Table 89: MEA Market Value (US$ Million) Forecast by Fat Content, 2017 to 2032
Table 90: MEA Market Volume (MT) Forecast by Fat Content, 2017 to 2032
Table 91: MEA Market Value (US$ Million) Forecast by End Use Application, 2017 to 2032
Table 92: MEA Market Volume (MT) Forecast by End Use Application, 2017 to 2032
Table 93: MEA Market Value (US$ Million) Forecast by Packaging, 2017 to 2032
Table 94: MEA Market Volume (MT) Forecast by Packaging, 2017 to 2032
Table 95: MEA Market Value (US$ Million) Forecast by Sales Channel, 2017 to 2032
Table 96: MEA Market Volume (MT) Forecast by Sales Channel, 2017 to 2032
Figure 01: Global Market Value (US$ Million) by Form, 2022 to 2032
Figure 02: Global Market Value (US$ Million) by Fat Content, 2022 to 2032
Figure 03: Global Market Value (US$ Million) by End Use Application, 2022 to 2032
Figure 04: Global Market Value (US$ Million) by Packaging, 2022 to 2032
Figure 05: Global Market Value (US$ Million) by Sales Channel, 2022 to 2032
Figure 06: Global Market Value (US$ Million) by Region, 2022 to 2032
Figure 07: Global Market Value (US$ Million) Analysis by Region, 2017 to 2032
Figure 08: Global Market Volume (MT) Analysis by Region, 2017 to 2032
Figure 09: Global Market Value Share (%) and BPS Analysis by Region, 2022 to 2032
Figure 10: Global Market Y-o-Y Growth (%) Projections by Region, 2022 to 2032
Figure 11: Global Market Value (US$ Million) Analysis by Form, 2017 to 2032
Figure 12: Global Market Volume (MT) Analysis by Form, 2017 to 2032
Figure 13: Global Market Value Share (%) and BPS Analysis by Form, 2022 to 2032
Figure 14: Global Market Y-o-Y Growth (%) Projections by Form, 2022 to 2032
Figure 15: Global Market Value (US$ Million) Analysis by Fat Content, 2017 to 2032
Figure 16: Global Market Volume (MT) Analysis by Fat Content, 2017 to 2032
Figure 17: Global Market Value Share (%) and BPS Analysis by Fat Content, 2022 to 2032
Figure 18: Global Market Y-o-Y Growth (%) Projections by Fat Content, 2022 to 2032
Figure 19: Global Market Value (US$ Million) Analysis by End Use Application, 2017 to 2032
Figure 20: Global Market Volume (MT) Analysis by End Use Application, 2017 to 2032
Figure 21: Global Market Value Share (%) and BPS Analysis by End Use Application, 2022 to 2032
Figure 22: Global Market Y-o-Y Growth (%) Projections by End Use Application, 2022 to 2032
Figure 23: Global Market Value (US$ Million) Analysis by Packaging, 2017 to 2032
Figure 24: Global Market Volume (MT) Analysis by Packaging, 2017 to 2032
Figure 25: Global Market Value Share (%) and BPS Analysis by Packaging, 2022 to 2032
Figure 26: Global Market Y-o-Y Growth (%) Projections by Packaging, 2022 to 2032
Figure 27: Global Market Value (US$ Million) Analysis by Sales Channel, 2017 to 2032
Figure 28: Global Market Volume (MT) Analysis by Sales Channel, 2017 to 2032
Figure 29: Global Market Value Share (%) and BPS Analysis by Sales Channel, 2022 to 2032
Figure 30: Global Market Y-o-Y Growth (%) Projections by Sales Channel, 2022 to 2032
Figure 31: Global Market Attractiveness by Form, 2022 to 2032
Figure 32: Global Market Attractiveness by Fat Content, 2022 to 2032
Figure 33: Global Market Attractiveness by End Use Application, 2022 to 2032
Figure 34: Global Market Attractiveness by Packaging, 2022 to 2032
Figure 35: Global Market Attractiveness by Sales Channel, 2022 to 2032
Figure 36: Global Market Attractiveness by Region, 2022 to 2032
Figure 37: North America Market Value (US$ Million) by Form, 2022 to 2032
Figure 38: North America Market Value (US$ Million) by Fat Content, 2022 to 2032
Figure 39: North America Market Value (US$ Million) by End Use Application, 2022 to 2032
Figure 40: North America Market Value (US$ Million) by Packaging, 2022 to 2032
Figure 41: North America Market Value (US$ Million) by Sales Channel, 2022 to 2032
Figure 42: North America Market Value (US$ Million) by Country, 2022 to 2032
Figure 43: North America Market Value (US$ Million) Analysis by Country, 2017 to 2032
Figure 44: North America Market Volume (MT) Analysis by Country, 2017 to 2032
Figure 45: North America Market Value Share (%) and BPS Analysis by Country, 2022 to 2032
Figure 46: North America Market Y-o-Y Growth (%) Projections by Country, 2022 to 2032
Figure 47: North America Market Value (US$ Million) Analysis by Form, 2017 to 2032
Figure 48: North America Market Volume (MT) Analysis by Form, 2017 to 2032
Figure 49: North America Market Value Share (%) and BPS Analysis by Form, 2022 to 2032
Figure 50: North America Market Y-o-Y Growth (%) Projections by Form, 2022 to 2032
Figure 51: North America Market Value (US$ Million) Analysis by Fat Content, 2017 to 2032
Figure 52: North America Market Volume (MT) Analysis by Fat Content, 2017 to 2032
Figure 53: North America Market Value Share (%) and BPS Analysis by Fat Content, 2022 to 2032
Figure 54: North America Market Y-o-Y Growth (%) Projections by Fat Content, 2022 to 2032
Figure 55: North America Market Value (US$ Million) Analysis by End Use Application, 2017 to 2032
Figure 56: North America Market Volume (MT) Analysis by End Use Application, 2017 to 2032
Figure 57: North America Market Value Share (%) and BPS Analysis by End Use Application, 2022 to 2032
Figure 58: North America Market Y-o-Y Growth (%) Projections by End Use Application, 2022 to 2032
Figure 59: North America Market Value (US$ Million) Analysis by Packaging, 2017 to 2032
Figure 60: North America Market Volume (MT) Analysis by Packaging, 2017 to 2032
Figure 61: North America Market Value Share (%) and BPS Analysis by Packaging, 2022 to 2032
Figure 62: North America Market Y-o-Y Growth (%) Projections by Packaging, 2022 to 2032
Figure 63: North America Market Value (US$ Million) Analysis by Sales Channel, 2017 to 2032
Figure 64: North America Market Volume (MT) Analysis by Sales Channel, 2017 to 2032
Figure 65: North America Market Value Share (%) and BPS Analysis by Sales Channel, 2022 to 2032
Figure 66: North America Market Y-o-Y Growth (%) Projections by Sales Channel, 2022 to 2032
Figure 67: North America Market Attractiveness by Form, 2022 to 2032
Figure 68: North America Market Attractiveness by Fat Content, 2022 to 2032
Figure 69: North America Market Attractiveness by End Use Application, 2022 to 2032
Figure 70: North America Market Attractiveness by Packaging, 2022 to 2032
Figure 71: North America Market Attractiveness by Sales Channel, 2022 to 2032
Figure 72: North America Market Attractiveness by Country, 2022 to 2032
Figure 73: Latin America Market Value (US$ Million) by Form, 2022 to 2032
Figure 74: Latin America Market Value (US$ Million) by Fat Content, 2022 to 2032
Figure 75: Latin America Market Value (US$ Million) by End Use Application, 2022 to 2032
Figure 76: Latin America Market Value (US$ Million) by Packaging, 2022 to 2032
Figure 77: Latin America Market Value (US$ Million) by Sales Channel, 2022 to 2032
Figure 78: Latin America Market Value (US$ Million) by Country, 2022 to 2032
Figure 79: Latin America Market Value (US$ Million) Analysis by Country, 2017 to 2032
Figure 80: Latin America Market Volume (MT) Analysis by Country, 2017 to 2032
Figure 81: Latin America Market Value Share (%) and BPS Analysis by Country, 2022 to 2032
Figure 82: Latin America Market Y-o-Y Growth (%) Projections by Country, 2022 to 2032
Figure 83: Latin America Market Value (US$ Million) Analysis by Form, 2017 to 2032
Figure 84: Latin America Market Volume (MT) Analysis by Form, 2017 to 2032
Figure 85: Latin America Market Value Share (%) and BPS Analysis by Form, 2022 to 2032
Figure 86: Latin America Market Y-o-Y Growth (%) Projections by Form, 2022 to 2032
Figure 87: Latin America Market Value (US$ Million) Analysis by Fat Content, 2017 to 2032
Figure 88: Latin America Market Volume (MT) Analysis by Fat Content, 2017 to 2032
Figure 89: Latin America Market Value Share (%) and BPS Analysis by Fat Content, 2022 to 2032
Figure 90: Latin America Market Y-o-Y Growth (%) Projections by Fat Content, 2022 to 2032
Figure 91: Latin America Market Value (US$ Million) Analysis by End Use Application, 2017 to 2032
Figure 92: Latin America Market Volume (MT) Analysis by End Use Application, 2017 to 2032
Figure 93: Latin America Market Value Share (%) and BPS Analysis by End Use Application, 2022 to 2032
Figure 94: Latin America Market Y-o-Y Growth (%) Projections by End Use Application, 2022 to 2032
Figure 95: Latin America Market Value (US$ Million) Analysis by Packaging, 2017 to 2032
Figure 96: Latin America Market Volume (MT) Analysis by Packaging, 2017 to 2032
Figure 97: Latin America Market Value Share (%) and BPS Analysis by Packaging, 2022 to 2032
Figure 98: Latin America Market Y-o-Y Growth (%) Projections by Packaging, 2022 to 2032
Figure 99: Latin America Market Value (US$ Million) Analysis by Sales Channel, 2017 to 2032
Figure 100: Latin America Market Volume (MT) Analysis by Sales Channel, 2017 to 2032
Figure 101: Latin America Market Value Share (%) and BPS Analysis by Sales Channel, 2022 to 2032
Figure 102: Latin America Market Y-o-Y Growth (%) Projections by Sales Channel, 2022 to 2032
Figure 103: Latin America Market Attractiveness by Form, 2022 to 2032
Figure 104: Latin America Market Attractiveness by Fat Content, 2022 to 2032
Figure 105: Latin America Market Attractiveness by End Use Application, 2022 to 2032
Figure 106: Latin America Market Attractiveness by Packaging, 2022 to 2032
Figure 107: Latin America Market Attractiveness by Sales Channel, 2022 to 2032
Figure 108: Latin America Market Attractiveness by Country, 2022 to 2032
Figure 109: Europe Market Value (US$ Million) by Form, 2022 to 2032
Figure 110: Europe Market Value (US$ Million) by Fat Content, 2022 to 2032
Figure 111: Europe Market Value (US$ Million) by End Use Application, 2022 to 2032
Figure 112: Europe Market Value (US$ Million) by Packaging, 2022 to 2032
Figure 113: Europe Market Value (US$ Million) by Sales Channel, 2022 to 2032
Figure 114: Europe Market Value (US$ Million) by Country, 2022 to 2032
Figure 115: Europe Market Value (US$ Million) Analysis by Country, 2017 to 2032
Figure 116: Europe Market Volume (MT) Analysis by Country, 2017 to 2032
Figure 117: Europe Market Value Share (%) and BPS Analysis by Country, 2022 to 2032
Figure 118: Europe Market Y-o-Y Growth (%) Projections by Country, 2022 to 2032
Figure 119: Europe Market Value (US$ Million) Analysis by Form, 2017 to 2032
Figure 120: Europe Market Volume (MT) Analysis by Form, 2017 to 2032
Figure 121: Europe Market Value Share (%) and BPS Analysis by Form, 2022 to 2032
Figure 122: Europe Market Y-o-Y Growth (%) Projections by Form, 2022 to 2032
Figure 123: Europe Market Value (US$ Million) Analysis by Fat Content, 2017 to 2032
Figure 124: Europe Market Volume (MT) Analysis by Fat Content, 2017 to 2032
Figure 125: Europe Market Value Share (%) and BPS Analysis by Fat Content, 2022 to 2032
Figure 126: Europe Market Y-o-Y Growth (%) Projections by Fat Content, 2022 to 2032
Figure 127: Europe Market Value (US$ Million) Analysis by End Use Application, 2017 to 2032
Figure 128: Europe Market Volume (MT) Analysis by End Use Application, 2017 to 2032
Figure 129: Europe Market Value Share (%) and BPS Analysis by End Use Application, 2022 to 2032
Figure 130: Europe Market Y-o-Y Growth (%) Projections by End Use Application, 2022 to 2032
Figure 131: Europe Market Value (US$ Million) Analysis by Packaging, 2017 to 2032
Figure 132: Europe Market Volume (MT) Analysis by Packaging, 2017 to 2032
Figure 133: Europe Market Value Share (%) and BPS Analysis by Packaging, 2022 to 2032
Figure 134: Europe Market Y-o-Y Growth (%) Projections by Packaging, 2022 to 2032
Figure 135: Europe Market Value (US$ Million) Analysis by Sales Channel, 2017 to 2032
Figure 136: Europe Market Volume (MT) Analysis by Sales Channel, 2017 to 2032
Figure 137: Europe Market Value Share (%) and BPS Analysis by Sales Channel, 2022 to 2032
Figure 138: Europe Market Y-o-Y Growth (%) Projections by Sales Channel, 2022 to 2032
Figure 139: Europe Market Attractiveness by Form, 2022 to 2032
Figure 140: Europe Market Attractiveness by Fat Content, 2022 to 2032
Figure 141: Europe Market Attractiveness by End Use Application, 2022 to 2032
Figure 142: Europe Market Attractiveness by Packaging, 2022 to 2032
Figure 143: Europe Market Attractiveness by Sales Channel, 2022 to 2032
Figure 144: Europe Market Attractiveness by Country, 2022 to 2032
Figure 145: East Asia Market Value (US$ Million) by Form, 2022 to 2032
Figure 146: East Asia Market Value (US$ Million) by Fat Content, 2022 to 2032
Figure 147: East Asia Market Value (US$ Million) by End Use Application, 2022 to 2032
Figure 148: East Asia Market Value (US$ Million) by Packaging, 2022 to 2032
Figure 149: East Asia Market Value (US$ Million) by Sales Channel, 2022 to 2032
Figure 150: East Asia Market Value (US$ Million) by Country, 2022 to 2032
Figure 151: East Asia Market Value (US$ Million) Analysis by Country, 2017 to 2032
Figure 152: East Asia Market Volume (MT) Analysis by Country, 2017 to 2032
Figure 153: East Asia Market Value Share (%) and BPS Analysis by Country, 2022 to 2032
Figure 154: East Asia Market Y-o-Y Growth (%) Projections by Country, 2022 to 2032
Figure 155: East Asia Market Value (US$ Million) Analysis by Form, 2017 to 2032
Figure 156: East Asia Market Volume (MT) Analysis by Form, 2017 to 2032
Figure 157: East Asia Market Value Share (%) and BPS Analysis by Form, 2022 to 2032
Figure 158: East Asia Market Y-o-Y Growth (%) Projections by Form, 2022 to 2032
Figure 159: East Asia Market Value (US$ Million) Analysis by Fat Content, 2017 to 2032
Figure 160: East Asia Market Volume (MT) Analysis by Fat Content, 2017 to 2032
Figure 161: East Asia Market Value Share (%) and BPS Analysis by Fat Content, 2022 to 2032
Figure 162: East Asia Market Y-o-Y Growth (%) Projections by Fat Content, 2022 to 2032
Figure 163: East Asia Market Value (US$ Million) Analysis by End Use Application, 2017 to 2032
Figure 164: East Asia Market Volume (MT) Analysis by End Use Application, 2017 to 2032
Figure 165: East Asia Market Value Share (%) and BPS Analysis by End Use Application, 2022 to 2032
Figure 166: East Asia Market Y-o-Y Growth (%) Projections by End Use Application, 2022 to 2032
Figure 167: East Asia Market Value (US$ Million) Analysis by Packaging, 2017 to 2032
Figure 168: East Asia Market Volume (MT) Analysis by Packaging, 2017 to 2032
Figure 169: East Asia Market Value Share (%) and BPS Analysis by Packaging, 2022 to 2032
Figure 170: East Asia Market Y-o-Y Growth (%) Projections by Packaging, 2022 to 2032
Figure 171: East Asia Market Value (US$ Million) Analysis by Sales Channel, 2017 to 2032
Figure 172: East Asia Market Volume (MT) Analysis by Sales Channel, 2017 to 2032
Figure 173: East Asia Market Value Share (%) and BPS Analysis by Sales Channel, 2022 to 2032
Figure 174: East Asia Market Y-o-Y Growth (%) Projections by Sales Channel, 2022 to 2032
Figure 175: East Asia Market Attractiveness by Form, 2022 to 2032
Figure 176: East Asia Market Attractiveness by Fat Content, 2022 to 2032
Figure 177: East Asia Market Attractiveness by End Use Application, 2022 to 2032
Figure 178: East Asia Market Attractiveness by Packaging, 2022 to 2032
Figure 179: East Asia Market Attractiveness by Sales Channel, 2022 to 2032
Figure 180: East Asia Market Attractiveness by Country, 2022 to 2032
Figure 181: South Asia Market Value (US$ Million) by Form, 2022 to 2032
Figure 182: South Asia Market Value (US$ Million) by Fat Content, 2022 to 2032
Figure 183: South Asia Market Value (US$ Million) by End Use Application, 2022 to 2032
Figure 184: South Asia Market Value (US$ Million) by Packaging, 2022 to 2032
Figure 185: South Asia Market Value (US$ Million) by Sales Channel, 2022 to 2032
Figure 186: South Asia Market Value (US$ Million) by Country, 2022 to 2032
Figure 187: South Asia Market Value (US$ Million) Analysis by Country, 2017 to 2032
Figure 188: South Asia Market Volume (MT) Analysis by Country, 2017 to 2032
Figure 189: South Asia Market Value Share (%) and BPS Analysis by Country, 2022 to 2032
Figure 190: South Asia Market Y-o-Y Growth (%) Projections by Country, 2022 to 2032
Figure 191: South Asia Market Value (US$ Million) Analysis by Form, 2017 to 2032
Figure 192: South Asia Market Volume (MT) Analysis by Form, 2017 to 2032
Figure 193: South Asia Market Value Share (%) and BPS Analysis by Form, 2022 to 2032
Figure 194: South Asia Market Y-o-Y Growth (%) Projections by Form, 2022 to 2032
Figure 195: South Asia Market Value (US$ Million) Analysis by Fat Content, 2017 to 2032
Figure 196: South Asia Market Volume (MT) Analysis by Fat Content, 2017 to 2032
Figure 197: South Asia Market Value Share (%) and BPS Analysis by Fat Content, 2022 to 2032
Figure 198: South Asia Market Y-o-Y Growth (%) Projections by Fat Content, 2022 to 2032
Figure 199: South Asia Market Value (US$ Million) Analysis by End Use Application, 2017 to 2032
Figure 200: South Asia Market Volume (MT) Analysis by End Use Application, 2017 to 2032
Figure 201: South Asia Market Value Share (%) and BPS Analysis by End Use Application, 2022 to 2032
Figure 202: South Asia Market Y-o-Y Growth (%) Projections by End Use Application, 2022 to 2032
Figure 203: South Asia Market Value (US$ Million) Analysis by Packaging, 2017 to 2032
Figure 204: South Asia Market Volume (MT) Analysis by Packaging, 2017 to 2032
Figure 205: South Asia Market Value Share (%) and BPS Analysis by Packaging, 2022 to 2032
Figure 206: South Asia Market Y-o-Y Growth (%) Projections by Packaging, 2022 to 2032
Figure 207: South Asia Market Value (US$ Million) Analysis by Sales Channel, 2017 to 2032
Figure 208: South Asia Market Volume (MT) Analysis by Sales Channel, 2017 to 2032
Figure 209: South Asia Market Value Share (%) and BPS Analysis by Sales Channel, 2022 to 2032
Figure 210: South Asia Market Y-o-Y Growth (%) Projections by Sales Channel, 2022 to 2032
Figure 211: South Asia Market Attractiveness by Form, 2022 to 2032
Figure 212: South Asia Market Attractiveness by Fat Content, 2022 to 2032
Figure 213: South Asia Market Attractiveness by End Use Application, 2022 to 2032
Figure 214: South Asia Market Attractiveness by Packaging, 2022 to 2032
Figure 215: South Asia Market Attractiveness by Sales Channel, 2022 to 2032
Figure 216: South Asia Market Attractiveness by Country, 2022 to 2032
Figure 217: Oceania Market Value (US$ Million) by Form, 2022 to 2032
Figure 218: Oceania Market Value (US$ Million) by Fat Content, 2022 to 2032
Figure 219: Oceania Market Value (US$ Million) by End Use Application, 2022 to 2032
Figure 220: Oceania Market Value (US$ Million) by Packaging, 2022 to 2032
Figure 221: Oceania Market Value (US$ Million) by Sales Channel, 2022 to 2032
Figure 222: Oceania Market Value (US$ Million) by Country, 2022 to 2032
Figure 223: Oceania Market Value (US$ Million) Analysis by Country, 2017 to 2032
Figure 224: Oceania Market Volume (MT) Analysis by Country, 2017 to 2032
Figure 225: Oceania Market Value Share (%) and BPS Analysis by Country, 2022 to 2032
Figure 226: Oceania Market Y-o-Y Growth (%) Projections by Country, 2022 to 2032
Figure 227: Oceania Market Value (US$ Million) Analysis by Form, 2017 to 2032
Figure 228: Oceania Market Volume (MT) Analysis by Form, 2017 to 2032
Figure 229: Oceania Market Value Share (%) and BPS Analysis by Form, 2022 to 2032
Figure 230: Oceania Market Y-o-Y Growth (%) Projections by Form, 2022 to 2032
Figure 231: Oceania Market Value (US$ Million) Analysis by Fat Content, 2017 to 2032
Figure 232: Oceania Market Volume (MT) Analysis by Fat Content, 2017 to 2032
Figure 233: Oceania Market Value Share (%) and BPS Analysis by Fat Content, 2022 to 2032
Figure 234: Oceania Market Y-o-Y Growth (%) Projections by Fat Content, 2022 to 2032
Figure 235: Oceania Market Value (US$ Million) Analysis by End Use Application, 2017 to 2032
Figure 236: Oceania Market Volume (MT) Analysis by End Use Application, 2017 to 2032
Figure 237: Oceania Market Value Share (%) and BPS Analysis by End Use Application, 2022 to 2032
Figure 238: Oceania Market Y-o-Y Growth (%) Projections by End Use Application, 2022 to 2032
Figure 239: Oceania Market Value (US$ Million) Analysis by Packaging, 2017 to 2032
Figure 240: Oceania Market Volume (MT) Analysis by Packaging, 2017 to 2032
Figure 241: Oceania Market Value Share (%) and BPS Analysis by Packaging, 2022 to 2032
Figure 242: Oceania Market Y-o-Y Growth (%) Projections by Packaging, 2022 to 2032
Figure 243: Oceania Market Value (US$ Million) Analysis by Sales Channel, 2017 to 2032
Figure 244: Oceania Market Volume (MT) Analysis by Sales Channel, 2017 to 2032
Figure 245: Oceania Market Value Share (%) and BPS Analysis by Sales Channel, 2022 to 2032
Figure 246: Oceania Market Y-o-Y Growth (%) Projections by Sales Channel, 2022 to 2032
Figure 247: Oceania Market Attractiveness by Form, 2022 to 2032
Figure 248: Oceania Market Attractiveness by Fat Content, 2022 to 2032
Figure 249: Oceania Market Attractiveness by End Use Application, 2022 to 2032
Figure 250: Oceania Market Attractiveness by Packaging, 2022 to 2032
Figure 251: Oceania Market Attractiveness by Sales Channel, 2022 to 2032
Figure 252: Oceania Market Attractiveness by Country, 2022 to 2032
Figure 253: MEA Market Value (US$ Million) by Form, 2022 to 2032
Figure 254: MEA Market Value (US$ Million) by Fat Content, 2022 to 2032
Figure 255: MEA Market Value (US$ Million) by End Use Application, 2022 to 2032
Figure 256: MEA Market Value (US$ Million) by Packaging, 2022 to 2032
Figure 257: MEA Market Value (US$ Million) by Sales Channel, 2022 to 2032
Figure 258: MEA Market Value (US$ Million) by Country, 2022 to 2032
Figure 259: MEA Market Value (US$ Million) Analysis by Country, 2017 to 2032
Figure 260: MEA Market Volume (MT) Analysis by Country, 2017 to 2032
Figure 261: MEA Market Value Share (%) and BPS Analysis by Country, 2022 to 2032
Figure 262: MEA Market Y-o-Y Growth (%) Projections by Country, 2022 to 2032
Figure 263: MEA Market Value (US$ Million) Analysis by Form, 2017 to 2032
Figure 264: MEA Market Volume (MT) Analysis by Form, 2017 to 2032
Figure 265: MEA Market Value Share (%) and BPS Analysis by Form, 2022 to 2032
Figure 266: MEA Market Y-o-Y Growth (%) Projections by Form, 2022 to 2032
Figure 267: MEA Market Value (US$ Million) Analysis by Fat Content, 2017 to 2032
Figure 268: MEA Market Volume (MT) Analysis by Fat Content, 2017 to 2032
Figure 269: MEA Market Value Share (%) and BPS Analysis by Fat Content, 2022 to 2032
Figure 270: MEA Market Y-o-Y Growth (%) Projections by Fat Content, 2022 to 2032
Figure 271: MEA Market Value (US$ Million) Analysis by End Use Application, 2017 to 2032
Figure 272: MEA Market Volume (MT) Analysis by End Use Application, 2017 to 2032
Figure 273: MEA Market Value Share (%) and BPS Analysis by End Use Application, 2022 to 2032
Figure 274: MEA Market Y-o-Y Growth (%) Projections by End Use Application, 2022 to 2032
Figure 275: MEA Market Value (US$ Million) Analysis by Packaging, 2017 to 2032
Figure 276: MEA Market Volume (MT) Analysis by Packaging, 2017 to 2032
Figure 277: MEA Market Value Share (%) and BPS Analysis by Packaging, 2022 to 2032
Figure 278: MEA Market Y-o-Y Growth (%) Projections by Packaging, 2022 to 2032
Figure 279: MEA Market Value (US$ Million) Analysis by Sales Channel, 2017 to 2032
Figure 280: MEA Market Volume (MT) Analysis by Sales Channel, 2017 to 2032
Figure 281: MEA Market Value Share (%) and BPS Analysis by Sales Channel, 2022 to 2032
Figure 282: MEA Market Y-o-Y Growth (%) Projections by Sales Channel, 2022 to 2032
Figure 283: MEA Market Attractiveness by Form, 2022 to 2032
Figure 284: MEA Market Attractiveness by Fat Content, 2022 to 2032
Figure 285: MEA Market Attractiveness by End Use Application, 2022 to 2032
Figure 286: MEA Market Attractiveness by Packaging, 2022 to 2032
Figure 287: MEA Market Attractiveness by Sales Channel, 2022 to 2032
Figure 288: MEA Market Attractiveness by Country, 2022 to 2032
The Global reduced-fat butter market is estimated to be worth over USD 1.3 Billion by 2022.
The reduced fat butter market is forecasted to surpass USD 2.37 Billion by the end of 2032.
Between 2017 and 2021, the reduced fat butter market grew at a 5.5% CAGR.
The demand for Reduced Fat Butter is expected to have a CAGR of 6.2% between 2022 and 2032.
Consumer inclination towards healthy lifestyle and development of butter variants that have low saturation of fat and cholesterol content.
The North American reduced-fat butter market will grow at 5.7% CAGR between 2022 and 2032.
Explore Similar Insights
Thank you!
You will receive an email from our Business Development Manager. Please be sure to check your SPAM/JUNK folder too.