Fat Soluble Vitamins Market Size and Share Forecast Outlook 2025 to 2035

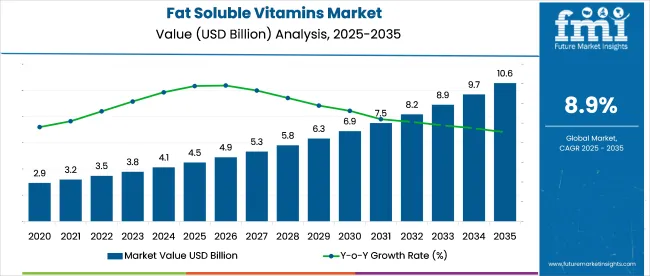
Fat soluble vitamins market revenue is forecast to expand from USD 4.5 billion in 2025 to USD 10.5 billion by 2035, showing a CAGR of 8.9% over the assessment period.
Quick Stats for Fat Soluble Vitamins Market

  • Industry value (2025): USD 4.5 billion
  • Forecast value (2035): USD 10.5 billion
  • Forecast CAGR (2025 to 2035): 8.9%
  • Leading segment in 2035: Vitamin D (38% share)
  • Key growth region: Asia Pacific (India)
  • Key players: DSM-Firmenich; BASF SE; Archer Daniels Midland Company (ADM); Lonza Group AG; Pfizer Inc.; Roche Vitamins

Fat Soluble Vitamins Market Market Value Analysis

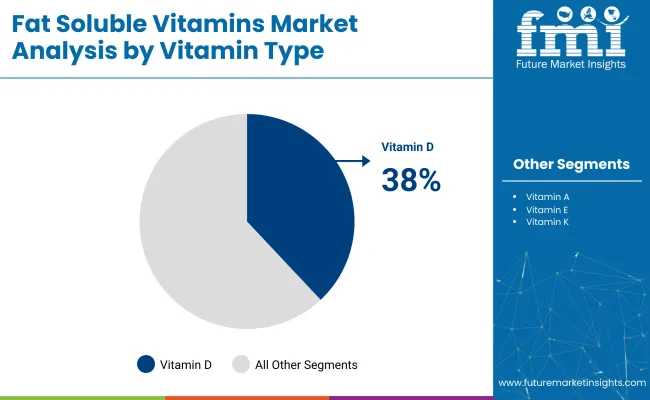
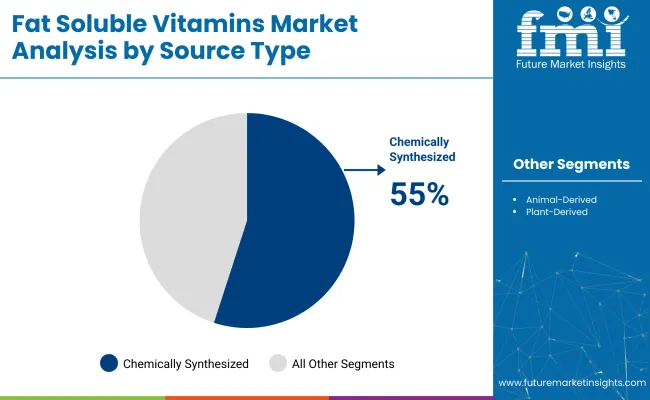
India’s growth rate of 9.6% has been shaped by wider supplement penetration across urban and rural retail networks and expanding domestic manufacturing capacity. Vitamin D is projected to lead by type, with a 38% industry share in 2035, supported by its widespread role in immune function and bone health. Chemically synthesized sources, expected to hold 55% share, continue to dominate due to cost efficiency, scalability, and consistent compound purity.

Geraldine Matchett, Co-CEO of Royal DSM (now part of DSM-Firmenich), stated, “Vitamins remain a cornerstone of our nutritional solutions portfolio. We see sustained demand driven by increasing consumer awareness of immune health, healthy aging, and the need for fortification, particularly in essential micronutrients like Vitamin D.” This highlights the growing focus on vitamins as key components of health, particularly with rising demand for immune support and micronutrient fortification in consumer products.

The industry holds specific shares within its parent markets. In the dietary supplements market, it accounts for around 10-12%, as these vitamins are crucial in supplement formulations. Within the vitamin ingredients market, the share is approximately 20-25%, due to the demand for fat soluble vitamins like A, D, E, and K in various products.

The functional foods market contributes about 5-7%, driven by the inclusion of these vitamins in food products designed to support health. In the animal feed additives market, the share is 3-5%. The cosmetics and personal care market holds about 2-3%, as vitamin E and other fat soluble vitamins are commonly used in skincare products.

Analysis of Fat Soluble Vitamins Market by Top Investment Segments

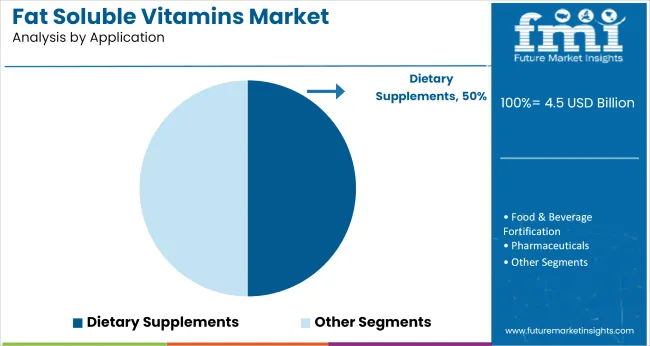
The industry is expected to see significant growth through 2035, driven by vitamin D fortification, chemically synthesized feedstocks, and dietary supplements. Vitamin D will capture 38% of the industry share, with chemically synthesized inputs holding 55%, and dietary supplements accounting for 50%.
Vitamin D drives regulatory-focused nutrient fortification demand worldwide

Fat Soluble Vitamins Market Analysis By Vitamin Type

Vitamin D is expected to capture 38% of the industry share in 2035, driven by its application in food fortification policies and its ability to maintain stability under oil-phase conditions. This enables widespread usage in dairy, bakery, and beverage premixes. In particular, its bioavailability in calcifediol formats enhances dosage efficiency, allowing for better product labeling and consumer understanding.

National fortification schedules require specific amounts like 400 IU per liter for fluid milk, with a focus on raising supplement uptake among high-risk populations, such as the elderly and dark-skinned individuals. Research is also increasingly supporting its link to immune health, driving consumer demand.
  • National fortification schedules mandate specific dosage amounts in milk and beverages
  • Focus on vitamin D’s bioavailability and calcifediol formats for better efficacy
  • Campaigns targeting high-risk populations, such as elderly and dark-skinned groups, boost consumption

Chemically synthesized inputs continue high-volume vitamin production economies

Fat Soluble Vitamins Market Analysis By Source Type

Chemically synthesized vitamin production is expected to account for 55% of the industry share in 2035. This method relies on petrochemical precursors and catalytic processes, offering consistent purity, predictable yields, and lower production costs compared to extraction methods. Innovations in photochemical synthesis allow for the creation of high-assay crystalline vitamin D₃, achieving ≥98.5% purity.

The use of continuous-flow reactors significantly reduces solvent usage by 22%, streamlining production and improving compliance with Good Manufacturing Practices (GMP). Hydrogenation catalysts are now being regenerated on-site, reducing the need for rare-metal procurement and improving production efficiency.
  • Photochemical synthesis achieves over 98.5% purity in vitamin D₃ production
  • Continuous-flow reactors reduce solvent usage and enhance GMP compliance
  • On-site regeneration of hydrogenation catalysts cuts rare-metal procurement costs

Dietary supplements anchor consumer-focused micronutrient acquisition patterns

Fat Soluble Vitamins Market Analysis By Application

Dietary supplements are projected to capture 50% of the industry share in 2035, thanks to convenient formats like capsules, gummies, and sprays. These formats allow for personalized dosing, quick industry rotations, and high merchandising flexibility. Soft-gel encapsulation, for instance, significantly enhances nutrient absorption compared to tablets.

Sugar-reduced gummies are particularly attractive to health-conscious consumers and retailers enforcing strict guidelines on child-friendly products. Metered oral sprays cater to seniors with difficulty swallowing pills, making them a popular option in healthcare settings. E-commerce strategies, such as QR-coded packs, are improving consumer traceability and enhancing trust.

  • Soft-gels offer higher absorption rates compared to traditional tablets
  • Sugar-reduced gummies appeal to child-friendly product requirements
  • QR-coded packaging enhances product traceability and consumer trust in e-commerce

Top Fat Soluble Vitamins Market Dynamics

Rising Health Consciousness Drives Fat Soluble Vitamin Adoption

The growth of the industry is driven by increasing consumer awareness of nutrition, rising prevalence of vitamin deficiencies, and expanding applications of these vitamins in various sectors like food fortification and supplements. The growing focus on health and wellness, combined with advancements in vitamin extraction and synthesis, is contributing to the industry's rapid expansion. As more consumers seek preventive healthcare solutions, fat soluble vitamins like Vitamin D and K are seeing heightened demand for supplementation and fortified food products.

  • Growing awareness of nutrition and health is fueling the demand for fat soluble vitamins.
  • Rising vitamin deficiencies, especially Vitamin D, are driving supplementation demand.
  • Advances in extraction and synthesis technologies are improving vitamin production efficiency.

Regulatory Compliance and Toxicity Concerns Impede Fat Soluble Vitamin Market Growth

The industry faces significant challenges, including stringent regulatory requirements and concerns over toxicity. Regulatory bodies in regions like the EU and the USA have established tolerable upper intake levels (ULs) for vitamins A and D due to documented toxicity risks. These regulations can limit product formulations and industry access. The risk of hypervitaminosis, particularly from excessive supplementation, poses health concerns and can deter consumer confidence
  • Strict regulations and established ULs for fat soluble vitamins can limit product formulations and industry access.
  • Overconsumption of fat soluble vitamins, especially A and D, can lead to adverse health effects, deterring consumers.
  • Regulatory and safety concerns may restrict the availability and diversity of fat-soluble vitamin products in the industry.

Top Countries Producing, Fortifying, and Distributing Fat Soluble Vitamins

Country Wise Analysis Of Fat Soluble Vitamins Market

Countries CAGR (2025 to 2035)
India 9.6%
China 9.1%
United States 8.7%
United Kingdom 8.3%
Germany 8.2%

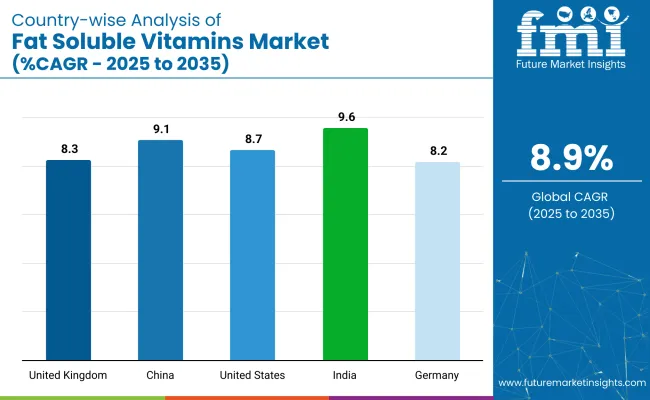
The industry demand is projected to rise at an 8.9% CAGR from 2025 to 2035. Of the five profiled countries out of 40 covered, India leads at 9.6%, followed by China at 9.1%, and the United States at 8.7%, while the United Kingdom posts 8.3% and Germany records 8.2%.

These rates translate to a growth premium of +8% for India, +2% for China, and -2% for the United Kingdom versus the baseline, while the United States and Germany show steady growth. Divergence reflects local catalysts: increased consumer awareness of the health benefits of fat soluble vitamins in India and China, while more stable demand in the United States, Germany, and the United Kingdom is attributed to mature industries with established consumption patterns in dietary supplements and fortified foods.

Growth Analysis of Fat Soluble Vitamins Market in India

The industry in India is set to record a CAGR of 9.6% from 2025 to 2035. Expansion is being powered by mandatory vitamin-fortified edible oils, public procurement of vitamin-A milk for school meals, and export-oriented vitamin D₃ fermentation hubs granted Production-Linked Incentive subsidies. Domestic nutraceutical firms have shifted toward lipid-soluble blends positioned for immunity and eye health, while collaborations between dairy cooperatives and biotech institutes improve encapsulation and bioavailability.

  • FSSAI rules on vitamin-A and D enrichment in edible oils sustain retinyl-palmitate and cholecalciferol demand.
  • Ayurvedic supplement brands industry lipid-soluble capsules formulated for plant-based diets.
  • Fiscal incentives support vitamin D₃ fermentation facilities in Gujarat, boosting export volumes.

Demand Forecast for Fat Soluble Vitamins Market in China

Demand for fat soluble vitamins in China is estimated to grow at a CAGR of 9.1% through 2035. Premium infant-formula fortification, sports-nutrition expansion, and soybean-derived tocopherol production underpin steady volume growth. Child-nutrition directives mandate higher vitamin-A densities in formula powders, while e-commerce soft-gel sales reach lower-tier cities without margin erosion. Feed-grade vitamin orders stabilize as biosecurity reforms reshape the pig sector.

  • Enzymatic purification of soybean-oil distillates scales domestic d-alpha-tocopherol output.
  • Infant-formula standard GB 10765 to 2021 secures long-term vitamin-A contracts.
  • Livestream sales on Douyin popularize high-potency vitamin D₃ softgels among sports-health consumers.

Growth Analysis of Fat Soluble Vitamins Market in the United States

The industry in the United States is projected to post a CAGR of 8.7% from 2025 to 2035. Functional beverages, GRAS-cleared vitamin K₂ formulations, and retail private-label expansion drive demand. Federal research funding heightens vitamin-D deficiency awareness, while contract manufacturers lock in fermentation-derived actives to mitigate price swings.

  • Menaquinone-7 GRAS status enables heart-health claims in dairy analogs.
  • Digital nutrition brands package high-dose vitamin D₃ gummies for on-the-go use.
  • Beverage startups employ microencapsulation to preserve vitamin E during chilled distribution.

Future Outlook for Fat Soluble Vitamins Market in the United Kingdom

Sales of fat soluble vitamins in the United Kingdom are projected to grow at a CAGR of 8.3% through 2035. Public-health guidance on daily vitamin D use, flexitarian demand for plant-derived forms, and venture funding for fermented vitamin K₂ boost category momentum. Subscription e-commerce services deliver personalized packs that sustain reorder cycles, while NHS precision-nutrition pilots integrate vitamin-A fortified meal replacements.

  • Public Health England’s 10 µg vitamin D advisory underpins year-round capsule sales.
  • Vegan retinol alternatives derived from algal carotenoids broaden supplement aisles.
  • NHS outreach programs supply vitamin D drops in communities with melanin-linked deficiency risk.

Fat Soluble Vitamins Market Growth Outlook in Germany

The industry in Germany is expected to expand at a CAGR of 8.2% between 2025 and 2035. Fermentation clusters in North Rhine-Westphalia specialize in menaquinone and cholecalciferol under generous R&D tax incentives, while functional dairy fortified with vitamins A and D benefits from robust cold-chain logistics. Nutricosmetic demand for tocopherol-rich serums is endorsed by the German Allergy and Asthma Association, and stringent shelf-life validation promotes microencapsulation across bakery and beverage formats.
  • BfR guidance on vitamin-A upper limits triggers balanced reformulation in food products.
  • Tocopherol-based serums target photo-aging defense in premium cosmetics.
  • EU claim compliance accelerates vitamin D cheese snack launches in discount retail.

Leading Fat Soluble Vitamins Market Suppliers

Fat Soluble Vitamins Market Analysis By Company

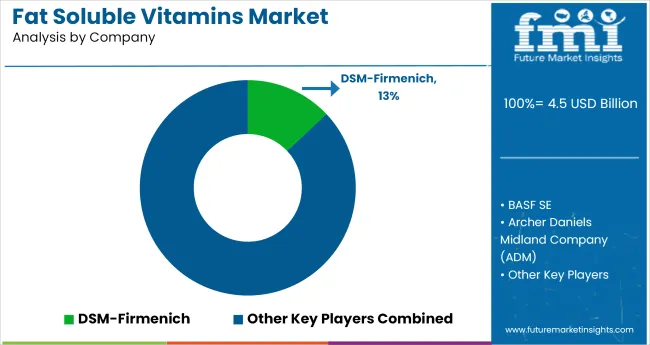
The global industry features a competitive landscape with dominant players, key players, and emerging players. Dominant players such as DSM-Firmenich, BASF SE, and Archer Daniels Midland Company (ADM) lead the industry with extensive product portfolios, strong R&D capabilities, and robust distribution networks across food, beverage, and pharmaceutical sectors.

Key players including Lonza Group AG, Pfizer Inc., and Roche Vitamins offer specialized solutions tailored to specific applications and regional industries. Emerging players, such as Eastman Chemical Company, Chr. Hansen Holding A/S, and Zhejiang Medicine Co., Ltd., focus on innovative technologies and cost-effective solutions, expanding their presence in the global industry.

Recent Industry News

  • DSM-Firmenich launched Dry Vitamin A Palmitate NI on 20 September 2024, offering heat-stable, clean-label granules for wheat-flour fortification in Africa and Asia; public-health agencies can now achieve WHO vitamin A targets without hexane-derived carriers, refrigeration constraints, or costly cold-chain transport.
  • Innobio launched LocVita Vegan Vitamin D3 on 22 March 2024, extracting cholecalciferol from certified pine oil; microencapsulation secures bioavailability across gummies, beverages, capsules, soft gels, tablets, giving supplement brands an animal-free alternative to lanolin-derived D3 and avoiding common pesticide-residue concerns.

Key Players

  • DSM-Firmenich
  • BASF SE
  • Archer Daniels Midland Company (ADM)
  • Lonza Group AG
  • Pfizer Inc.
  • Roche Vitamins
  • Eastman Chemical Company
  • Chr. Hansen Holding A/S
  • Bayer AG
  • Zhejiang Medicine Co., Ltd.
  • Others

Report Coverage and Scope Summary

Report Attributes Key Insights
Estimated Industry Size (2025) USD 4.5 billion
Projected Industry Value (2035) USD 10.5 billion
CAGR (2025 to 2035) 8.9%
Base Year for Estimation 2024
Historical Period 2020 to 2024
Forecast Period 2025 to 2035
Quantitative Units Revenue in USD billion
Vitamin Type Vitamin A, Vitamin D, Vitamin E, Vitamin K
Source Type Animal-derived, Plant-derived, Chemically synthesized
Application Dietary supplements, Food & Beverage fortification, Pharmaceuticals, Cosmetics
Region North America, Latin America, Western Europe, Eastern Europe, Balkans & Baltic, Russia & Belarus, Central Asia, East Asia, South Asia & Pacific, Middle East & Africa
Countries Covered United States, Canada, Mexico, Brazil, Argentina, Germany, France, United Kingdom, Italy, Spain, Netherlands, China, India, Japan, South Korea, ANZ, GCC Countries, South Africa
Key Players DSM-Firmenich, BASF SE, Archer Daniels Midland Company (ADM), Lonza Group AG, Pfizer Inc., Roche Vitamins, Eastman Chemical Company, Chr. Hansen Holding A/S, Bayer AG, Zhejiang Medicine Co., Ltd.
Additional Attributes Dollar sales, CAGR trends, product type distribution, size preferences, price range segmentation, competitor dollar sales & industry share, regional growth patterns

Key Investment Segments Analyzed

By Vitamin Type:

By vitamin type, the industry includes vitamin A, vitamin D, vitamin E, and vitamin K.

By Source Type:

By source type, the industry is segmented into animal-derived, plant-derived, and chemically synthesized.

By Application:

By application, the industry comprises dietary supplements, food & beverage fortification, pharmaceuticals, and cosmetics.

By Region:

By region, the industry analyzed across North America, Latin America, Western Europe, Eastern Europe, Balkans & Baltic, Russia & Belarus, Central Asia, East Asia, South Asia & Pacific, and Middle East & Africa.

Table of Content

  1. Executive Summary
    • Global Market Outlook
    • Demand-side Trends
    • Supply-side Trends
    • Technology Roadmap Analysis
    • Analysis and Recommendations
  2. Market Overview
    • Market Coverage / Taxonomy
    • Market Definition / Scope / Limitations
  3. Market Background
    • Market Dynamics
      • Drivers
      • Restraints
      • Opportunity
      • Trends
    • Scenario Forecast
      • Demand in Optimistic Scenario
      • Demand in Likely Scenario
      • Demand in Conservative Scenario
    • Opportunity Map Analysis
    • Product Life Cycle Analysis
    • Supply Chain Analysis
      • Supply Side Participants and their Roles
        • Producers
        • Mid-Level Participants (Traders/ Agents/ Brokers)
        • Wholesalers and Distributors
      • Value Added and Value Created at Node in the Supply Chain
      • List of Raw Material Suppliers
      • List of Existing and Potential Buyer’s
    • Investment Feasibility Matrix
    • Value Chain Analysis
      • Profit Margin Analysis
      • Wholesalers and Distributors
      • Retailers
    • PESTLE and Porter’s Analysis
    • Regulatory Landscape
      • By Key Regions
      • By Key Countries
    • Regional Parent Market Outlook
    • Production and Consumption Statistics
    • Import and Export Statistics
  4. Global Market Analysis 2020 to 2024 and Forecast, 2025 to 2035
    • Historical Market Size Value (USD Billion) & Volume (Million Units) Analysis, 2020 to 2024
    • Current and Future Market Size Value (USD Billion) & Volume (Million Units) Projections, 2025 to 2035
      • Y-o-Y Growth Trend Analysis
      • Absolute $ Opportunity Analysis
  5. Global Market Pricing Analysis 2020 to 2024 and Forecast 2025 to 2035
  6. Global Market Analysis 2020 to 2024 and Forecast 2025 to 2035, By Vitamin Type
    • Introduction / Key Findings
    • Historical Market Size Value (USD Billion) & Volume (Million Units) Analysis By Vitamin Type, 2020 to 2024
    • Current and Future Market Size Value (USD Billion) & Volume (Million Units) Analysis and Forecast By Vitamin Type, 2025 to 2035
      • Vitamin A
      • Vitamin D
      • Vitamin E
      • Vitamin K
    • Y-o-Y Growth Trend Analysis By Vitamin Type, 2020 to 2024
    • Absolute $ Opportunity Analysis By Vitamin Type, 2025 to 2035
  7. Global Market Analysis 2020 to 2024 and Forecast 2025 to 2035, By Source Type
    • Introduction / Key Findings
    • Historical Market Size Value (USD Billion) & Volume (Million Units) Analysis By Source Type, 2020 to 2024
    • Current and Future Market Size Value (USD Billion) & Volume (Million Units) Analysis and Forecast By Source Type, 2025 to 2035
      • Animal-derived
      • Plant-derived
      • Chemically synthesized
    • Y-o-Y Growth Trend Analysis By Source Type, 2020 to 2024
    • Absolute $ Opportunity Analysis By Source Type, 2025 to 2035
  8. Global Market Analysis 2020 to 2024 and Forecast 2025 to 2035, By Application
    • Introduction / Key Findings
    • Historical Market Size Value (USD Billion) & Volume (Million Units) Analysis By Application, 2020 to 2024
    • Current and Future Market Size Value (USD Billion) & Volume (Million Units) Analysis and Forecast By Application, 2025 to 2035
      • Dietary supplements
      • Food & Beverage Fortification
      • Pharmaceuticals
      • Cosmetics
    • Y-o-Y Growth Trend Analysis By Application, 2020 to 2024
    • Absolute $ Opportunity Analysis By Application, 2025 to 2035
  9. Global Market Analysis 2020 to 2024 and Forecast 2025 to 2035, By Region
    • Introduction
    • Historical Market Size Value (USD Billion) & Volume (Million Units) Analysis By Region, 2020 to 2024
    • Current Market Size Value (USD Billion) & Volume (Million Units) Analysis and Forecast By Region, 2025 to 2035
      • North America
      • Latin America
      • Western Europe
      • Eastern Europe
      • East Asia
      • South Asia & Pacific
      • Middle East and Africa
    • Market Attractiveness Analysis By Region
  10. North America Market Analysis 2020 to 2024 and Forecast 2025 to 2035, By Country
    • Historical Market Size Value (USD Billion) & Volume (Million Units) Trend Analysis By Market Taxonomy, 2020 to 2024
    • Market Size Value (USD Billion) & Volume (Million Units) Forecast By Market Taxonomy, 2025 to 2035
      • By Country
        • USA
        • Canada
        • Mexico
      • By Vitamin Type
      • By Source Type
      • By Application
    • Market Attractiveness Analysis
      • By Country
      • By Vitamin Type
      • By Source Type
      • By Application
    • Key Takeaways
  11. Latin America Market Analysis 2020 to 2024 and Forecast 2025 to 2035, By Country
    • Historical Market Size Value (USD Billion) & Volume (Million Units) Trend Analysis By Market Taxonomy, 2020 to 2024
    • Market Size Value (USD Billion) & Volume (Million Units) Forecast By Market Taxonomy, 2025 to 2035
      • By Country
        • Brazil
        • Argentina
        • Rest of LATAM
      • By Vitamin Type
      • By Source Type
      • By Application
    • Market Attractiveness Analysis
      • By Country
      • By Vitamin Type
      • By Source Type
      • By Application
    • Key Takeaways
  12. Western Europe Market Analysis 2020 to 2024 and Forecast 2025 to 2035, By Country
    • Historical Market Size Value (USD Billion) & Volume (Million Units) Trend Analysis By Market Taxonomy, 2020 to 2024
    • Market Size Value (USD Billion) & Volume (Million Units) Forecast By Market Taxonomy, 2025 to 2035
      • By Country
        • Germany
        • Italy
        • France
        • UK
        • Spain
        • BENELUX
        • Nordic
        • Rest of W. Europe
      • By Vitamin Type
      • By Source Type
      • By Application
    • Market Attractiveness Analysis
      • By Country
      • By Vitamin Type
      • By Source Type
      • By Application
    • Key Takeaways
  13. Eastern Europe Market Analysis 2020 to 2024 and Forecast 2025 to 2035, By Country
    • Historical Market Size Value (USD Billion) & Volume (Million Units) Trend Analysis By Market Taxonomy, 2020 to 2024
    • Market Size Value (USD Billion) & Volume (Million Units) Forecast By Market Taxonomy, 2025 to 2035
      • By Country
        • Russia
        • Hungary
        • Poland
        • Balkan & Baltics
        • Rest of E. Europe
      • By Vitamin Type
      • By Source Type
      • By Application
    • Market Attractiveness Analysis
      • By Country
      • By Vitamin Type
      • By Source Type
      • By Application
    • Key Takeaways
  14. East Asia Market Analysis 2020 to 2024 and Forecast 2025 to 2035, By Country
    • Historical Market Size Value (USD Billion) & Volume (Million Units) Trend Analysis By Market Taxonomy, 2020 to 2024
    • Market Size Value (USD Billion) & Volume (Million Units) Forecast By Market Taxonomy, 2025 to 2035
      • By Country
        • China
        • Japan
        • South Korea
      • By Vitamin Type
      • By Source Type
      • By Application
    • Market Attractiveness Analysis
      • By Country
      • By Vitamin Type
      • By Source Type
      • By Application
    • Key Takeaways
  15. South Asia & Pacific Market Analysis 2020 to 2024 and Forecast 2025 to 2035, By Country
    • Historical Market Size Value (USD Billion) & Volume (Million Units) Trend Analysis By Market Taxonomy, 2020 to 2024
    • Market Size Value (USD Billion) & Volume (Million Units) Forecast By Market Taxonomy, 2025 to 2035
      • By Country
        • India
        • Australia & New Zealand
        • ASEAN
        • Rest of SAP
      • By Vitamin Type
      • By Source Type
      • By Application
    • Market Attractiveness Analysis
      • By Country
      • By Vitamin Type
      • By Source Type
      • By Application
    • Key Takeaways
  16. Middle East and Africa Market Analysis 2020 to 2024 and Forecast 2025 to 2035, By Country
    • Historical Market Size Value (USD Billion) & Volume (Million Units) Trend Analysis By Market Taxonomy, 2020 to 2024
    • Market Size Value (USD Billion) & Volume (Million Units) Forecast By Market Taxonomy, 2025 to 2035
      • By Country
        • GCC Countries
        • Northern Africa
        • South Africa
        • Turkiye
        • Rest of MEA
      • By Vitamin Type
      • By Source Type
      • By Application
    • Market Attractiveness Analysis
      • By Country
      • By Vitamin Type
      • By Source Type
      • By Application
    • Key Takeaways
  17. Key Countries Market Analysis
    • USA
      • Pricing Analysis
      • Market Share Analysis, 2024
        • By Vitamin Type
        • By Source Type
        • By Application
    • Canada
      • Pricing Analysis
      • Market Share Analysis, 2024
        • By Vitamin Type
        • By Source Type
        • By Application
    • Brazil
      • Pricing Analysis
      • Market Share Analysis, 2024
        • By Vitamin Type
        • By Source Type
        • By Application
    • Mexico
      • Pricing Analysis
      • Market Share Analysis, 2024
        • By Vitamin Type
        • By Source Type
        • By Application
    • Argentina
      • Pricing Analysis
      • Market Share Analysis, 2024
        • By Vitamin Type
        • By Source Type
        • By Application
  18. Market Structure Analysis
    • Competition Dashboard
    • Competition Benchmarking
    • Market Share Analysis of Top Players
      • By Regional
      • By Vitamin Type
      • By Source Type
      • By Application
  19. Competition Analysis
    • Competition Deep Dive
      • DSM-Firmenich
        • Overview
        • Product Portfolio
        • Profitability by Market Segments (Product/Age /Sales Channel/Region)
        • Sales Footprint
        • Strategy Overview
          • Marketing Strategy
          • Product Strategy
          • Channel Strategy
      • BASF SE
        • Overview
        • Product Portfolio
        • Profitability by Market Segments (Product/Age /Sales Channel/Region)
        • Sales Footprint
        • Strategy Overview
          • Marketing Strategy
          • Product Strategy
          • Channel Strategy
      • Archer Daniels Midland Company (ADM)
        • Overview
        • Product Portfolio
        • Profitability by Market Segments (Product/Age /Sales Channel/Region)
        • Sales Footprint
        • Strategy Overview
          • Marketing Strategy
          • Product Strategy
          • Channel Strategy
      • Lonza Group AG
        • Overview
        • Product Portfolio
        • Profitability by Market Segments (Product/Age /Sales Channel/Region)
        • Sales Footprint
        • Strategy Overview
          • Marketing Strategy
          • Product Strategy
          • Channel Strategy
      • Pfizer Inc.
        • Overview
        • Product Portfolio
        • Profitability by Market Segments (Product/Age /Sales Channel/Region)
        • Sales Footprint
        • Strategy Overview
          • Marketing Strategy
          • Product Strategy
          • Channel Strategy
      • Roche Vitamins
        • Overview
        • Product Portfolio
        • Profitability by Market Segments (Product/Age /Sales Channel/Region)
        • Sales Footprint
        • Strategy Overview
          • Marketing Strategy
          • Product Strategy
          • Channel Strategy
      • Eastman Chemical Company
        • Overview
        • Product Portfolio
        • Profitability by Market Segments (Product/Age /Sales Channel/Region)
        • Sales Footprint
        • Strategy Overview
          • Marketing Strategy
          • Product Strategy
          • Channel Strategy
      • Chr. Hansen Holding A/S
        • Overview
        • Product Portfolio
        • Profitability by Market Segments (Product/Age /Sales Channel/Region)
        • Sales Footprint
        • Strategy Overview
          • Marketing Strategy
          • Product Strategy
          • Channel Strategy
      • Bayer AG
        • Overview
        • Product Portfolio
        • Profitability by Market Segments (Product/Age /Sales Channel/Region)
        • Sales Footprint
        • Strategy Overview
          • Marketing Strategy
          • Product Strategy
          • Channel Strategy
      • Zhejiang Medicine Co., Ltd.
        • Overview
        • Product Portfolio
        • Profitability by Market Segments (Product/Age /Sales Channel/Region)
        • Sales Footprint
        • Strategy Overview
          • Marketing Strategy
          • Product Strategy
          • Channel Strategy
      • Others
        • Overview
        • Product Portfolio
        • Profitability by Market Segments (Product/Age /Sales Channel/Region)
        • Sales Footprint
        • Strategy Overview
          • Marketing Strategy
          • Product Strategy
          • Channel Strategy
  20. Assumptions & Acronyms Used
  21. Research Methodology

List of Tables

  • Table 1: Global Market Value (USD Billion) Forecast by Region, 2020 to 2035
  • Table 2: Global Market Volume (Million Units) Forecast by Region, 2020 to 2035
  • Table 3: Global Market Value (USD Billion) Forecast by Vitamin Type, 2020 to 2035
  • Table 4: Global Market Volume (Million Units) Forecast by Vitamin Type, 2020 to 2035
  • Table 5: Global Market Value (USD Billion) Forecast by Source Type, 2020 to 2035
  • Table 6: Global Market Volume (Million Units) Forecast by Source Type, 2020 to 2035
  • Table 7: Global Market Value (USD Billion) Forecast by Application, 2020 to 2035
  • Table 8: Global Market Volume (Million Units) Forecast by Application, 2020 to 2035
  • Table 9: North America Market Value (USD Billion) Forecast by Country, 2020 to 2035
  • Table 10: North America Market Volume (Million Units) Forecast by Country, 2020 to 2035
  • Table 11: North America Market Value (USD Billion) Forecast by Vitamin Type, 2020 to 2035
  • Table 12: North America Market Volume (Million Units) Forecast by Vitamin Type, 2020 to 2035
  • Table 13: North America Market Value (USD Billion) Forecast by Source Type, 2020 to 2035
  • Table 14: North America Market Volume (Million Units) Forecast by Source Type, 2020 to 2035
  • Table 15: North America Market Value (USD Billion) Forecast by Application, 2020 to 2035
  • Table 16: North America Market Volume (Million Units) Forecast by Application, 2020 to 2035
  • Table 17: Latin America Market Value (USD Billion) Forecast by Country, 2020 to 2035
  • Table 18: Latin America Market Volume (Million Units) Forecast by Country, 2020 to 2035
  • Table 19: Latin America Market Value (USD Billion) Forecast by Vitamin Type, 2020 to 2035
  • Table 20: Latin America Market Volume (Million Units) Forecast by Vitamin Type, 2020 to 2035
  • Table 21: Latin America Market Value (USD Billion) Forecast by Source Type, 2020 to 2035
  • Table 22: Latin America Market Volume (Million Units) Forecast by Source Type, 2020 to 2035
  • Table 23: Latin America Market Value (USD Billion) Forecast by Application, 2020 to 2035
  • Table 24: Latin America Market Volume (Million Units) Forecast by Application, 2020 to 2035
  • Table 25: Western Europe Market Value (USD Billion) Forecast by Country, 2020 to 2035
  • Table 26: Western Europe Market Volume (Million Units) Forecast by Country, 2020 to 2035
  • Table 27: Western Europe Market Value (USD Billion) Forecast by Vitamin Type, 2020 to 2035
  • Table 28: Western Europe Market Volume (Million Units) Forecast by Vitamin Type, 2020 to 2035
  • Table 29: Western Europe Market Value (USD Billion) Forecast by Source Type, 2020 to 2035
  • Table 30: Western Europe Market Volume (Million Units) Forecast by Source Type, 2020 to 2035
  • Table 31: Western Europe Market Value (USD Billion) Forecast by Application, 2020 to 2035
  • Table 32: Western Europe Market Volume (Million Units) Forecast by Application, 2020 to 2035
  • Table 33: Eastern Europe Market Value (USD Billion) Forecast by Country, 2020 to 2035
  • Table 34: Eastern Europe Market Volume (Million Units) Forecast by Country, 2020 to 2035
  • Table 35: Eastern Europe Market Value (USD Billion) Forecast by Vitamin Type, 2020 to 2035
  • Table 36: Eastern Europe Market Volume (Million Units) Forecast by Vitamin Type, 2020 to 2035
  • Table 37: Eastern Europe Market Value (USD Billion) Forecast by Source Type, 2020 to 2035
  • Table 38: Eastern Europe Market Volume (Million Units) Forecast by Source Type, 2020 to 2035
  • Table 39: Eastern Europe Market Value (USD Billion) Forecast by Application, 2020 to 2035
  • Table 40: Eastern Europe Market Volume (Million Units) Forecast by Application, 2020 to 2035
  • Table 41: East Asia Market Value (USD Billion) Forecast by Country, 2020 to 2035
  • Table 42: East Asia Market Volume (Million Units) Forecast by Country, 2020 to 2035
  • Table 43: East Asia Market Value (USD Billion) Forecast by Vitamin Type, 2020 to 2035
  • Table 44: East Asia Market Volume (Million Units) Forecast by Vitamin Type, 2020 to 2035
  • Table 45: East Asia Market Value (USD Billion) Forecast by Source Type, 2020 to 2035
  • Table 46: East Asia Market Volume (Million Units) Forecast by Source Type, 2020 to 2035
  • Table 47: East Asia Market Value (USD Billion) Forecast by Application, 2020 to 2035
  • Table 48: East Asia Market Volume (Million Units) Forecast by Application, 2020 to 2035
  • Table 49: South Asia & Pacific Market Value (USD Billion) Forecast by Country, 2020 to 2035
  • Table 50: South Asia & Pacific Market Volume (Million Units) Forecast by Country, 2020 to 2035
  • Table 51: South Asia & Pacific Market Value (USD Billion) Forecast by Vitamin Type, 2020 to 2035
  • Table 52: South Asia & Pacific Market Volume (Million Units) Forecast by Vitamin Type, 2020 to 2035
  • Table 53: South Asia & Pacific Market Value (USD Billion) Forecast by Source Type, 2020 to 2035
  • Table 54: South Asia & Pacific Market Volume (Million Units) Forecast by Source Type, 2020 to 2035
  • Table 55: South Asia & Pacific Market Value (USD Billion) Forecast by Application, 2020 to 2035
  • Table 56: South Asia & Pacific Market Volume (Million Units) Forecast by Application, 2020 to 2035
  • Table 57: Middle East and Africa Market Value (USD Billion) Forecast by Country, 2020 to 2035
  • Table 58: Middle East and Africa Market Volume (Million Units) Forecast by Country, 2020 to 2035
  • Table 59: Middle East and Africa Market Value (USD Billion) Forecast by Vitamin Type, 2020 to 2035
  • Table 60: Middle East and Africa Market Volume (Million Units) Forecast by Vitamin Type, 2020 to 2035
  • Table 61: Middle East and Africa Market Value (USD Billion) Forecast by Source Type, 2020 to 2035
  • Table 62: Middle East and Africa Market Volume (Million Units) Forecast by Source Type, 2020 to 2035
  • Table 63: Middle East and Africa Market Value (USD Billion) Forecast by Application, 2020 to 2035
  • Table 64: Middle East and Africa Market Volume (Million Units) Forecast by Application, 2020 to 2035

List of Figures

  • Figure 1: Global Market Volume (Million Units) Forecast 2020 to 2035
  • Figure 2: Global Market Pricing Analysis
  • Figure 3: Global Market Value (USD Billion) Forecast 2020 to 2035
  • Figure 4: Global Market Value Share and BPS Analysis by Vitamin Type, 2025 and 2035
  • Figure 5: Global Market Y-o-Y Growth Comparison by Vitamin Type, 2025 to 2035
  • Figure 6: Global Market Attractiveness Analysis by Vitamin Type
  • Figure 7: Global Market Value Share and BPS Analysis by Source Type, 2025 and 2035
  • Figure 8: Global Market Y-o-Y Growth Comparison by Source Type, 2025 to 2035
  • Figure 9: Global Market Attractiveness Analysis by Source Type
  • Figure 10: Global Market Value Share and BPS Analysis by Application, 2025 and 2035
  • Figure 11: Global Market Y-o-Y Growth Comparison by Application, 2025 to 2035
  • Figure 12: Global Market Attractiveness Analysis by Application
  • Figure 13: Global Market Value (USD Billion) Share and BPS Analysis by Region, 2025 and 2035
  • Figure 14: Global Market Y-o-Y Growth Comparison by Region, 2025 to 2035
  • Figure 15: Global Market Attractiveness Analysis by Region
  • Figure 16: North America Market Incremental $ Opportunity, 2025 to 2035
  • Figure 17: Latin America Market Incremental $ Opportunity, 2025 to 2035
  • Figure 18: Western Europe Market Incremental $ Opportunity, 2025 to 2035
  • Figure 19: Eastern Europe Market Incremental $ Opportunity, 2025 to 2035
  • Figure 20: East Asia Market Incremental $ Opportunity, 2025 to 2035
  • Figure 21: South Asia & Pacific Market Incremental $ Opportunity, 2025 to 2035
  • Figure 22: Middle East and Africa Market Incremental $ Opportunity, 2025 to 2035
  • Figure 23: North America Market Value Share and BPS Analysis by Country, 2025 and 2035
  • Figure 24: North America Market Value Share and BPS Analysis by Vitamin Type, 2025 and 2035
  • Figure 25: North America Market Y-o-Y Growth Comparison by Vitamin Type, 2025 to 2035
  • Figure 26: North America Market Attractiveness Analysis by Vitamin Type
  • Figure 27: North America Market Value Share and BPS Analysis by Source Type, 2025 and 2035
  • Figure 28: North America Market Y-o-Y Growth Comparison by Source Type, 2025 to 2035
  • Figure 29: North America Market Attractiveness Analysis by Source Type
  • Figure 30: North America Market Value Share and BPS Analysis by Application, 2025 and 2035
  • Figure 31: North America Market Y-o-Y Growth Comparison by Application, 2025 to 2035
  • Figure 32: North America Market Attractiveness Analysis by Application
  • Figure 33: Latin America Market Value Share and BPS Analysis by Country, 2025 and 2035
  • Figure 34: Latin America Market Value Share and BPS Analysis by Vitamin Type, 2025 and 2035
  • Figure 35: Latin America Market Y-o-Y Growth Comparison by Vitamin Type, 2025 to 2035
  • Figure 36: Latin America Market Attractiveness Analysis by Vitamin Type
  • Figure 37: Latin America Market Value Share and BPS Analysis by Source Type, 2025 and 2035
  • Figure 38: Latin America Market Y-o-Y Growth Comparison by Source Type, 2025 to 2035
  • Figure 39: Latin America Market Attractiveness Analysis by Source Type
  • Figure 40: Latin America Market Value Share and BPS Analysis by Application, 2025 and 2035
  • Figure 41: Latin America Market Y-o-Y Growth Comparison by Application, 2025 to 2035
  • Figure 42: Latin America Market Attractiveness Analysis by Application
  • Figure 43: Western Europe Market Value Share and BPS Analysis by Country, 2025 and 2035
  • Figure 44: Western Europe Market Value Share and BPS Analysis by Vitamin Type, 2025 and 2035
  • Figure 45: Western Europe Market Y-o-Y Growth Comparison by Vitamin Type, 2025 to 2035
  • Figure 46: Western Europe Market Attractiveness Analysis by Vitamin Type
  • Figure 47: Western Europe Market Value Share and BPS Analysis by Source Type, 2025 and 2035
  • Figure 48: Western Europe Market Y-o-Y Growth Comparison by Source Type, 2025 to 2035
  • Figure 49: Western Europe Market Attractiveness Analysis by Source Type
  • Figure 50: Western Europe Market Value Share and BPS Analysis by Application, 2025 and 2035
  • Figure 51: Western Europe Market Y-o-Y Growth Comparison by Application, 2025 to 2035
  • Figure 52: Western Europe Market Attractiveness Analysis by Application
  • Figure 53: Eastern Europe Market Value Share and BPS Analysis by Country, 2025 and 2035
  • Figure 54: Eastern Europe Market Value Share and BPS Analysis by Vitamin Type, 2025 and 2035
  • Figure 55: Eastern Europe Market Y-o-Y Growth Comparison by Vitamin Type, 2025 to 2035
  • Figure 56: Eastern Europe Market Attractiveness Analysis by Vitamin Type
  • Figure 57: Eastern Europe Market Value Share and BPS Analysis by Source Type, 2025 and 2035
  • Figure 58: Eastern Europe Market Y-o-Y Growth Comparison by Source Type, 2025 to 2035
  • Figure 59: Eastern Europe Market Attractiveness Analysis by Source Type
  • Figure 60: Eastern Europe Market Value Share and BPS Analysis by Application, 2025 and 2035
  • Figure 61: Eastern Europe Market Y-o-Y Growth Comparison by Application, 2025 to 2035
  • Figure 62: Eastern Europe Market Attractiveness Analysis by Application
  • Figure 63: East Asia Market Value Share and BPS Analysis by Country, 2025 and 2035
  • Figure 64: East Asia Market Value Share and BPS Analysis by Vitamin Type, 2025 and 2035
  • Figure 65: East Asia Market Y-o-Y Growth Comparison by Vitamin Type, 2025 to 2035
  • Figure 66: East Asia Market Attractiveness Analysis by Vitamin Type
  • Figure 67: East Asia Market Value Share and BPS Analysis by Source Type, 2025 and 2035
  • Figure 68: East Asia Market Y-o-Y Growth Comparison by Source Type, 2025 to 2035
  • Figure 69: East Asia Market Attractiveness Analysis by Source Type
  • Figure 70: East Asia Market Value Share and BPS Analysis by Application, 2025 and 2035
  • Figure 71: East Asia Market Y-o-Y Growth Comparison by Application, 2025 to 2035
  • Figure 72: East Asia Market Attractiveness Analysis by Application
  • Figure 73: South Asia & Pacific Market Value Share and BPS Analysis by Country, 2025 and 2035
  • Figure 74: South Asia & Pacific Market Value Share and BPS Analysis by Vitamin Type, 2025 and 2035
  • Figure 75: South Asia & Pacific Market Y-o-Y Growth Comparison by Vitamin Type, 2025 to 2035
  • Figure 76: South Asia & Pacific Market Attractiveness Analysis by Vitamin Type
  • Figure 77: South Asia & Pacific Market Value Share and BPS Analysis by Source Type, 2025 and 2035
  • Figure 78: South Asia & Pacific Market Y-o-Y Growth Comparison by Source Type, 2025 to 2035
  • Figure 79: South Asia & Pacific Market Attractiveness Analysis by Source Type
  • Figure 80: South Asia & Pacific Market Value Share and BPS Analysis by Application, 2025 and 2035
  • Figure 81: South Asia & Pacific Market Y-o-Y Growth Comparison by Application, 2025 to 2035
  • Figure 82: South Asia & Pacific Market Attractiveness Analysis by Application
  • Figure 83: Middle East and Africa Market Value Share and BPS Analysis by Country, 2025 and 2035
  • Figure 84: Middle East and Africa Market Value Share and BPS Analysis by Vitamin Type, 2025 and 2035
  • Figure 85: Middle East and Africa Market Y-o-Y Growth Comparison by Vitamin Type, 2025 to 2035
  • Figure 86: Middle East and Africa Market Attractiveness Analysis by Vitamin Type
  • Figure 87: Middle East and Africa Market Value Share and BPS Analysis by Source Type, 2025 and 2035
  • Figure 88: Middle East and Africa Market Y-o-Y Growth Comparison by Source Type, 2025 to 2035
  • Figure 89: Middle East and Africa Market Attractiveness Analysis by Source Type
  • Figure 90: Middle East and Africa Market Value Share and BPS Analysis by Application, 2025 and 2035
  • Figure 91: Middle East and Africa Market Y-o-Y Growth Comparison by Application, 2025 to 2035
  • Figure 92: Middle East and Africa Market Attractiveness Analysis by Application
  • Figure 93: Global Market - Tier Structure Analysis
  • Figure 94: Global Market - Company Share Analysis

Frequently Asked Questions

What is the projected value of the fat soluble vitamins market in 2025?

The industry value is projected to be USD 4.5 billion in 2025.

What is the forecasted value for the fat soluble vitamins market in 2035?

The forecasted industry value for 2035 is USD 10.5 billion.

What is the CAGR for the fat soluble vitamins market from 2025 to 2035?

The CAGR is 8.9% from 2025 to 2035.

Which vitamin is expected to lead the fat soluble vitamins market in 2035?

Vitamin D is expected to lead with a 38% industry share in 2035.

Which country is expected to experience the highest growth in the fat soluble vitamins market?

India is the leading country with a 9.6% CAGR.

Explore Similar Insights

Future Market Insights

Fat Soluble Vitamins Market