Fat Replacers Market Size and Share Forecast Outlook 2025 to 2035

The fat replacers market is forecast to expand from USD 2.9 billion in 2025 to USD 5.3 billion by 2035 at a 6.2% CAGR over the assessment period.
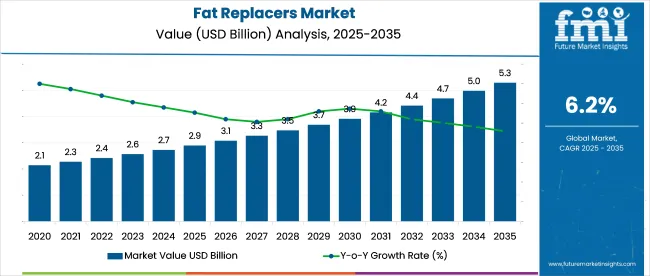
Quick Stats for Fat Replacers Market

  • Industry Value (2025): USD 2.9 billion
  • Forecast Value (2035): USD 5.3 billion
  • Forecast CAGR (2025 to 2035): 6.2%
  • Leading Segment in 2035: Carbohydrate base type (46.3% share)
  • Key Growth Region: North America
  • Key Players: Cargill Inc.; FMC Corporation; Kerry Group Plc.; Tate & Lyle Plc.; Royal DSM N.V; Ashland Global Holdings Inc

Fat Replacers Market Market Value Analysis

Increased application of carbohydrate-based substitutes-projected to account for 46.3% of the industry share-has been influenced by their compatibility with water activity levels and pH conditions in high-moisture food systems. Plant-based sources, expected to hold 58.7% of demand, have been selected for their yield efficiency and performance consistency in emulsion stabilisation and bulk delivery.

In October 2023, Dennis Woodside, President of Impossible Foods, stated, “We've cracked the code on replicating the juicy, fatty texture of ground beef using plants... Our coconut oil-based system melts and sizzles just like animal fat, delivering that craveable experience without the cholesterol.” This quote highlights the company’s success in creating plant-based fat replacers that replicate the texture and functionality of animal fat, a key advancement in the plant-based meat sector.

The industry holds a specific share within its parent markets. In the food additives market, it holds around 4-6%, as fat replacers as a specialized category within food ingredients. Within the food and beverage market, the share is approximately 2-3%, driven by the growing demand for reduced-fat products. In the functional foods market, fat replacers account for about 5-7%, with a focus on creating healthier, functional products.

The health and wellness market contributes around 3-4%, as consumers increasingly seek low-fat alternatives in their diet. The nutraceutical market holds a smaller share of about 2-3%, as fat replacers are used in supplements aimed at weight management and health.

Analysis of Fat Replacers Market by Top Investment Segments

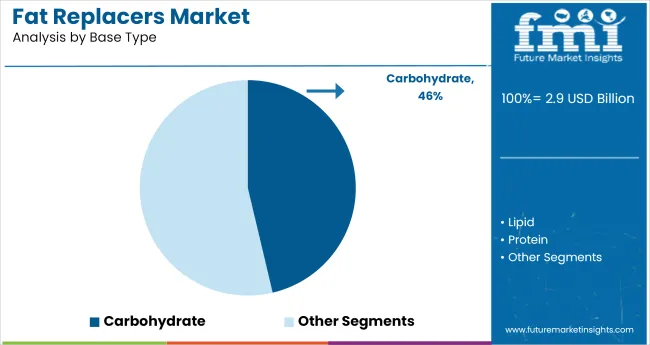
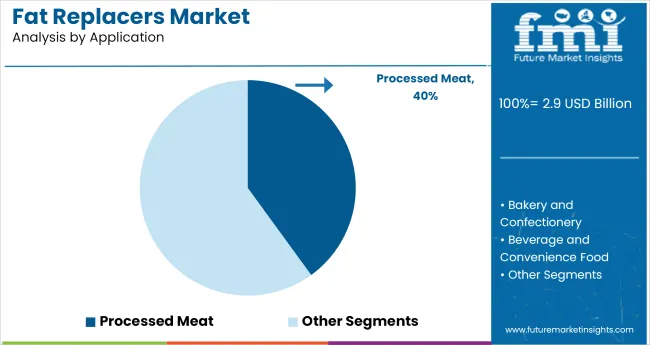
The industry is set for growth, with carbohydrate-based replacers capturing 46.3% industry share in 2025. Plant-based inputs are projected to hold 58.7%, liquid fat replacers will dominate with 55%, and processed meat formulations will account for 40% share.
Carbohydrate matrices drive calorie reduction performance across recipes

Fat Replacers Market Analysis By Base Type

Carbohydrate-based replacers are expected to account for 46.3% of the industry share in 2025. These replacers offer low caloric density, stability under thermal stress, and compatibility with various processing methods. Their gelling and bulking properties allow for the replication of fat mouthfeel without altering key formulation parameters.

Amylopectin and dextrose polymers, for example, form elastic gels that mimic fat-phase lubrication during mastication. High-molecular-weight dextrins support moisture retention in baked snacks, while modified food starch ensures heat tolerance in high-temperature applications like flash frying. Polydextrose reduces calorie load without impacting flavor, making it an ideal choice for bakery lines and frozen meals.
  • Low-caloric-density and stable under thermal stress for various applications
  • Gelling and bulking properties replicate fat mouthfeel in reformulated recipes
  • Polydextrose reduces caloric load while maintaining flavor neutrality

Plant-based inputs address allergen-free reformulation requirements

Fat Replacers Market Analysis By Source

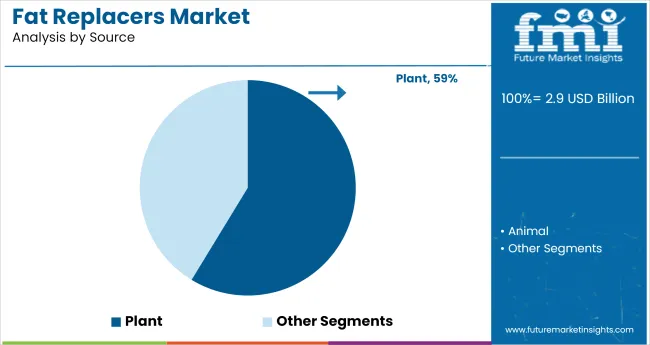
Plant-based replacers are projected to hold 58.7% of the industry share in 2025, driven by the increasing demand for animal-free ingredients, label clarity, and dietary compliance. These plant-based inputs are widely used for textural emulation and emulsification without triggering common allergens like dairy, soy, or gluten.

Pea and chickpea protein isolates are commonly used in emulsions to replace cream-based fats, while oat-derived β-glucans form pseudo-fat structures that support heart-health claims. Soy fiber-cellulose blends mimic meat textures, and sunflower lecithin enhances spreadability and prevents lipid phase separation in cold spreads. The demand for vegan, halal, and kosher labeling also drives this segment’s growth.
  • Pea and chickpea protein isolates replace cream-based fat systems
  • Oat-derived β-glucans contribute to heart-health claims in fat replacers
  • Plant-based inputs allow allergen-free, vegan, and kosher labeling options

Liquid forms enable precise metering in continuous lines

Fat Replacers Market Analysis By Form

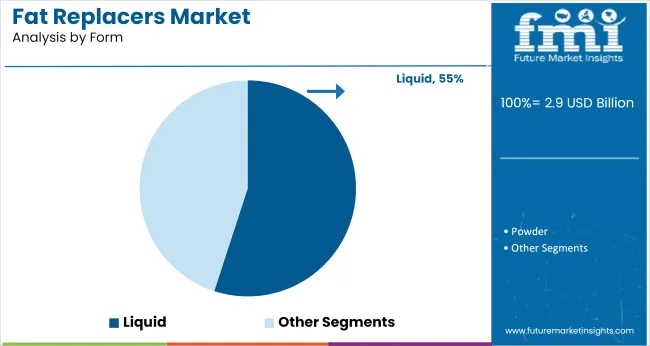
Liquid forms are expected to dominate with 55% of the industry share in 2025. Their high metering precision, enhanced stability, and compatibility with continuous inline processing are key drivers. Liquid-phase systems ensure homogeneous dispersion in products such as dressings, soups, and emulsions for processed meats.

These systems also optimize viscosity for continuous feeding through closed-loop systems, with emulsifier-stabilized blends that eliminate the need for rehydration or pre-mixing. Glycerol and propylene glycol carriers extend shelf life and prevent microbial degradation. Liquid formats also reduce cleanup time in clean-in-place (CIP) systems, improving operational uptime and minimizing labor inputs.
  • High metering precision and stability for continuous inline processing
  • Emulsifier-stabilized blends eliminate pre-mixing and rehydration needs
  • Reduces cleanup time in CIP systems, boosting operational efficiency

Processed-meat formulations adopt fat-replacement to meet label goals

Fat Replacers Market Analysis By Application

Processed meat applications are projected to capture 40% of the industry in 2025, driven by regulatory pressures to reduce fat, saturated fat, and calories per serving. These replacers help manufacturers meet label claims without compromising product structure or sensory qualities. Konjac-based hydrogel systems simulate animal fat mouthfeel, improving cooking yields in ground meat products.

Micro-emulsified oils allow sausages to withstand smokehouse treatments while maintaining thermal performance. Sodium alginate-fiber blends preserve cohesion in low-fat cold cuts and deli meats, and collagen-mimicking plant fibers offer comparable bite resistance to animal fat inclusions. These replacers also ensure texture retention during freezing and reheating.

  • Konjac-based hydrogel systems simulate fat mouthfeel in meat products
  • Micro-emulsified oils retain thermal performance in reformed sausages
  • Plant fibers provide bite resistance and texture retention in processed meats

Top Fat Replacers Market Dynamics

The industry is driven by rising demand for low-fat claims and precise ingredient integration, particularly in sauces, spreads, and snacks. However, challenges such as aeration collapse and heat stability issues in high-heat applications like baking and frying limit broader adoption, particularly in commercial bakery and QSR sectors.

Low-Fat Claims Fuel Precision Ingredient Integration

The industry is growing as stricter labeling regulations in regions like the EU and Canada push brands to meet low-fat and reduced-fat criteria without compromising texture. Ingredients like modified starches, whey protein concentrates, and micro-particulated egg whites are being integrated into products like sauces, spreads, and snack fillings.

Companies like Tate & Lyle and Ingredion are increasing production of enzyme-treated starch blends that are optimized for cold-fill and bake-stable products. Retailers now require sensory parity with full-fat versions, with documentation of fat reduction percentages and mouthfeel equivalence becoming crucial for product acceptance.

  • Stricter labeling regulations for low-fat and reduced-fat claims are driving fat replacer adoption.
  • Modified starches and protein concentrates are being integrated to maintain texture and reduce fat.
  • Retailers now require sensory panels and documentation of fat reduction for product acceptance.

Functional Gaps in Aeration and Heat Stability Limiting Use

Despite advancements, fat replacers still face limitations in bakery and frying systems where aeration and heat tolerance are critical. Carbohydrate- and protein-based substitutes fail to deliver the same mouthfeel and texture when exposed to high heat, such as in laminated doughs or frying applications. These replacers often collapse under high temperatures, resulting in poor volume, soggy textures, or compromised crispiness. Due to these functional gaps, quick-service restaurants (QSR) and commercial bakeries are restricting the use of these replacers to cold-processed applications or fillings.
  • Fat replacers struggle with aeration collapse in laminated dough, limiting their use in bakery lines.
  • Heat stability issues restrict fat replacers from being used in frying applications, such as in QSR formulations.
  • The inability to deliver dual functionality across applications hinders the widespread use of fat replacers in commercial systems.

Top Countries Developing, Formulating, and Supplying Fat Replacers

Country Wise Analysis Of Fat Replacers Market

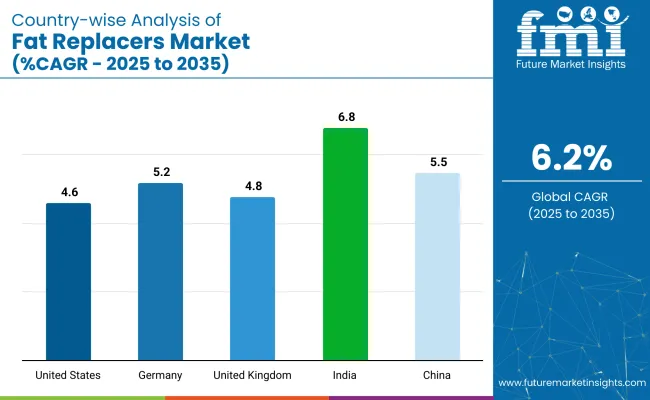
Countries CAGR (2025 to 2035)
United States 4.6%
Germany 5.2%
United Kingdom 4.8%
China 5.5%
India 6.8%

Analysis shows that the fat replacer demand to climb 6.2% annually from 2025 to 2035. India leads at 6.8%, a +26% premium driven by trans-fat bans and starch mimetics in snacks across its BRICS corridor. China’s 5.5% (+2%) is buoyed by weight-management drinks and low-oil condiments endorsed in diet guidelines.

Germany’s 5.2% sits 4% below baseline as OECD dairy-analog plants adopt microparticulated whey amid debate on saturated-fat levies. The United Kingdom posts 4.8% (-11%), where HFSS rules spur fibre bulking agents but cost pressure tempers bakery reformulation. The United States lags at 4.6% (-15%) as clean-label emulsifiers outshine carbohydrate replacers. The report covers detailed analysis of 40+ countries and the top five countries have been shared as a reference.

Growth Outlook for Fat Replacers Market in the United States

The United States industry is projected to expand at a CAGR of 4.6% through 2035. Growth is being reinforced by national dietary guidelines that prioritize calorie reduction and by reformulation programs pursued across packaged snacks, dairy analogues, and quick-service offerings. Brands have embraced carbohydrate-based fat mimetics and structured lipids to replicate mouthfeel while meeting clean-label criteria demanded by health-conscious shoppers.

Regulatory clarity from the FDA regarding permissible ingredient labeling has lowered reformulation risk, and venture funding has been directed toward novel lipid-protein complexes that improve organoleptic performance in baked goods and frozen desserts-ensuring consistent adoption downstream in food-service procurement.

  • Reduced-fat cheese launches intensified after GRAS notices covered soluble fiber-lipid complexes.
  • Private-label snack lines adopted maize-derived dextrins to cut fat up to 30% without textural loss.
  • Corporate wellness programs promoted low-fat prepared meals, accelerating institutional demand.

Future Trajectory of Fat Replacers Market in Germany

The sales of industry in Germany are forecast to register a CAGR of 5.2% between 2025 and 2035. Progress has been driven by stringent nutritional profiling rules under the Nutri-Score system, which pressures processors to curb lipid content in ready meals and bakery staples.

Investment by ingredient suppliers has targeted oat-derived β-glucan matrices and micro-encapsulated sunflower oleogels that withstand high-temperature baking while preserving crumb softness. Retailers have prioritized reformulated SKUs carrying “light” front-of-pack cues, and scientific consortia funded by the Federal Ministry of Food and Agriculture have validated satiety benefits of fiber-fat hybrids-bolstering consumer confidence and ensuring repeat purchases across discounter chains.

  • Premium artisanal bread makers switched to plant-based oleogel blends to meet A-level Nutri-Score targets.
  • Craft sausage producers integrated inulin-based bulking agents, lowering total fat by 25%.
  • University-industry studies linked chicory-fiber fat mimetics to extended shelf-life in chilled pastries.

Demand Forecast for Fat Replacers Market in the United Kingdom

The United Kingdom industry is anticipated to witness a CAGR of 4.8% during 2025 to 2035. Reformulation pledges under the UK Food Industry Responsibility Deal have incentivized caloric trimming in convenience foods, with fat-replacement technologies leveraged to maintain indulgent texture.

Retailers have emphasized front-of-pack traffic-light labeling, prompting widespread uptake of tapioca-based fat mimetics and pea-protein emulsions that stabilize reduced-fat spreads. Import duties on specialty oils have encouraged domestic R&D into rapeseed-derived structured lipids, while the Food Standards Agency’s salt-and-fat reduction campaigns have heightened consumer scrutiny-accelerating the shift toward lower-fat ready meals and impulse snacks across supermarket chains.

  • Bakery chains introduced scone recipes using resistant-starch gels, cutting saturated fat by 40%.
  • Ice-cream brands adopted pea-protein-starch complexes for creamy mouthfeel at 30% lower fat.
  • Government-funded pilot plants scaled oleogel production, reducing dependence on imported palm oil.

Expansion Prospects for Fat Replacers Market in China

The industry in China is set to advance at a CAGR of 5.5% over the forecast period. Dietary Guidelines for Chinese Residents have encouraged lower-fat cooking practices, boosting demand for lipid-alternative ingredients in instant noodles, bakery, and dairy drinks. Domestic fermentation firms have developed konjac-glucomannan gels and rice-based dextrins that align with local palate preferences.

The Healthy China 2030 initiative has prompted public canteens to overhaul menus using calorie-reduced sauces, and e-commerce platforms have highlighted “light” product tags-accelerating diffusion of fat-substitution technologies throughout Tier-1 and Tier-2 cities.

  • Instant-noodle producers integrated konjac-derived hydrocolloids, trimming oil sachet fat by 35%.
  • Beverage firms launched low-fat yogurt drinks featuring rice-dextrin mouthfeel enhancers.
  • Provincial subsidies backed plant-protein oleogel research to cut hydrogenated fat imports.

Growth Analysis of Fat Replacers Market in India

Sales in India are forecast to increase at a CAGR of 6.8% till 2035. Demand is being catalyzed by heightened incidence of lifestyle-related ailments, pushing packaged-food players to reformulate traditional snacks and dairy sweets. Indigenous research institutions have optimized guar-gum and chickpea-protein complexes that deliver creamy texture at reduced lipid content, while price volatility in edible oils has encouraged processors to hedge with carbohydrate-based bulking agents.

The Food Safety and Standards Authority of India’s push for trans-fat elimination has further accelerated substitution in bakery shortening and street-food frying mediums, channeling investment toward scalable fat-mimetic production capacity.
  • Mithai producers shifted to chickpea-protein gels, lowering ghee usage in popular sweets.
  • Ready-to-cook paratha brands employed guar-gum oleogels, cutting saturated fat by 28%.
  • Regional snack chains adopted rice-bran wax oleogels to stabilize fillings in fried rolls.

Leading Suppliers in the Fat Replacers Industry

Fat Replacers Market Analysis By Company

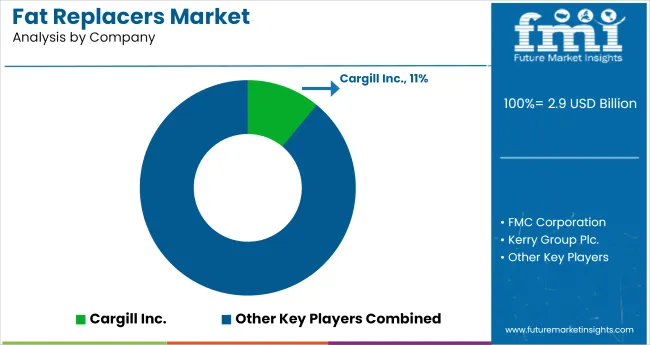
The industry is dominated by companies like Cargill Inc., FMC Corporation, and Kerry Group Plc., which lead through innovation and extensive product offerings. Cargill and Ingredion focus on developing these replacers for a number of applications, including low-fat and reduced-calorie products, while FMC and Ashland Global Holdings invest in technologies to create plant-based fat alternatives.

Tate & Lyle and Royal DSM use functional ingredients that enhance the texture and mouthfeel of reduced-fat foods. The industry is moderately fragmented, with large firms competing on scale, R&D, and distribution, while smaller players continue to innovate in niche areas.

Recent Industry News

  • UK-based startup Microlub introduced protein microgels that reduce fat content by up to 75% without compromising taste or texture, addressing consumer demand for healthier food options.
  • Researchers at PolyU developed AkkMore™, a fungus-based fat replacer aimed at preventing obesity and enhancing gut health, in collaboration with Hotel ICON to promote environmental innovation in the food industry.

Key Players

  • Cargill Inc.
  • FMC Corporation
  • Kerry Group Plc.
  • Tate & Lyle Plc.
  • Royal DSM N.V
  • Ashland Global Holdings Inc.
  • Archer Daniels Midland Company
  • Ingredion Incorporated
  • Corbion N.V
  • Associated British Foods Plc.

Report Coverage and Scope Summary

Report Attributes Key Insights
Estimated Industry Value (2025) USD 2.9 billion
Projected Industry Value (2035) USD 5.3 billion
CAGR (2025 to 2035) 6.2%
Base Year for Estimation 2024
Historical Period 2020 to 2024
Forecast Period 2025 to 2035
Quantitative Units Revenue in USD billion, million units for volume
Base Type Carbohydrate, Lipid, Protein, Others
Source Plant, Animal
Form Liquid, Powder
Application Processed Meat, Bakery and Confectionery, Beverage and Convenience Food
Region North America, Latin America, Europe, Middle East and Africa, East Asia, South Asia, and Oceania
Countries Covered United States, Canada, Mexico, Brazil, Argentina, Germany, France, United Kingdom, Italy, Spain, Netherlands, China, India, Japan, South Korea, ANZ, GCC Countries, South Africa
Key Players Cargill Inc., FMC Corporation, Kerry Group Plc., Tate & Lyle Plc., Royal DSM N.V, Ashland Global Holdings Inc., Archer Daniels Midland Company, Ingredion Incorporated, Corbion N.V, Associated British Foods Plc.
Additional Attributes Dollar sales, CAGR trends, product type segmentation, regional growth patterns, competitor dollar sales & industry share, price range segmentation, application-specific demand, distribution channel analysis

Top Investment Segments Analyzed

By Base Type:

By base type, the industry is segmented into carbohydrate, lipid, protein, and others.

By Source:

By source, the industry includes plant and animal.

By Form:

By form, the industry is bifurcated into liquid and powder.

By Application:

By application, the industry is segmented into processed meat, bakery and confectionery, beverage, and convenience food.

By Region:

By region, the region is analyzed by North America, Latin America, Europe, Middle East and Africa, East Asia, South Asia, and Oceania.

Table of Content

  1. Executive Summary
    • Global Market Outlook
    • Demand-side Trends
    • Supply-side Trends
    • Technology Roadmap Analysis
    • Analysis and Recommendations
  2. Market Overview
    • Market Coverage / Taxonomy
    • Market Definition / Scope / Limitations
  3. Market Background
    • Market Dynamics
      • Drivers
      • Restraints
      • Opportunity
      • Trends
    • Scenario Forecast
      • Demand in Optimistic Scenario
      • Demand in Likely Scenario
      • Demand in Conservative Scenario
    • Opportunity Map Analysis
    • Product Life Cycle Analysis
    • Supply Chain Analysis
      • Supply Side Participants and their Roles
        • Producers
        • Mid-Level Participants (Traders/ Agents/ Brokers)
        • Wholesalers and Distributors
      • Value Added and Value Created at Node in the Supply Chain
      • List of Raw Material Suppliers
      • List of Existing and Potential Buyer’s
    • Investment Feasibility Matrix
    • Value Chain Analysis
      • Profit Margin Analysis
      • Wholesalers and Distributors
      • Retailers
    • PESTLE and Porter’s Analysis
    • Regulatory Landscape
      • By Key Regions
      • By Key Countries
    • Regional Parent Market Outlook
    • Production and Consumption Statistics
    • Import and Export Statistics
  4. Global Market Analysis 2020 to 2024 and Forecast, 2025 to 2035
    • Historical Market Size Value (USD Billion) & Million Units Analysis, 2020 to 2024
    • Current and Future Market Size Value (USD Billion) & Million Units Projections, 2025 to 2035
      • Y-o-Y Growth Trend Analysis
      • Absolute $ Opportunity Analysis
  5. Global Market Pricing Analysis 2020 to 2024 and Forecast 2025 to 2035
  6. Global Market Analysis 2020 to 2024 and Forecast 2025 to 2035, By Base Type
    • Introduction / Key Findings
    • Historical Market Size Value (USD Billion) & Million Units Analysis By Base Type, 2020 to 2024
    • Current and Future Market Size Value (USD Billion) & Million Units Analysis and Forecast By Base Type, 2025 to 2035
      • Carbohydrate
      • Lipid
      • Protein
      • Others
    • Y-o-Y Growth Trend Analysis By Base Type, 2020 to 2024
    • Absolute $ Opportunity Analysis By Base Type, 2025 to 2035
  7. Global Market Analysis 2020 to 2024 and Forecast 2025 to 2035, By Source
    • Introduction / Key Findings
    • Historical Market Size Value (USD Billion) & Million Units Analysis By Source, 2020 to 2024
    • Current and Future Market Size Value (USD Billion) & Million Units Analysis and Forecast By Source, 2025 to 2035
      • Plant
      • Animal
    • Y-o-Y Growth Trend Analysis By Source, 2020 to 2024
    • Absolute $ Opportunity Analysis By Source, 2025 to 2035
  8. Global Market Analysis 2020 to 2024 and Forecast 2025 to 2035, By Form
    • Introduction / Key Findings
    • Historical Market Size Value (USD Billion) & Million Units Analysis By Form, 2020 to 2024
    • Current and Future Market Size Value (USD Billion) & Million Units Analysis and Forecast By Form, 2025 to 2035
      • Liquid
      • Powder
    • Y-o-Y Growth Trend Analysis By Form, 2020 to 2024
    • Absolute $ Opportunity Analysis By Form, 2025 to 2035
  9. Global Market Analysis 2020 to 2024 and Forecast 2025 to 2035, By Application
    • Introduction / Key Findings
    • Historical Market Size Value (USD Billion) & Million Units Analysis By Application, 2020 to 2024
    • Current and Future Market Size Value (USD Billion) & Million Units Analysis and Forecast By Application, 2025 to 2035
      • Processed Meat
      • Bakery and Confectionery
      • Beverage and Convenience Food
    • Y-o-Y Growth Trend Analysis By Application, 2020 to 2024
    • Absolute $ Opportunity Analysis By Application, 2025 to 2035
  10. Global Market Analysis 2020 to 2024 and Forecast 2025 to 2035, By Region
    • Introduction
    • Historical Market Size Value (USD Billion) & Million Units Analysis By Region, 2020 to 2024
    • Current Market Size Value (USD Billion) & Million Units Analysis and Forecast By Region, 2025 to 2035
      • North America
      • Latin America
      • Western Europe
      • Eastern Europe
      • East Asia
      • South Asia & Pacific
      • Middle East and Africa
    • Market Attractiveness Analysis By Region
  11. North America Market Analysis 2020 to 2024 and Forecast 2025 to 2035, By Country
    • Historical Market Size Value (USD Billion) & Million Units Trend Analysis By Market Taxonomy, 2020 to 2024
    • Market Size Value (USD Billion) & Million Units Forecast By Market Taxonomy, 2025 to 2035
      • By Country
        • USA
        • Canada
        • Mexico
      • By Base Type
      • By Source
      • By Form
      • By Application
    • Market Attractiveness Analysis
      • By Country
      • By Base Type
      • By Source
      • By Form
      • By Application
    • Key Takeaways
  12. Latin America Market Analysis 2020 to 2024 and Forecast 2025 to 2035, By Country
    • Historical Market Size Value (USD Billion) & Million Units Trend Analysis By Market Taxonomy, 2020 to 2024
    • Market Size Value (USD Billion) & Million Units Forecast By Market Taxonomy, 2025 to 2035
      • By Country
        • Brazil
        • Argentina
        • Rest of LATAM
      • By Base Type
      • By Source
      • By Form
      • By Application
    • Market Attractiveness Analysis
      • By Country
      • By Base Type
      • By Source
      • By Form
      • By Application
    • Key Takeaways
  13. Western Europe Market Analysis 2020 to 2024 and Forecast 2025 to 2035, By Country
    • Historical Market Size Value (USD Billion) & Million Units Trend Analysis By Market Taxonomy, 2020 to 2024
    • Market Size Value (USD Billion) & Million Units Forecast By Market Taxonomy, 2025 to 2035
      • By Country
        • Germany
        • Italy
        • France
        • UK
        • Spain
        • BENELUX
        • Nordic
        • Rest of W. Europe
      • By Base Type
      • By Source
      • By Form
      • By Application
    • Market Attractiveness Analysis
      • By Country
      • By Base Type
      • By Source
      • By Form
      • By Application
    • Key Takeaways
  14. Eastern Europe Market Analysis 2020 to 2024 and Forecast 2025 to 2035, By Country
    • Historical Market Size Value (USD Billion) & Million Units Trend Analysis By Market Taxonomy, 2020 to 2024
    • Market Size Value (USD Billion) & Million Units Forecast By Market Taxonomy, 2025 to 2035
      • By Country
        • Russia
        • Hungary
        • Poland
        • Balkan & Baltics
        • Rest of E. Europe
      • By Base Type
      • By Source
      • By Form
      • By Application
    • Market Attractiveness Analysis
      • By Country
      • By Base Type
      • By Source
      • By Form
      • By Application
    • Key Takeaways
  15. East Asia Market Analysis 2020 to 2024 and Forecast 2025 to 2035, By Country
    • Historical Market Size Value (USD Billion) & Million Units Trend Analysis By Market Taxonomy, 2020 to 2024
    • Market Size Value (USD Billion) & Million Units Forecast By Market Taxonomy, 2025 to 2035
      • By Country
        • China
        • Japan
        • South Korea
      • By Base Type
      • By Source
      • By Form
      • By Application
    • Market Attractiveness Analysis
      • By Country
      • By Base Type
      • By Source
      • By Form
      • By Application
    • Key Takeaways
  16. South Asia & Pacific Market Analysis 2020 to 2024 and Forecast 2025 to 2035, By Country
    • Historical Market Size Value (USD Billion) & Million Units Trend Analysis By Market Taxonomy, 2020 to 2024
    • Market Size Value (USD Billion) & Million Units Forecast By Market Taxonomy, 2025 to 2035
      • By Country
        • India
        • Australia & New Zealand
        • ASEAN
        • Rest of SAP
      • By Base Type
      • By Source
      • By Form
      • By Application
    • Market Attractiveness Analysis
      • By Country
      • By Base Type
      • By Source
      • By Form
      • By Application
    • Key Takeaways
  17. Middle East and Africa Market Analysis 2020 to 2024 and Forecast 2025 to 2035, By Country
    • Historical Market Size Value (USD Billion) & Million Units Trend Analysis By Market Taxonomy, 2020 to 2024
    • Market Size Value (USD Billion) & Million Units Forecast By Market Taxonomy, 2025 to 2035
      • By Country
        • GCC Countries
        • Northern Africa
        • South Africa
        • Turkiye
        • Rest of MEA
      • By Base Type
      • By Source
      • By Form
      • By Application
    • Market Attractiveness Analysis
      • By Country
      • By Base Type
      • By Source
      • By Form
      • By Application
    • Key Takeaways
  18. Key Countries Market Analysis
    • USA
      • Pricing Analysis
      • Market Share Analysis, 2024
        • By Base Type
        • By Source
        • By Form
        • By Application
    • Canada
      • Pricing Analysis
      • Market Share Analysis, 2024
        • By Base Type
        • By Source
        • By Form
        • By Application
    • Brazil
      • Pricing Analysis
      • Market Share Analysis, 2024
        • By Base Type
        • By Source
        • By Form
        • By Application
    • Mexico
      • Pricing Analysis
      • Market Share Analysis, 2024
        • By Base Type
        • By Source
        • By Form
        • By Application
    • Argentina
      • Pricing Analysis
      • Market Share Analysis, 2024
        • By Base Type
        • By Source
        • By Form
        • By Application
  19. Market Structure Analysis
    • Competition Dashboard
    • Competition Benchmarking
    • Market Share Analysis of Top Players
      • By Regional
      • By Base Type
      • By Source
      • By Form
      • By Application
  20. Competition Analysis
    • Competition Deep Dive
      • Cargill Inc.
        • Overview
        • Product Portfolio
        • Profitability by Market Segments (Product/Age /Sales Channel/Region)
        • Sales Footprint
        • Strategy Overview
          • Marketing Strategy
          • Product Strategy
          • Channel Strategy
      • FMC Corporation
        • Overview
        • Product Portfolio
        • Profitability by Market Segments (Product/Age /Sales Channel/Region)
        • Sales Footprint
        • Strategy Overview
          • Marketing Strategy
          • Product Strategy
          • Channel Strategy
      • Kerry Group Plc.
        • Overview
        • Product Portfolio
        • Profitability by Market Segments (Product/Age /Sales Channel/Region)
        • Sales Footprint
        • Strategy Overview
          • Marketing Strategy
          • Product Strategy
          • Channel Strategy
      • Tate & Lyle Plc.
        • Overview
        • Product Portfolio
        • Profitability by Market Segments (Product/Age /Sales Channel/Region)
        • Sales Footprint
        • Strategy Overview
          • Marketing Strategy
          • Product Strategy
          • Channel Strategy
      • Royal DSM N.V
        • Overview
        • Product Portfolio
        • Profitability by Market Segments (Product/Age /Sales Channel/Region)
        • Sales Footprint
        • Strategy Overview
          • Marketing Strategy
          • Product Strategy
          • Channel Strategy
      • Ashland Global Holdings Inc.
        • Overview
        • Product Portfolio
        • Profitability by Market Segments (Product/Age /Sales Channel/Region)
        • Sales Footprint
        • Strategy Overview
          • Marketing Strategy
          • Product Strategy
          • Channel Strategy
      • Archer Daniels Midland Company
        • Overview
        • Product Portfolio
        • Profitability by Market Segments (Product/Age /Sales Channel/Region)
        • Sales Footprint
        • Strategy Overview
          • Marketing Strategy
          • Product Strategy
          • Channel Strategy
      • Ingredion Incorporated
        • Overview
        • Product Portfolio
        • Profitability by Market Segments (Product/Age /Sales Channel/Region)
        • Sales Footprint
        • Strategy Overview
          • Marketing Strategy
          • Product Strategy
          • Channel Strategy
      • Corbion N.V
        • Overview
        • Product Portfolio
        • Profitability by Market Segments (Product/Age /Sales Channel/Region)
        • Sales Footprint
        • Strategy Overview
          • Marketing Strategy
          • Product Strategy
          • Channel Strategy
      • Associated British Foods Plc.
        • Overview
        • Product Portfolio
        • Profitability by Market Segments (Product/Age /Sales Channel/Region)
        • Sales Footprint
        • Strategy Overview
          • Marketing Strategy
          • Product Strategy
          • Channel Strategy
  21. Assumptions & Acronyms Used
  22. Research Methodology

List of Tables

  • Table 1: Global Market Value (USD Billion) Forecast by Region, 2020 to 2035
  • Table 2: Global Market Million Units Forecast by Region, 2020 to 2035
  • Table 3: Global Market Value (USD Billion) Forecast by Base Type, 2020 to 2035
  • Table 4: Global Market Million Units Forecast by Base Type, 2020 to 2035
  • Table 5: Global Market Value (USD Billion) Forecast by Source, 2020 to 2035
  • Table 6: Global Market Million Units Forecast by Source, 2020 to 2035
  • Table 7: Global Market Value (USD Billion) Forecast by Form, 2020 to 2035
  • Table 8: Global Market Million Units Forecast by Form, 2020 to 2035
  • Table 9: Global Market Value (USD Billion) Forecast by Application, 2020 to 2035
  • Table 10: Global Market Million Units Forecast by Application, 2020 to 2035
  • Table 11: North America Market Value (USD Billion) Forecast by Country, 2020 to 2035
  • Table 12: North America Market Million Units Forecast by Country, 2020 to 2035
  • Table 13: North America Market Value (USD Billion) Forecast by Base Type, 2020 to 2035
  • Table 14: North America Market Million Units Forecast by Base Type, 2020 to 2035
  • Table 15: North America Market Value (USD Billion) Forecast by Source, 2020 to 2035
  • Table 16: North America Market Million Units Forecast by Source, 2020 to 2035
  • Table 17: North America Market Value (USD Billion) Forecast by Form, 2020 to 2035
  • Table 18: North America Market Million Units Forecast by Form, 2020 to 2035
  • Table 19: North America Market Value (USD Billion) Forecast by Application, 2020 to 2035
  • Table 20: North America Market Million Units Forecast by Application, 2020 to 2035
  • Table 21: Latin America Market Value (USD Billion) Forecast by Country, 2020 to 2035
  • Table 22: Latin America Market Million Units Forecast by Country, 2020 to 2035
  • Table 23: Latin America Market Value (USD Billion) Forecast by Base Type, 2020 to 2035
  • Table 24: Latin America Market Million Units Forecast by Base Type, 2020 to 2035
  • Table 25: Latin America Market Value (USD Billion) Forecast by Source, 2020 to 2035
  • Table 26: Latin America Market Million Units Forecast by Source, 2020 to 2035
  • Table 27: Latin America Market Value (USD Billion) Forecast by Form, 2020 to 2035
  • Table 28: Latin America Market Million Units Forecast by Form, 2020 to 2035
  • Table 29: Latin America Market Value (USD Billion) Forecast by Application, 2020 to 2035
  • Table 30: Latin America Market Million Units Forecast by Application, 2020 to 2035
  • Table 31: Western Europe Market Value (USD Billion) Forecast by Country, 2020 to 2035
  • Table 32: Western Europe Market Million Units Forecast by Country, 2020 to 2035
  • Table 33: Western Europe Market Value (USD Billion) Forecast by Base Type, 2020 to 2035
  • Table 34: Western Europe Market Million Units Forecast by Base Type, 2020 to 2035
  • Table 35: Western Europe Market Value (USD Billion) Forecast by Source, 2020 to 2035
  • Table 36: Western Europe Market Million Units Forecast by Source, 2020 to 2035
  • Table 37: Western Europe Market Value (USD Billion) Forecast by Form, 2020 to 2035
  • Table 38: Western Europe Market Million Units Forecast by Form, 2020 to 2035
  • Table 39: Western Europe Market Value (USD Billion) Forecast by Application, 2020 to 2035
  • Table 40: Western Europe Market Million Units Forecast by Application, 2020 to 2035
  • Table 41: Eastern Europe Market Value (USD Billion) Forecast by Country, 2020 to 2035
  • Table 42: Eastern Europe Market Million Units Forecast by Country, 2020 to 2035
  • Table 43: Eastern Europe Market Value (USD Billion) Forecast by Base Type, 2020 to 2035
  • Table 44: Eastern Europe Market Million Units Forecast by Base Type, 2020 to 2035
  • Table 45: Eastern Europe Market Value (USD Billion) Forecast by Source, 2020 to 2035
  • Table 46: Eastern Europe Market Million Units Forecast by Source, 2020 to 2035
  • Table 47: Eastern Europe Market Value (USD Billion) Forecast by Form, 2020 to 2035
  • Table 48: Eastern Europe Market Million Units Forecast by Form, 2020 to 2035
  • Table 49: Eastern Europe Market Value (USD Billion) Forecast by Application, 2020 to 2035
  • Table 50: Eastern Europe Market Million Units Forecast by Application, 2020 to 2035
  • Table 51: East Asia Market Value (USD Billion) Forecast by Country, 2020 to 2035
  • Table 52: East Asia Market Million Units Forecast by Country, 2020 to 2035
  • Table 53: East Asia Market Value (USD Billion) Forecast by Base Type, 2020 to 2035
  • Table 54: East Asia Market Million Units Forecast by Base Type, 2020 to 2035
  • Table 55: East Asia Market Value (USD Billion) Forecast by Source, 2020 to 2035
  • Table 56: East Asia Market Million Units Forecast by Source, 2020 to 2035
  • Table 57: East Asia Market Value (USD Billion) Forecast by Form, 2020 to 2035
  • Table 58: East Asia Market Million Units Forecast by Form, 2020 to 2035
  • Table 59: East Asia Market Value (USD Billion) Forecast by Application, 2020 to 2035
  • Table 60: East Asia Market Million Units Forecast by Application, 2020 to 2035
  • Table 61: South Asia & Pacific Market Value (USD Billion) Forecast by Country, 2020 to 2035
  • Table 62: South Asia & Pacific Market Million Units Forecast by Country, 2020 to 2035
  • Table 63: South Asia & Pacific Market Value (USD Billion) Forecast by Base Type, 2020 to 2035
  • Table 64: South Asia & Pacific Market Million Units Forecast by Base Type, 2020 to 2035
  • Table 65: South Asia & Pacific Market Value (USD Billion) Forecast by Source, 2020 to 2035
  • Table 66: South Asia & Pacific Market Million Units Forecast by Source, 2020 to 2035
  • Table 67: South Asia & Pacific Market Value (USD Billion) Forecast by Form, 2020 to 2035
  • Table 68: South Asia & Pacific Market Million Units Forecast by Form, 2020 to 2035
  • Table 69: South Asia & Pacific Market Value (USD Billion) Forecast by Application, 2020 to 2035
  • Table 70: South Asia & Pacific Market Million Units Forecast by Application, 2020 to 2035
  • Table 71: Middle East and Africa Market Value (USD Billion) Forecast by Country, 2020 to 2035
  • Table 72: Middle East and Africa Market Million Units Forecast by Country, 2020 to 2035
  • Table 73: Middle East and Africa Market Value (USD Billion) Forecast by Base Type, 2020 to 2035
  • Table 74: Middle East and Africa Market Million Units Forecast by Base Type, 2020 to 2035
  • Table 75: Middle East and Africa Market Value (USD Billion) Forecast by Source, 2020 to 2035
  • Table 76: Middle East and Africa Market Million Units Forecast by Source, 2020 to 2035
  • Table 77: Middle East and Africa Market Value (USD Billion) Forecast by Form, 2020 to 2035
  • Table 78: Middle East and Africa Market Million Units Forecast by Form, 2020 to 2035
  • Table 79: Middle East and Africa Market Value (USD Billion) Forecast by Application, 2020 to 2035
  • Table 80: Middle East and Africa Market Million Units Forecast by Application, 2020 to 2035

List of Figures

  • Figure 1: Global Market Million Units Forecast 2020 to 2035
  • Figure 2: Global Market Pricing Analysis
  • Figure 3: Global Market Value (USD Billion) Forecast 2020 to 2035
  • Figure 4: Global Market Value Share and BPS Analysis by Base Type, 2025 and 2035
  • Figure 5: Global Market Y-o-Y Growth Comparison by Base Type, 2025 to 2035
  • Figure 6: Global Market Attractiveness Analysis by Base Type
  • Figure 7: Global Market Value Share and BPS Analysis by Source, 2025 and 2035
  • Figure 8: Global Market Y-o-Y Growth Comparison by Source, 2025 to 2035
  • Figure 9: Global Market Attractiveness Analysis by Source
  • Figure 10: Global Market Value Share and BPS Analysis by Form, 2025 and 2035
  • Figure 11: Global Market Y-o-Y Growth Comparison by Form, 2025 to 2035
  • Figure 12: Global Market Attractiveness Analysis by Form
  • Figure 13: Global Market Value Share and BPS Analysis by Application, 2025 and 2035
  • Figure 14: Global Market Y-o-Y Growth Comparison by Application, 2025 to 2035
  • Figure 15: Global Market Attractiveness Analysis by Application
  • Figure 16: Global Market Value (USD Billion) Share and BPS Analysis by Region, 2025 and 2035
  • Figure 17: Global Market Y-o-Y Growth Comparison by Region, 2025 to 2035
  • Figure 18: Global Market Attractiveness Analysis by Region
  • Figure 19: North America Market Incremental $ Opportunity, 2025 to 2035
  • Figure 20: Latin America Market Incremental $ Opportunity, 2025 to 2035
  • Figure 21: Western Europe Market Incremental $ Opportunity, 2025 to 2035
  • Figure 22: Eastern Europe Market Incremental $ Opportunity, 2025 to 2035
  • Figure 23: East Asia Market Incremental $ Opportunity, 2025 to 2035
  • Figure 24: South Asia & Pacific Market Incremental $ Opportunity, 2025 to 2035
  • Figure 25: Middle East and Africa Market Incremental $ Opportunity, 2025 to 2035
  • Figure 26: North America Market Value Share and BPS Analysis by Country, 2025 and 2035
  • Figure 27: North America Market Value Share and BPS Analysis by Base Type, 2025 and 2035
  • Figure 28: North America Market Y-o-Y Growth Comparison by Base Type, 2025 to 2035
  • Figure 29: North America Market Attractiveness Analysis by Base Type
  • Figure 30: North America Market Value Share and BPS Analysis by Source, 2025 and 2035
  • Figure 31: North America Market Y-o-Y Growth Comparison by Source, 2025 to 2035
  • Figure 32: North America Market Attractiveness Analysis by Source
  • Figure 33: North America Market Value Share and BPS Analysis by Form, 2025 and 2035
  • Figure 34: North America Market Y-o-Y Growth Comparison by Form, 2025 to 2035
  • Figure 35: North America Market Attractiveness Analysis by Form
  • Figure 36: North America Market Value Share and BPS Analysis by Application, 2025 and 2035
  • Figure 37: North America Market Y-o-Y Growth Comparison by Application, 2025 to 2035
  • Figure 38: North America Market Attractiveness Analysis by Application
  • Figure 39: Latin America Market Value Share and BPS Analysis by Country, 2025 and 2035
  • Figure 40: Latin America Market Value Share and BPS Analysis by Base Type, 2025 and 2035
  • Figure 41: Latin America Market Y-o-Y Growth Comparison by Base Type, 2025 to 2035
  • Figure 42: Latin America Market Attractiveness Analysis by Base Type
  • Figure 43: Latin America Market Value Share and BPS Analysis by Source, 2025 and 2035
  • Figure 44: Latin America Market Y-o-Y Growth Comparison by Source, 2025 to 2035
  • Figure 45: Latin America Market Attractiveness Analysis by Source
  • Figure 46: Latin America Market Value Share and BPS Analysis by Form, 2025 and 2035
  • Figure 47: Latin America Market Y-o-Y Growth Comparison by Form, 2025 to 2035
  • Figure 48: Latin America Market Attractiveness Analysis by Form
  • Figure 49: Latin America Market Value Share and BPS Analysis by Application, 2025 and 2035
  • Figure 50: Latin America Market Y-o-Y Growth Comparison by Application, 2025 to 2035
  • Figure 51: Latin America Market Attractiveness Analysis by Application
  • Figure 52: Western Europe Market Value Share and BPS Analysis by Country, 2025 and 2035
  • Figure 53: Western Europe Market Value Share and BPS Analysis by Base Type, 2025 and 2035
  • Figure 54: Western Europe Market Y-o-Y Growth Comparison by Base Type, 2025 to 2035
  • Figure 55: Western Europe Market Attractiveness Analysis by Base Type
  • Figure 56: Western Europe Market Value Share and BPS Analysis by Source, 2025 and 2035
  • Figure 57: Western Europe Market Y-o-Y Growth Comparison by Source, 2025 to 2035
  • Figure 58: Western Europe Market Attractiveness Analysis by Source
  • Figure 59: Western Europe Market Value Share and BPS Analysis by Form, 2025 and 2035
  • Figure 60: Western Europe Market Y-o-Y Growth Comparison by Form, 2025 to 2035
  • Figure 61: Western Europe Market Attractiveness Analysis by Form
  • Figure 62: Western Europe Market Value Share and BPS Analysis by Application, 2025 and 2035
  • Figure 63: Western Europe Market Y-o-Y Growth Comparison by Application, 2025 to 2035
  • Figure 64: Western Europe Market Attractiveness Analysis by Application
  • Figure 65: Eastern Europe Market Value Share and BPS Analysis by Country, 2025 and 2035
  • Figure 66: Eastern Europe Market Value Share and BPS Analysis by Base Type, 2025 and 2035
  • Figure 67: Eastern Europe Market Y-o-Y Growth Comparison by Base Type, 2025 to 2035
  • Figure 68: Eastern Europe Market Attractiveness Analysis by Base Type
  • Figure 69: Eastern Europe Market Value Share and BPS Analysis by Source, 2025 and 2035
  • Figure 70: Eastern Europe Market Y-o-Y Growth Comparison by Source, 2025 to 2035
  • Figure 71: Eastern Europe Market Attractiveness Analysis by Source
  • Figure 72: Eastern Europe Market Value Share and BPS Analysis by Form, 2025 and 2035
  • Figure 73: Eastern Europe Market Y-o-Y Growth Comparison by Form, 2025 to 2035
  • Figure 74: Eastern Europe Market Attractiveness Analysis by Form
  • Figure 75: Eastern Europe Market Value Share and BPS Analysis by Application, 2025 and 2035
  • Figure 76: Eastern Europe Market Y-o-Y Growth Comparison by Application, 2025 to 2035
  • Figure 77: Eastern Europe Market Attractiveness Analysis by Application
  • Figure 78: East Asia Market Value Share and BPS Analysis by Country, 2025 and 2035
  • Figure 79: East Asia Market Value Share and BPS Analysis by Base Type, 2025 and 2035
  • Figure 80: East Asia Market Y-o-Y Growth Comparison by Base Type, 2025 to 2035
  • Figure 81: East Asia Market Attractiveness Analysis by Base Type
  • Figure 82: East Asia Market Value Share and BPS Analysis by Source, 2025 and 2035
  • Figure 83: East Asia Market Y-o-Y Growth Comparison by Source, 2025 to 2035
  • Figure 84: East Asia Market Attractiveness Analysis by Source
  • Figure 85: East Asia Market Value Share and BPS Analysis by Form, 2025 and 2035
  • Figure 86: East Asia Market Y-o-Y Growth Comparison by Form, 2025 to 2035
  • Figure 87: East Asia Market Attractiveness Analysis by Form
  • Figure 88: East Asia Market Value Share and BPS Analysis by Application, 2025 and 2035
  • Figure 89: East Asia Market Y-o-Y Growth Comparison by Application, 2025 to 2035
  • Figure 90: East Asia Market Attractiveness Analysis by Application
  • Figure 91: South Asia & Pacific Market Value Share and BPS Analysis by Country, 2025 and 2035
  • Figure 92: South Asia & Pacific Market Value Share and BPS Analysis by Base Type, 2025 and 2035
  • Figure 93: South Asia & Pacific Market Y-o-Y Growth Comparison by Base Type, 2025 to 2035
  • Figure 94: South Asia & Pacific Market Attractiveness Analysis by Base Type
  • Figure 95: South Asia & Pacific Market Value Share and BPS Analysis by Source, 2025 and 2035
  • Figure 96: South Asia & Pacific Market Y-o-Y Growth Comparison by Source, 2025 to 2035
  • Figure 97: South Asia & Pacific Market Attractiveness Analysis by Source
  • Figure 98: South Asia & Pacific Market Value Share and BPS Analysis by Form, 2025 and 2035
  • Figure 99: South Asia & Pacific Market Y-o-Y Growth Comparison by Form, 2025 to 2035
  • Figure 100: South Asia & Pacific Market Attractiveness Analysis by Form
  • Figure 101: South Asia & Pacific Market Value Share and BPS Analysis by Application, 2025 and 2035
  • Figure 102: South Asia & Pacific Market Y-o-Y Growth Comparison by Application, 2025 to 2035
  • Figure 103: South Asia & Pacific Market Attractiveness Analysis by Application
  • Figure 104: Middle East and Africa Market Value Share and BPS Analysis by Country, 2025 and 2035
  • Figure 105: Middle East and Africa Market Value Share and BPS Analysis by Base Type, 2025 and 2035
  • Figure 106: Middle East and Africa Market Y-o-Y Growth Comparison by Base Type, 2025 to 2035
  • Figure 107: Middle East and Africa Market Attractiveness Analysis by Base Type
  • Figure 108: Middle East and Africa Market Value Share and BPS Analysis by Source, 2025 and 2035
  • Figure 109: Middle East and Africa Market Y-o-Y Growth Comparison by Source, 2025 to 2035
  • Figure 110: Middle East and Africa Market Attractiveness Analysis by Source
  • Figure 111: Middle East and Africa Market Value Share and BPS Analysis by Form, 2025 and 2035
  • Figure 112: Middle East and Africa Market Y-o-Y Growth Comparison by Form, 2025 to 2035
  • Figure 113: Middle East and Africa Market Attractiveness Analysis by Form
  • Figure 114: Middle East and Africa Market Value Share and BPS Analysis by Application, 2025 and 2035
  • Figure 115: Middle East and Africa Market Y-o-Y Growth Comparison by Application, 2025 to 2035
  • Figure 116: Middle East and Africa Market Attractiveness Analysis by Application
  • Figure 117: Global Market - Tier Structure Analysis
  • Figure 118: Global Market - Company Share Analysis

Frequently Asked Questions

What is the projected value of the fat replacers market in 2025?

The projected valuation of the industry in 2025 is USD 2.9 billion.

What is the forecast value of the fat replacers market by 2035?

The forecast valuation of the industry by 2035 is USD 5.3 billion.

What is the expected CAGR for the fat replacers market from 2025 to 2035?

The expected CAGR for the industry from 2025 to 2035 is 6.2%.

Which segment will lead the fat replacers market in 2035?

The carbohydrate base type segment will lead the industry in 2035, with a 46.3% industry share.

Which country is expected to experience the highest growth in the fat replacers market?

India is expected to experience the highest growth in the industry with a 6.8% CAGR.

Explore Similar Insights

Future Market Insights

Fat Replacers Market