Fat Filled Milk Powder Market Size and Share Forecast Outlook 2025 to 2035

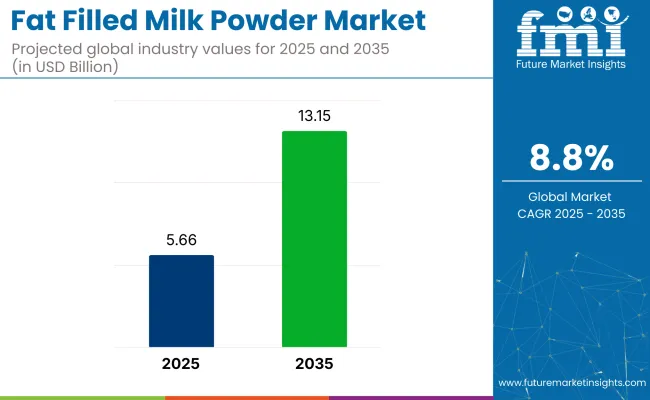
The fat filled milk powder market is projected to expand from USD 5.66 billion in 2025 to USD 13.15 billion by 2035, registering a CAGR of 8.8% throughout the forecast period.
Quick Stats in Fat Filled Milk Powder Market

  • Market Size (2025): USD 5.66 billion
  • Market Forecast (2035): USD 13.15 billion
  • CAGR (2025-2035): 8.8%
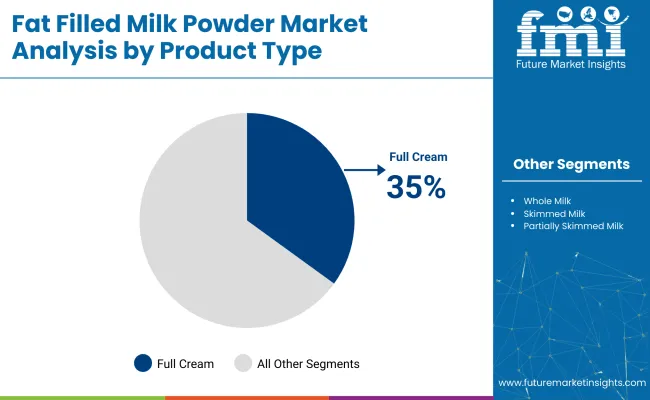
  • Top Product Type: Full Cream Milk Powder (35% share in 2025)
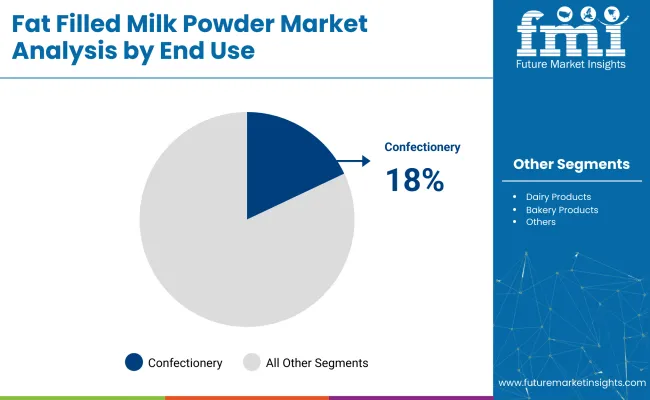
  • Leading End Use: Confectionaries (18% share in 2025)
  • Top Growing Country: India (7.4% CAGR)
  • Key players: Nestlé S.A.; Danone S.A.; Fonterra Co-operative Group Limited; Fries land Campina; Lactalis Group; Arla Foods

Fat Filled Milk Powder Market

Metric Value
Industry Size (2025E) USD 5.66 billion
Industry Value (2035F) USD 13.15 billion
CAGR (2025 to 2035) 8.8%

The market is seeing rising demand, especially in price-sensitive countries. In 2023, EU dairy exports to West Africa exceeded 400,000 metric tons, with FFMP making up a growing share due to its affordability. Poland, Belgium, and Ireland are among the top EU exporters of FFMP, leveraging lower production costs and palm oil import access.

Algeria alone imported over 150,000 tons of FFMP, sourced mainly through EU trade routes. According to UN Comtrade, Vietnam’s imports of FFMP rose by 18% in 2022, reflecting increased use in processed foods and beverages.

New Zealand and Malaysia are expanding their blending facilities, targeting Southeast Asia’s urbanizing markets. In Bangladesh, FFMP now accounts for over 35% of total dairy imports, supported by government subsidies on dairy-based infant and adult nutrition products. These shifts reflect how FFMP has become a strategic substitute in food processing, driven by both price volatility and changing dietary habits.

The fat-filled milk powder (FFMP) market holds specific shares within its parent markets. In the dairy ingredients market, it accounts for around 6-8%, as FFMP is a key product within the broader dairy sector. Within the food and beverage market, the share is approximately 3-5%, driven by its use in cost-effective dairy applications like confectionery and beverages.

In the infant nutrition market, FFMP holds about 4-6%, mainly used in infant formula as an affordable alternative to whole milk powder. The animal feed market contributes around 2-3%, with FFMP serving as a nutritional supplement. The retail market holds a share of 4-6%, driven by consumer demand for affordable dairy-based products.

2025: Fat Filled Milk Powder Market Consumption by Region

The fat filled milk powder market in 2025 operates across region-specific formats and application channels. In Saudi Arabia and Nigeria, bulk product formats are utilized in bakery preparation, vending whitener operations, and confectionery base lines within non-refrigerated foodservice segments.

In the Netherlands and Belgium, fat filled milk powders are integrated into condensed and chocolate manufacturing systems designated for export processing. In North America, the product remains centered in institutional-scale food manufacturing with low exposure in consumer retail platforms.

  • Bulk usage in Nigeria and Saudi Arabia follows ambient storage models
  • Netherlands and Belgium integrate product into export-focused dairy units
  • North America maintains industrial-grade contracts with minimal retail exposure
  • Packaged SKUs are standardized for process consistency across plants

Powder Logistics and Industry Packaging Applications in Fat Filled Milk Powder

Logistics networks in Southeast Asia manage product movement through standardized ambient transportation and handling structures. Packaging formats are designed for commissary repacking, retail presentation, and bulk storage rotations.
  • 25-kg bags are deployed to food outlets in Vietnam, Indonesia, and the Philippines
  • Shelf-stable cartons are managed in ambient bulk flow setups
  • Local retail repacks are presented under private-label SKUs
  • Bulk service packs are rotated through metropolitan warehouse units

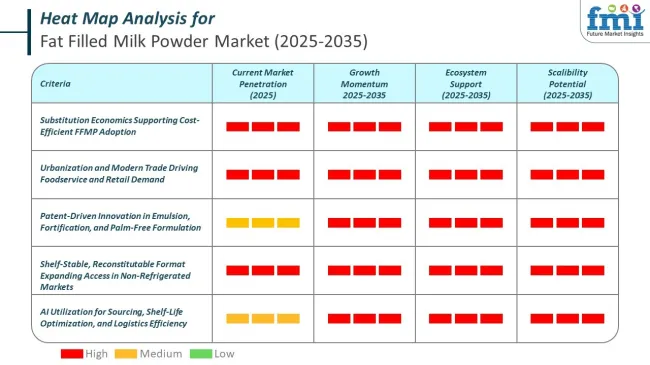
Heat Map For Fat Filled Milk Powder Market

Analyzing Fat Filled Milk Powder Market by Top Investment Segments

Fat filled milk powder with 28% protein content is projected to secure a 28% share by 2025. Full cream variants will dominate the product type segment with 35% share. Among distribution channels, supermarkets and hypermarkets will account for 40% share, while confectionaries are expected to lead the end-use segment at 18%.

28% Protein Content to Dominate the Protein Content Segment with 28% Market Share

Fat filled milk powder with 28% protein content is expected to contribute 28% to global sales by 2025, driven by demand from low-cost dairy alternatives in food processing. Producers favor this content level for meeting nutritional labeling standards while keeping manufacturing costs competitive.

  • Food processors and bakeries commonly choose 28% protein powders for their balance of texture, mouthfeel, and emulsification.
  • Expanding middle-class populations in Asia and Africa are fueling consumption of affordable, protein-enriched milk powder solutions.

Full Cream Milk Powder to Lead the Product Type Segment with 35% Market Share

Full cream fat filled milk powder is projected to account for 35% of the market share by 2025, supported by rising demand in bakery and dairy-based product applications.Its creamy consistency and high fat content make it ideal for confectionery fillings and milk-based beverages.
  • Developing markets in the Middle East and Africa increasingly prefer full cream formulations to meet consumer taste expectations.
  • Value-added product lines and rising infant nutrition demand are further driving adoption across private-label and retail brands.

Fat Filled Milk Powder Market By Product Type

Supermarkets and Hypermarkets to Dominate the Distribution Channel Segment with 40% Market Share

Supermarkets and hypermarkets are expected to secure 40% market share by 2025, reflecting growing consumer preference for convenient access to household dairy ingredients.Expanded cold chain infrastructure and wider retail footprints are improving product visibility and shelf stability.

  • Retailers are increasingly offering both domestic and imported brands, providing greater variety to health-conscious consumers.
  • In-store promotions and bulk discounts are encouraging regular purchases, particularly in regions with high family consumption rates.

Confectionaries to Lead the End Use Segment with 18% Market Share

Confectionaries are anticipated to hold 18% market share by 2025, supported by strong integration of fat filled milk powder in creams, fillings, and chocolate-based products.The ingredient provides a cost-effective substitute for whole milk without sacrificing richness or taste.
  • Growth in artisanal and packaged confectionery segments is increasing demand from manufacturers across Europe and Asia.
  • Rising global demand for affordable indulgence snacks is prompting formulators to use fat filled powders for consistency and scalability.

Fat Filled Milk Powder Market By End Use

Top Fat Filled Milk Powder Market Dynamics

The market is expanding steadily as price-sensitive regions substitute whole milk powder with affordable dairy-fat alternatives. In 2024, global FFMP consumption surpassed 2.4 million metric tons, with high uptake in West Africa, the Middle East, and Southeast Asia.

High Adoption in Dairy Reconstitution, Bakery, and Beverage Segments

FFMP is widely used to manufacture reconstituted milk, sweetened beverages, and ice creams in markets with limited access to fresh dairy. In Nigeria, over 85% of milk powder imports fall under the fat filled category. Cost savings of up to 30% compared to whole milk powder are prompting large-scale bakeries in Asia to switch formulas.

  • Used in tea whiteners and UHT beverages across South Asia and MENA.
  • Adopted by biscuit and bread producers to achieve longer shelf stability.
  • Preferred in powdered drink blends due to high solubility and fat content.

Price Volatility in Dairy Fat Driving Market Substitution

Fluctuations in butterfat prices have made FFMP a stable-cost alternative. In 2023, global dairy fat prices rose 19.6%, leading many processors to reformulate with palm-based fat blends. EU-origin FFMP is increasingly exported to price-sensitive destinations through government-backed trade incentives and bilateral dairy agreements.
  • Cost-stable versus whole milk powder during dairy fat price surges.
  • Utilized by importers in Africa to stabilize food costs amid currency shifts.
  • Backed by EU subsidies to compete with Oceania and US dairy powders.

Top Countries Producing, Importing, and Formulating Fat Filled Milk Powder

Country Wise Analysis Of Fat Filled Milk Powder Market

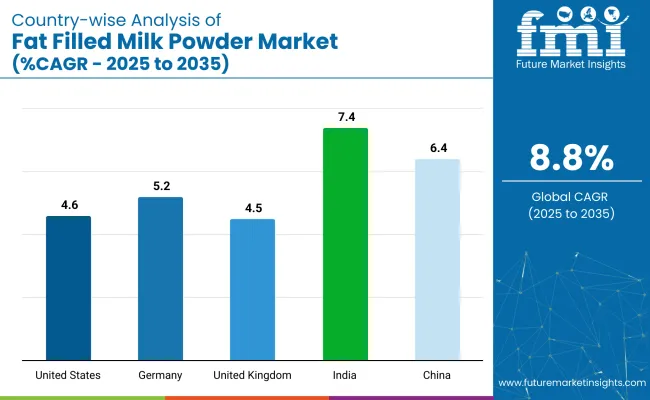
The report provides insights across 40+ countries. The five below are highlighted for their strategic influence and growth trajectory.

Countries CAGR (2025 to 2035)
India 7.4%
China 6.4%
Germany 5.2%
United States 4.6%
United Kingdom 4.5%

The market is set to grow at 8.8% CAGR from 2025 to 2035, with growth across key regions. In the United States market is projected to expand at 4.6% CAGR, driven by FDA regulations promoting reduced-fat dairy use and tariff reductions under USMCA. Federal support for price stability and FFMP integration into long-term contracts also bolsters the market.

Germany follows with a 5.2% CAGR, benefiting from the National Reformulation Strategy and EU regulations phasing out industrial trans fats. KfW loans support investment in modern equipment, accelerating FFMP adoption.

In the BRICS group, India is growing at 7.4% CAGR, with FSSAI regulations boosting transparency on vegetable-fat content and export incentives under the TMA scheme. China, expanding at 6.4% CAGR, benefits from zero tariffs on FFMP imports under updated FTAs and government subsidies for FFMP use in milk beverages.

The United Kingdom, part of the OECD, is expected to see a 4.5% CAGR. Growth is being driven by tariff-free dairy imports from New Zealand. FFMP processing is being improved with help from UK government grants. Reconstitution methods are being upgraded to support local manufacturers. Across OECD regions, adoption is being influenced by new trade policies and financial support for exports.

Market Trends for Fat Filled Milk Powder in India

India is expected to expand at a CAGR of 7.4% through 2035, fueled by rising demand from institutional buyers in the bakery, confectionery, and tea-processing sectors. Imports are declining as Indian manufacturers such as Amul and Schreiber Dynamix scale domestic production using vegetable fat blends.

Affordable price points have made fat filled powder more attractive than SMP (skimmed milk powder) in southern and eastern states. Government support for value-added dairy exports has opened new sales channels in Africa and Southeast Asia.

  • Food processors shifting to cost-efficient fat filled formulations
  • Vegetable fat blends reducing raw milk dependency
  • Export incentives supporting long shelf-life dairy trade

Demand Forecast for Fat Filled Milk Powder in China

China’s market is projected to grow at a CAGR of 6.4% through 2035, supported by increasing use in reconstituted dairy drinks and milk-based desserts. Urban demand is being driven by bakery chains, cafés, and school nutrition programs.

Domestic producers in Hebei and Heilongjiang are expanding their use of palm fat and local milk solids. The ongoing crackdown on adulterated dairy imports has elevated trust in locally produced fat filled products. Growth is being further aided by cold chain development in inland provinces.

  • Bakery and café chains using reconstituted blends for foamed milk
  • Localized fat sourcing improving brand trust in domestic regions
  • Inland logistics enabling shelf-stable dairy expansion

Growth Outlook for Fat Filled Milk Powder in Germany

Germany’s fat filled milk powder market is projected to grow at a CAGR of 5.2% through 2035, driven by increased demand in nutritionally balanced, long-life food products. German dairy cooperatives are offering low-cholesterol variants suited for infant cereals, soups, and sports drinks.

Producers are investing in EU-certified, palm-free formulations in response to clean-label trends. Exports to North Africa and the Middle East are expanding as buyers favor fortified and functional dairy alternatives. Government support for sustainable dairy practices is reinforcing consumer trust.

  • Palm-free variants gaining shelf space in sports nutrition and infant foods
  • EU-compliant, clean-label products targeting export markets
  • Co-ops focusing on extended shelf-life powders for institutional use

Fat Filled Milk Powder Trends in the United States

The USA market is forecast to grow at a CAGR of 4.6% through 2035. Demand is rising among private-label brands and contract foodservice operators seeking cost-effective alternatives to whole milk powder.

Midwest processors are blending dairy solids with coconut or palm-based fat for use in powdered creamer, ice cream mixes, and nutritional supplements. Domestic consumption is concentrated in value-added and industrial applications, while export growth is modest. Regulatory clarity on vegetable fat usage is helping improve product labeling and acceptance.

  • Midwestern firms producing fat blends for creamer and dessert mixes
  • Regulatory shifts allowing broader acceptance of mixed-fat products
  • Contract manufacturers supplying low-cost formulations to institutional buyers

Consumption Drivers for Fat Filled Milk Powder in the United Kingdom

The UK is projected to grow at a CAGR of 4.5% through 2035. Fat filled milk powder is increasingly used in private-label hot drink mixes, affordable dairy spreads, and bakery fillings. Manufacturers are reducing import reliance by blending Irish milk solids with vegetable fat alternatives in local plants.

Cost pressures from inflation have made fat filled variants more attractive than traditional dairy bases. Retailers are promoting fortified formulations to meet low-income household nutrition targets. Growth is led by demand for stable, versatile dairy components in affordable food lines.

  • Fortified powders used in private-label hot chocolate and tea blends
  • Vegetable fat blends helping to manage cost volatility in dairy sourcing
  • Local production reducing dependency on imported whole milk powder

Leading Fat Filled Milk Powder Providers

The market is led by players like Nestlé S.A., Danone S.A., Fonterra Co-operative Group, and Fries land Campina, who dominate through broad product portfolios and extensive global reach. These companies focus on developing a variety of fat-filled milk powders for different segments, including baby food, dairy products, and bakery applications.

Lactalis Group, Arla Foods, and Dairy Farmers of America invest in product innovation and expanding their market presence through strategic acquisitions and partnerships. Smaller players like Agropur Cooperative and Olam International are carving out niches by targeting emerging markets and offering specialized products. The market is fragmented, with competition driven by both large multinational firms and regional players pushing for innovation and local market penetration.

Recent Fat Filled Milk Powder Industry News

In January 2025, Fries land Campina announced a planned merger with Belgian dairy cooperative Milcobel, aiming to finalize integration by mid-year. The deal, still subject to regulatory and shareholder approvals, is set to create a €14 billion dairy giant with operations across 30 countries. The combined entity will be supported by over 11,000 dairy farms, strengthening its global supply network and product reach.

In June 2025, Lactalis Ingredients received regulatory clearance from the USA Department of Justice to complete its USD 2.1 billion acquisition of General Mills’ USA yogurt business. This acquisition marks a significant expansion of Lactalis’ presence in North America and enhances its branded dairy portfolio.

Leading Players in Fat Filled Milk Powder Market

  • Nestlé S.A.
  • Danone S.A.
  • Fonterra Co-operative Group Limited
  • Fries land Campina
  • Lactalis Group
  • Arla Foods
  • Dairy Farmers of America, Inc.
  • Saputo Inc.
  • Glanbia plc
  • Kraft Heinz Company
  • Murray Goulburn Co-operative Co. Limited
  • Agropur Cooperative
  • Olam International
  • China Mengniu Dairy Company Limited
  • Yili Industrial Group Company Limited

Report Coverage and Scope Summary

Report Attributes Key Insights
Estimated Market Value (2025) USD 5.66 billion
Projected Market Value (2035) USD 13.15 billion
CAGR (2025 to 2035) 8.8%
Base Year for Estimation 2024
Historical Period 2020 to 2024
Forecast Period 2025 to 2035
Quantitative Units Revenue in USD billion
Protein Content 24% protein content and 28% protein content.
Product Type Full cream milk powder, whole milk powder, skimmed milk powder, partially skimmed milk powder.
Distribution Channel Supermarkets & hypermarkets, Convenience stores, Department stores, Specialty stores, Online
End Use Dairy products, Bakery products, Confectionaries, Ice cream, Others
Region North America, Latin America, Eastern Europe, Western Europe, East Asia, South Asia & Pacific, Central Asia, Balkan and Baltic Countries, Russia & Belarus, Middle East & Africa
Countries Covered United States, Canada, Mexico, Brazil, Argentina, Germany, France, United Kingdom, Italy, Spain, Netherlands, China, India, Japan, South Korea, ANZ, GCC Countries, South Africa
Key Players Nestlé S.A., Danone S.A., Fonterra Co-operative Group Limited, Fries land Campina, Lactalis Group, Arla Foods, Dairy Farmers of America, Inc., Saputo Inc., Glanbia plc, Kraft Heinz Company, Murray Goulburn Co-operative Co. Limited, Agropur Cooperative, Olam International, China Mengniu Dairy Company Limited, Yili Industrial Group Company Limited
Additional Attributes Dollar sales growth, CAGR trends, product type distribution, consumer preferences, size segmentation, price range segmentation, competitor dollar sales & market share, regional growth patterns

Key Segments

By Protein Content:

The segmentation is into 24% protein content and 28% protein content.

By Product Type:

The segmentation is into full cream milk powder, whole milk powder, skimmed milk powder, partially skimmed milk powder.

By Distribution Channel:

The segmentation is into supermarkets and hypermarkets, convenience stores, department stores, specialty stores, and online.

By End Use:

The segmentation is into dairy products, bakery products, confectionaries, ice cream, and others.

By Region:

The segmentation is into North America, Latin America, Eastern Europe, Western Europe, East Asia, South Asia & Pacific, Central Asia, Balkan and Baltic Countries, Russia & Belarus, and the Middle East & Africa.

Table of Content

  1. Executive Summary
    • Global Market Outlook
    • Demand-side Trends
    • Supply-side Trends
    • Technology Roadmap Analysis
    • Analysis and Recommendations
  2. Market Overview
    • Market Coverage/Taxonomy
    • Market Definition/Scope/Limitations
  3. Market Background
    • Market Dynamics
      • Drivers
      • Restraints
      • Opportunity
      • Trends
    • Scenario Forecast
      • Demand in Optimistic Scenario
      • Demand in Likely Scenario
      • Demand in Conservative Scenario
    • Opportunity Map Analysis
    • Product Life Cycle Analysis
    • Supply Chain Analysis
      • Supply Side Participants and their Roles
        • Producers
        • Mid-Level Participants (Traders/ Agents/ Brokers)
        • Wholesalers and Distributors
      • Value Added and Value Created at Node in the Supply Chain
      • List of Raw Material Suppliers
      • List of Existing and Potential Buyer’s
    • Investment Feasibility Matrix
    • Value Chain Analysis
      • Profit Margin Analysis
      • Wholesalers and Distributors
      • Retailers
    • PESTLE and Porter’s Analysis
    • Regulatory Landscape
      • By Key Regions
      • By Key Countries
    • Regional Parent Market Outlook
    • Production and Consumption Statistics
    • Import and Export Statistics
  4. Global Market Analysis 2020 to 2024 and Forecast, 2025 to 2035
    • Historical Market Size Value (USD Billion) & Volume (Metric tons) Analysis, 2020 to 2024
    • Current and Future Market Size Value (USD Billion) & Volume (Metric tons) Projections, 2025 to 2035
      • Y-o-Y Growth Trend Analysis
      • Absolute $ Opportunity Analysis
  5. Global Market Pricing Analysis 2020 to 2024 and Forecast 2025 to 2035
  6. Global Market Analysis 2020 to 2024 and Forecast 2025 to 2035, By Protein Content
    • Introduction/Key Findings
    • Historical Market Size Value (USD Billion) & Volume (Metric tons) Analysis By Protein Content, 2020 to 2024
    • Current and Future Market Size Value (USD Billion) & Volume (Metric tons) Analysis and Forecast By Protein Content, 2025 to 2035
      • 24% Protein Content
      • 28% Protein Content
    • Y-o-Y Growth Trend Analysis By Protein Content, 2020 to 2024
    • Absolute $ Opportunity Analysis By Protein Content, 2025 to 2035
  7. Global Market Analysis 2020 to 2024 and Forecast 2025 to 2035, By Product Type
    • Introduction/Key Findings
    • Historical Market Size Value (USD Billion) & Volume (Metric tons) Analysis By Product Type, 2020 to 2024
    • Current and Future Market Size Value (USD Billion) & Volume (Metric tons) Analysis and Forecast By Product Type, 2025 to 2035
      • Full Cream Milk Powder
      • Whole Milk Powder
      • Skimmed Milk Powder
      • Partially Skimmed Milk Powder
    • Y-o-Y Growth Trend Analysis By Product Type, 2020 to 2024
    • Absolute $ Opportunity Analysis By Product Type, 2025 to 2035
  8. Global Market Analysis 2020 to 2024 and Forecast 2025 to 2035, By Distribution Channel
    • Introduction/Key Findings
    • Historical Market Size Value (USD Billion) & Volume (Metric tons) Analysis By Distribution Channel, 2020 to 2024
    • Current and Future Market Size Value (USD Billion) & Volume (Metric tons) Analysis and Forecast By Distribution Channel, 2025 to 2035
      • Supermarkets & Hypermarkets
      • Convenience Stores
      • Department Stores
      • Specialty Stores
      • Online
    • Y-o-Y Growth Trend Analysis By Distribution Channel, 2020 to 2024
    • Absolute $ Opportunity Analysis By Distribution Channel, 2025 to 2035
  9. Global Market Analysis 2020 to 2024 and Forecast 2025 to 2035, By End Use
    • Introduction/Key Findings
    • Historical Market Size Value (USD Billion) & Volume (Metric tons) Analysis By End Use, 2020 to 2024
    • Current and Future Market Size Value (USD Billion) & Volume (Metric tons) Analysis and Forecast By End Use, 2025 to 2035
      • Dairy Products
      • Bakery Products
      • Confectionaries
      • Ice Cream
      • Others
    • Y-o-Y Growth Trend Analysis By End Use, 2020 to 2024
    • Absolute $ Opportunity Analysis By End Use, 2025 to 2035
  10. Global Market Analysis 2020 to 2024 and Forecast 2025 to 2035, By Region
    • Introduction
    • Historical Market Size Value (USD Billion) & Volume (Metric tons) Analysis By Region, 2020 to 2024
    • Current Market Size Value (USD Billion) & Volume (Metric tons) Analysis and Forecast By Region, 2025 to 2035
      • North America
      • Latin America
      • Western Europe
      • Eastern Europe
      • East Asia
      • South Asia & Pacific
      • Middle East and Africa
    • Market Attractiveness Analysis By Region
  11. North America Market Analysis 2020 to 2024 and Forecast 2025 to 2035, By Country
    • Historical Market Size Value (USD Billion) & Volume (Metric tons) Trend Analysis By Market Taxonomy, 2020 to 2024
    • Market Size Value (USD Billion) & Volume (Metric tons) Forecast By Market Taxonomy, 2025 to 2035
      • By Country
        • USA
        • Canada
        • Mexico
      • By Protein Content
      • By Product Type
      • By Distribution Channel
      • By End Use
    • Market Attractiveness Analysis
      • By Country
      • By Protein Content
      • By Product Type
      • By Distribution Channel
      • By End Use
    • Key Takeaways
  12. Latin America Market Analysis 2020 to 2024 and Forecast 2025 to 2035, By Country
    • Historical Market Size Value (USD Billion) & Volume (Metric tons) Trend Analysis By Market Taxonomy, 2020 to 2024
    • Market Size Value (USD Billion) & Volume (Metric tons) Forecast By Market Taxonomy, 2025 to 2035
      • By Country
        • Brazil
        • Argentina
        • Rest of LATAM
      • By Protein Content
      • By Product Type
      • By Distribution Channel
      • By End Use
    • Market Attractiveness Analysis
      • By Country
      • By Protein Content
      • By Product Type
      • By Distribution Channel
      • By End Use
    • Key Takeaways
  13. Western Europe Market Analysis 2020 to 2024 and Forecast 2025 to 2035, By Country
    • Historical Market Size Value (USD Billion) & Volume (Metric tons) Trend Analysis By Market Taxonomy, 2020 to 2024
    • Market Size Value (USD Billion) & Volume (Metric tons) Forecast By Market Taxonomy, 2025 to 2035
      • By Country
        • Germany
        • Italy
        • France
        • UK
        • Spain
        • BENELUX
        • Nordic
        • Rest of W.Europe
      • By Protein Content
      • By Product Type
      • By Distribution Channel
      • By End Use
    • Market Attractiveness Analysis
      • By Country
      • By Protein Content
      • By Product Type
      • By Distribution Channel
      • By End Use
    • Key Takeaways
  14. Eastern Europe Market Analysis 2020 to 2024 and Forecast 2025 to 2035, By Country
    • Historical Market Size Value (USD Billion) & Volume (Metric tons) Trend Analysis By Market Taxonomy, 2020 to 2024
    • Market Size Value (USD Billion) & Volume (Metric tons) Forecast By Market Taxonomy, 2025 to 2035
      • By Country
        • Russia
        • Hungary
        • Poland
        • Balkan & Baltics
        • Rest of E. Europe
      • By Protein Content
      • By Product Type
      • By Distribution Channel
      • By End Use
    • Market Attractiveness Analysis
      • By Country
      • By Protein Content
      • By Product Type
      • By Distribution Channel
      • By End Use
    • Key Takeaways
  15. East Asia Market Analysis 2020 to 2024 and Forecast 2025 to 2035, By Country
    • Historical Market Size Value (USD Billion) & Volume (Metric tons) Trend Analysis By Market Taxonomy, 2020 to 2024
    • Market Size Value (USD Billion) & Volume (Metric tons) Forecast By Market Taxonomy, 2025 to 2035
      • By Country
        • China
        • Japan
        • South Korea
      • By Protein Content
      • By Product Type
      • By Distribution Channel
      • By End Use
    • Market Attractiveness Analysis
      • By Country
      • By Protein Content
      • By Product Type
      • By Distribution Channel
      • By End Use
    • Key Takeaways
  16. South Asia & Pacific Market Analysis 2020 to 2024 and Forecast 2025 to 2035, By Country
    • Historical Market Size Value (USD Billion) & Volume (Metric tons) Trend Analysis By Market Taxonomy, 2020 to 2024
    • Market Size Value (USD Billion) & Volume (Metric tons) Forecast By Market Taxonomy, 2025 to 2035
      • By Country
        • India
        • Australia & New Zealand
        • ASEAN
        • Rest of SAP
      • By Protein Content
      • By Product Type
      • By Distribution Channel
      • By End Use
    • Market Attractiveness Analysis
      • By Country
      • By Protein Content
      • By Product Type
      • By Distribution Channel
      • By End Use
    • Key Takeaways
  17. Middle East and Africa Market Analysis 2020 to 2024 and Forecast 2025 to 2035, By Country
    • Historical Market Size Value (USD Billion) & Volume (Metric tons) Trend Analysis By Market Taxonomy, 2020 to 2024
    • Market Size Value (USD Billion) & Volume (Metric tons) Forecast By Market Taxonomy, 2025 to 2035
      • By Country
        • GCC Countries
        • Northern Africa
        • South Africa
        • Turkiye
        • Rest of MEA
      • By Protein Content
      • By Product Type
      • By Distribution Channel
      • By End Use
    • Market Attractiveness Analysis
      • By Country
      • By Protein Content
      • By Product Type
      • By Distribution Channel
      • By End Use
    • Key Takeaways
  18. Key Countries Market Analysis
    • USA
      • Pricing Analysis
      • Market Share Analysis, 2024
        • By Protein Content
        • By Product Type
        • By Distribution Channel
        • By End Use
    • Canada
      • Pricing Analysis
      • Market Share Analysis, 2024
        • By Protein Content
        • By Product Type
        • By Distribution Channel
        • By End Use
    • Brazil
      • Pricing Analysis
      • Market Share Analysis, 2024
        • By Protein Content
        • By Product Type
        • By Distribution Channel
        • By End Use
    • Mexico
      • Pricing Analysis
      • Market Share Analysis, 2024
        • By Protein Content
        • By Product Type
        • By Distribution Channel
        • By End Use
    • Argentina
      • Pricing Analysis
      • Market Share Analysis, 2024
        • By Protein Content
        • By Product Type
        • By Distribution Channel
        • By End Use
  19. Market Structure Analysis
    • Competition Dashboard
    • Competition Benchmarking
    • Market Share Analysis of Top Players
      • By Regional
      • By Protein Content
      • By Product Type
      • By Distribution Channel
      • By End Use
  20. Competition Analysis
    • Competition Deep Dive
      • Nestlé S.A.
        • Overview
        • Product Portfolio
        • Profitability by Market Segments (Product/Age /Sales Channel/Region)
        • Sales Footprint
        • Strategy Overview
          • Marketing Strategy
          • Product Strategy
          • Channel Strategy
      • Danone S.A.
        • Overview
        • Product Portfolio
        • Profitability by Market Segments (Product/Age /Sales Channel/Region)
        • Sales Footprint
        • Strategy Overview
          • Marketing Strategy
          • Product Strategy
          • Channel Strategy
      • Fonterra Co-operative Group Limited
        • Overview
        • Product Portfolio
        • Profitability by Market Segments (Product/Age /Sales Channel/Region)
        • Sales Footprint
        • Strategy Overview
          • Marketing Strategy
          • Product Strategy
          • Channel Strategy
      • Fries land Campina
        • Overview
        • Product Portfolio
        • Profitability by Market Segments (Product/Age /Sales Channel/Region)
        • Sales Footprint
        • Strategy Overview
          • Marketing Strategy
          • Product Strategy
          • Channel Strategy
      • Lactalis Group
        • Overview
        • Product Portfolio
        • Profitability by Market Segments (Product/Age /Sales Channel/Region)
        • Sales Footprint
        • Strategy Overview
          • Marketing Strategy
          • Product Strategy
          • Channel Strategy
      • Arla Foods
        • Overview
        • Product Portfolio
        • Profitability by Market Segments (Product/Age /Sales Channel/Region)
        • Sales Footprint
        • Strategy Overview
          • Marketing Strategy
          • Product Strategy
          • Channel Strategy
      • Dairy Farmers of America, Inc.
        • Overview
        • Product Portfolio
        • Profitability by Market Segments (Product/Age /Sales Channel/Region)
        • Sales Footprint
        • Strategy Overview
          • Marketing Strategy
          • Product Strategy
          • Channel Strategy
      • Saputo Inc.
        • Overview
        • Product Portfolio
        • Profitability by Market Segments (Product/Age /Sales Channel/Region)
        • Sales Footprint
        • Strategy Overview
          • Marketing Strategy
          • Product Strategy
          • Channel Strategy
      • Glanbia plc
        • Overview
        • Product Portfolio
        • Profitability by Market Segments (Product/Age /Sales Channel/Region)
        • Sales Footprint
        • Strategy Overview
          • Marketing Strategy
          • Product Strategy
          • Channel Strategy
      • Kraft Heinz Company
        • Overview
        • Product Portfolio
        • Profitability by Market Segments (Product/Age /Sales Channel/Region)
        • Sales Footprint
        • Strategy Overview
          • Marketing Strategy
          • Product Strategy
          • Channel Strategy
      • Murray Goulburn Co-operative Co. Limited
        • Overview
        • Product Portfolio
        • Profitability by Market Segments (Product/Age /Sales Channel/Region)
        • Sales Footprint
        • Strategy Overview
          • Marketing Strategy
          • Product Strategy
          • Channel Strategy
      • Agropur Cooperative
        • Overview
        • Product Portfolio
        • Profitability by Market Segments (Product/Age /Sales Channel/Region)
        • Sales Footprint
        • Strategy Overview
          • Marketing Strategy
          • Product Strategy
          • Channel Strategy
      • Olam International
        • Overview
        • Product Portfolio
        • Profitability by Market Segments (Product/Age /Sales Channel/Region)
        • Sales Footprint
        • Strategy Overview
          • Marketing Strategy
          • Product Strategy
          • Channel Strategy
      • China Mengniu Dairy Company Limited
        • Overview
        • Product Portfolio
        • Profitability by Market Segments (Product/Age /Sales Channel/Region)
        • Sales Footprint
        • Strategy Overview
          • Marketing Strategy
          • Product Strategy
          • Channel Strategy
      • Yili Industrial Group Company Limited
        • Overview
        • Product Portfolio
        • Profitability by Market Segments (Product/Age /Sales Channel/Region)
        • Sales Footprint
        • Strategy Overview
          • Marketing Strategy
          • Product Strategy
          • Channel Strategy
  21. Assumptions & Acronyms Used
  22. Research Methodology

List of Tables

  • Table 1: Global Market Value (USD Billion) Forecast by Region, 2020-2035
  • Table 2: Global Market Volume (Metric tons) Forecast by Region, 2020-2035
  • Table 3: Global Market Value (USD Billion) Forecast by Protein Content, 2020-2035
  • Table 4: Global Market Volume (Metric tons) Forecast by Protein Content, 2020-2035
  • Table 5: Global Market Value (USD Billion) Forecast by Product Type, 2020-2035
  • Table 6: Global Market Volume (Metric tons) Forecast by Product Type, 2020-2035
  • Table 7: Global Market Value (USD Billion) Forecast by Distribution Channel, 2020-2035
  • Table 8: Global Market Volume (Metric tons) Forecast by Distribution Channel, 2020-2035
  • Table 9: Global Market Value (USD Billion) Forecast by End Use, 2020-2035
  • Table 10: Global Market Volume (Metric tons) Forecast by End Use, 2020-2035
  • Table 11: North America Market Value (USD Billion) Forecast by Country, 2020-2035
  • Table 12: North America Market Volume (Metric tons) Forecast by Country, 2020-2035
  • Table 13: North America Market Value (USD Billion) Forecast by Protein Content, 2020-2035
  • Table 14: North America Market Volume (Metric tons) Forecast by Protein Content, 2020-2035
  • Table 15: North America Market Value (USD Billion) Forecast by Product Type, 2020-2035
  • Table 16: North America Market Volume (Metric tons) Forecast by Product Type, 2020-2035
  • Table 17: North America Market Value (USD Billion) Forecast by Distribution Channel, 2020-2035
  • Table 18: North America Market Volume (Metric tons) Forecast by Distribution Channel, 2020-2035
  • Table 19: North America Market Value (USD Billion) Forecast by End Use, 2020-2035
  • Table 20: North America Market Volume (Metric tons) Forecast by End Use, 2020-2035
  • Table 21: Latin America Market Value (USD Billion) Forecast by Country, 2020-2035
  • Table 22: Latin America Market Volume (Metric tons) Forecast by Country, 2020-2035
  • Table 23: Latin America Market Value (USD Billion) Forecast by Protein Content, 2020-2035
  • Table 24: Latin America Market Volume (Metric tons) Forecast by Protein Content, 2020-2035
  • Table 25: Latin America Market Value (USD Billion) Forecast by Product Type, 2020-2035
  • Table 26: Latin America Market Volume (Metric tons) Forecast by Product Type, 2020-2035
  • Table 27: Latin America Market Value (USD Billion) Forecast by Distribution Channel, 2020-2035
  • Table 28: Latin America Market Volume (Metric tons) Forecast by Distribution Channel, 2020-2035
  • Table 29: Latin America Market Value (USD Billion) Forecast by End Use, 2020-2035
  • Table 30: Latin America Market Volume (Metric tons) Forecast by End Use, 2020-2035
  • Table 31: Western Europe Market Value (USD Billion) Forecast by Country, 2020-2035
  • Table 32: Western Europe Market Volume (Metric tons) Forecast by Country, 2020-2035
  • Table 33: Western Europe Market Value (USD Billion) Forecast by Protein Content, 2020-2035
  • Table 34: Western Europe Market Volume (Metric tons) Forecast by Protein Content, 2020-2035
  • Table 35: Western Europe Market Value (USD Billion) Forecast by Product Type, 2020-2035
  • Table 36: Western Europe Market Volume (Metric tons) Forecast by Product Type, 2020-2035
  • Table 37: Western Europe Market Value (USD Billion) Forecast by Distribution Channel, 2020-2035
  • Table 38: Western Europe Market Volume (Metric tons) Forecast by Distribution Channel, 2020-2035
  • Table 39: Western Europe Market Value (USD Billion) Forecast by End Use, 2020-2035
  • Table 40: Western Europe Market Volume (Metric tons) Forecast by End Use, 2020-2035
  • Table 41: Eastern Europe Market Value (USD Billion) Forecast by Country, 2020-2035
  • Table 42: Eastern Europe Market Volume (Metric tons) Forecast by Country, 2020-2035
  • Table 43: Eastern Europe Market Value (USD Billion) Forecast by Protein Content, 2020-2035
  • Table 44: Eastern Europe Market Volume (Metric tons) Forecast by Protein Content, 2020-2035
  • Table 45: Eastern Europe Market Value (USD Billion) Forecast by Product Type, 2020-2035
  • Table 46: Eastern Europe Market Volume (Metric tons) Forecast by Product Type, 2020-2035
  • Table 47: Eastern Europe Market Value (USD Billion) Forecast by Distribution Channel, 2020-2035
  • Table 48: Eastern Europe Market Volume (Metric tons) Forecast by Distribution Channel, 2020-2035
  • Table 49: Eastern Europe Market Value (USD Billion) Forecast by End Use, 2020-2035
  • Table 50: Eastern Europe Market Volume (Metric tons) Forecast by End Use, 2020-2035
  • Table 51: East Asia Market Value (USD Billion) Forecast by Country, 2020-2035
  • Table 52: East Asia Market Volume (Metric tons) Forecast by Country, 2020-2035
  • Table 53: East Asia Market Value (USD Billion) Forecast by Protein Content, 2020-2035
  • Table 54: East Asia Market Volume (Metric tons) Forecast by Protein Content, 2020-2035
  • Table 55: East Asia Market Value (USD Billion) Forecast by Product Type, 2020-2035
  • Table 56: East Asia Market Volume (Metric tons) Forecast by Product Type, 2020-2035
  • Table 57: East Asia Market Value (USD Billion) Forecast by Distribution Channel, 2020-2035
  • Table 58: East Asia Market Volume (Metric tons) Forecast by Distribution Channel, 2020-2035
  • Table 59: East Asia Market Value (USD Billion) Forecast by End Use, 2020-2035
  • Table 60: East Asia Market Volume (Metric tons) Forecast by End Use, 2020-2035
  • Table 61: South Asia & Pacific Market Value (USD Billion) Forecast by Country, 2020-2035
  • Table 62: South Asia & Pacific Market Volume (Metric tons) Forecast by Country, 2020-2035
  • Table 63: South Asia & Pacific Market Value (USD Billion) Forecast by Protein Content, 2020-2035
  • Table 64: South Asia & Pacific Market Volume (Metric tons) Forecast by Protein Content, 2020-2035
  • Table 65: South Asia & Pacific Market Value (USD Billion) Forecast by Product Type, 2020-2035
  • Table 66: South Asia & Pacific Market Volume (Metric tons) Forecast by Product Type, 2020-2035
  • Table 67: South Asia & Pacific Market Value (USD Billion) Forecast by Distribution Channel, 2020-2035
  • Table 68: South Asia & Pacific Market Volume (Metric tons) Forecast by Distribution Channel, 2020-2035
  • Table 69: South Asia & Pacific Market Value (USD Billion) Forecast by End Use, 2020-2035
  • Table 70: South Asia & Pacific Market Volume (Metric tons) Forecast by End Use, 2020-2035
  • Table 71: Middle East and Africa Market Value (USD Billion) Forecast by Country, 2020-2035
  • Table 72: Middle East and Africa Market Volume (Metric tons) Forecast by Country, 2020-2035
  • Table 73: Middle East and Africa Market Value (USD Billion) Forecast by Protein Content, 2020-2035
  • Table 74: Middle East and Africa Market Volume (Metric tons) Forecast by Protein Content, 2020-2035
  • Table 75: Middle East and Africa Market Value (USD Billion) Forecast by Product Type, 2020-2035
  • Table 76: Middle East and Africa Market Volume (Metric tons) Forecast by Product Type, 2020-2035
  • Table 77: Middle East and Africa Market Value (USD Billion) Forecast by Distribution Channel, 2020-2035
  • Table 78: Middle East and Africa Market Volume (Metric tons) Forecast by Distribution Channel, 2020-2035
  • Table 79: Middle East and Africa Market Value (USD Billion) Forecast by End Use, 2020-2035
  • Table 80: Middle East and Africa Market Volume (Metric tons) Forecast by End Use, 2020-2035

List of Figures

  • Figure 1: Global Market Volume (Metric tons) Forecast 2020-2035
  • Figure 2: Global Market Pricing Analysis
  • Figure 3: Global Market Value (USD Billion) Forecast 2020-2035
  • Figure 4: Global Market Value Share and BPS Analysis by Protein Content, 2025 and 2035
  • Figure 5: Global Market Y-o-Y Growth Comparison by Protein Content, 2025-2035
  • Figure 6: Global Market Attractiveness Analysis by Protein Content
  • Figure 7: Global Market Value Share and BPS Analysis by Product Type, 2025 and 2035
  • Figure 8: Global Market Y-o-Y Growth Comparison by Product Type, 2025-2035
  • Figure 9: Global Market Attractiveness Analysis by Product Type
  • Figure 10: Global Market Value Share and BPS Analysis by Distribution Channel, 2025 and 2035
  • Figure 11: Global Market Y-o-Y Growth Comparison by Distribution Channel, 2025-2035
  • Figure 12: Global Market Attractiveness Analysis by Distribution Channel
  • Figure 13: Global Market Value Share and BPS Analysis by End Use, 2025 and 2035
  • Figure 14: Global Market Y-o-Y Growth Comparison by End Use, 2025-2035
  • Figure 15: Global Market Attractiveness Analysis by End Use
  • Figure 16: Global Market Value (USD Billion) Share and BPS Analysis by Region, 2025 and 2035
  • Figure 17: Global Market Y-o-Y Growth Comparison by Region, 2025-2035
  • Figure 18: Global Market Attractiveness Analysis by Region
  • Figure 19: North America Market Incremental $ Opportunity, 2025-2035
  • Figure 20: Latin America Market Incremental $ Opportunity, 2025-2035
  • Figure 21: Western Europe Market Incremental $ Opportunity, 2025-2035
  • Figure 22: Eastern Europe Market Incremental $ Opportunity, 2025-2035
  • Figure 23: East Asia Market Incremental $ Opportunity, 2025-2035
  • Figure 24: South Asia & Pacific Market Incremental $ Opportunity, 2025-2035
  • Figure 25: Middle East and Africa Market Incremental $ Opportunity, 2025-2035
  • Figure 26: North America Market Value Share and BPS Analysis by Country, 2025 and 2035
  • Figure 27: North America Market Value Share and BPS Analysis by Protein Content, 2025 and 2035
  • Figure 28: North America Market Y-o-Y Growth Comparison by Protein Content, 2025-2035
  • Figure 29: North America Market Attractiveness Analysis by Protein Content
  • Figure 30: North America Market Value Share and BPS Analysis by Product Type, 2025 and 2035
  • Figure 31: North America Market Y-o-Y Growth Comparison by Product Type, 2025-2035
  • Figure 32: North America Market Attractiveness Analysis by Product Type
  • Figure 33: North America Market Value Share and BPS Analysis by Distribution Channel, 2025 and 2035
  • Figure 34: North America Market Y-o-Y Growth Comparison by Distribution Channel, 2025-2035
  • Figure 35: North America Market Attractiveness Analysis by Distribution Channel
  • Figure 36: North America Market Value Share and BPS Analysis by End Use, 2025 and 2035
  • Figure 37: North America Market Y-o-Y Growth Comparison by End Use, 2025-2035
  • Figure 38: North America Market Attractiveness Analysis by End Use
  • Figure 39: Latin America Market Value Share and BPS Analysis by Country, 2025 and 2035
  • Figure 40: Latin America Market Value Share and BPS Analysis by Protein Content, 2025 and 2035
  • Figure 41: Latin America Market Y-o-Y Growth Comparison by Protein Content, 2025-2035
  • Figure 42: Latin America Market Attractiveness Analysis by Protein Content
  • Figure 43: Latin America Market Value Share and BPS Analysis by Product Type, 2025 and 2035
  • Figure 44: Latin America Market Y-o-Y Growth Comparison by Product Type, 2025-2035
  • Figure 45: Latin America Market Attractiveness Analysis by Product Type
  • Figure 46: Latin America Market Value Share and BPS Analysis by Distribution Channel, 2025 and 2035
  • Figure 47: Latin America Market Y-o-Y Growth Comparison by Distribution Channel, 2025-2035
  • Figure 48: Latin America Market Attractiveness Analysis by Distribution Channel
  • Figure 49: Latin America Market Value Share and BPS Analysis by End Use, 2025 and 2035
  • Figure 50: Latin America Market Y-o-Y Growth Comparison by End Use, 2025-2035
  • Figure 51: Latin America Market Attractiveness Analysis by End Use
  • Figure 52: Western Europe Market Value Share and BPS Analysis by Country, 2025 and 2035
  • Figure 53: Western Europe Market Value Share and BPS Analysis by Protein Content, 2025 and 2035
  • Figure 54: Western Europe Market Y-o-Y Growth Comparison by Protein Content, 2025-2035
  • Figure 55: Western Europe Market Attractiveness Analysis by Protein Content
  • Figure 56: Western Europe Market Value Share and BPS Analysis by Product Type, 2025 and 2035
  • Figure 57: Western Europe Market Y-o-Y Growth Comparison by Product Type, 2025-2035
  • Figure 58: Western Europe Market Attractiveness Analysis by Product Type
  • Figure 59: Western Europe Market Value Share and BPS Analysis by Distribution Channel, 2025 and 2035
  • Figure 60: Western Europe Market Y-o-Y Growth Comparison by Distribution Channel, 2025-2035
  • Figure 61: Western Europe Market Attractiveness Analysis by Distribution Channel
  • Figure 62: Western Europe Market Value Share and BPS Analysis by End Use, 2025 and 2035
  • Figure 63: Western Europe Market Y-o-Y Growth Comparison by End Use, 2025-2035
  • Figure 64: Western Europe Market Attractiveness Analysis by End Use
  • Figure 65: Eastern Europe Market Value Share and BPS Analysis by Country, 2025 and 2035
  • Figure 66: Eastern Europe Market Value Share and BPS Analysis by Protein Content, 2025 and 2035
  • Figure 67: Eastern Europe Market Y-o-Y Growth Comparison by Protein Content, 2025-2035
  • Figure 68: Eastern Europe Market Attractiveness Analysis by Protein Content
  • Figure 69: Eastern Europe Market Value Share and BPS Analysis by Product Type, 2025 and 2035
  • Figure 70: Eastern Europe Market Y-o-Y Growth Comparison by Product Type, 2025-2035
  • Figure 71: Eastern Europe Market Attractiveness Analysis by Product Type
  • Figure 72: Eastern Europe Market Value Share and BPS Analysis by Distribution Channel, 2025 and 2035
  • Figure 73: Eastern Europe Market Y-o-Y Growth Comparison by Distribution Channel, 2025-2035
  • Figure 74: Eastern Europe Market Attractiveness Analysis by Distribution Channel
  • Figure 75: Eastern Europe Market Value Share and BPS Analysis by End Use, 2025 and 2035
  • Figure 76: Eastern Europe Market Y-o-Y Growth Comparison by End Use, 2025-2035
  • Figure 77: Eastern Europe Market Attractiveness Analysis by End Use
  • Figure 78: East Asia Market Value Share and BPS Analysis by Country, 2025 and 2035
  • Figure 79: East Asia Market Value Share and BPS Analysis by Protein Content, 2025 and 2035
  • Figure 80: East Asia Market Y-o-Y Growth Comparison by Protein Content, 2025-2035
  • Figure 81: East Asia Market Attractiveness Analysis by Protein Content
  • Figure 82: East Asia Market Value Share and BPS Analysis by Product Type, 2025 and 2035
  • Figure 83: East Asia Market Y-o-Y Growth Comparison by Product Type, 2025-2035
  • Figure 84: East Asia Market Attractiveness Analysis by Product Type
  • Figure 85: East Asia Market Value Share and BPS Analysis by Distribution Channel, 2025 and 2035
  • Figure 86: East Asia Market Y-o-Y Growth Comparison by Distribution Channel, 2025-2035
  • Figure 87: East Asia Market Attractiveness Analysis by Distribution Channel
  • Figure 88: East Asia Market Value Share and BPS Analysis by End Use, 2025 and 2035
  • Figure 89: East Asia Market Y-o-Y Growth Comparison by End Use, 2025-2035
  • Figure 90: East Asia Market Attractiveness Analysis by End Use
  • Figure 91: South Asia & Pacific Market Value Share and BPS Analysis by Country, 2025 and 2035
  • Figure 92: South Asia & Pacific Market Value Share and BPS Analysis by Protein Content, 2025 and 2035
  • Figure 93: South Asia & Pacific Market Y-o-Y Growth Comparison by Protein Content, 2025-2035
  • Figure 94: South Asia & Pacific Market Attractiveness Analysis by Protein Content
  • Figure 95: South Asia & Pacific Market Value Share and BPS Analysis by Product Type, 2025 and 2035
  • Figure 96: South Asia & Pacific Market Y-o-Y Growth Comparison by Product Type, 2025-2035
  • Figure 97: South Asia & Pacific Market Attractiveness Analysis by Product Type
  • Figure 98: South Asia & Pacific Market Value Share and BPS Analysis by Distribution Channel, 2025 and 2035
  • Figure 99: South Asia & Pacific Market Y-o-Y Growth Comparison by Distribution Channel, 2025-2035
  • Figure 100: South Asia & Pacific Market Attractiveness Analysis by Distribution Channel
  • Figure 101: South Asia & Pacific Market Value Share and BPS Analysis by End Use, 2025 and 2035
  • Figure 102: South Asia & Pacific Market Y-o-Y Growth Comparison by End Use, 2025-2035
  • Figure 103: South Asia & Pacific Market Attractiveness Analysis by End Use
  • Figure 104: Middle East and Africa Market Value Share and BPS Analysis by Country, 2025 and 2035
  • Figure 105: Middle East and Africa Market Value Share and BPS Analysis by Protein Content, 2025 and 2035
  • Figure 106: Middle East and Africa Market Y-o-Y Growth Comparison by Protein Content, 2025-2035
  • Figure 107: Middle East and Africa Market Attractiveness Analysis by Protein Content
  • Figure 108: Middle East and Africa Market Value Share and BPS Analysis by Product Type, 2025 and 2035
  • Figure 109: Middle East and Africa Market Y-o-Y Growth Comparison by Product Type, 2025-2035
  • Figure 110: Middle East and Africa Market Attractiveness Analysis by Product Type
  • Figure 111: Middle East and Africa Market Value Share and BPS Analysis by Distribution Channel, 2025 and 2035
  • Figure 112: Middle East and Africa Market Y-o-Y Growth Comparison by Distribution Channel, 2025-2035
  • Figure 113: Middle East and Africa Market Attractiveness Analysis by Distribution Channel
  • Figure 114: Middle East and Africa Market Value Share and BPS Analysis by End Use, 2025 and 2035
  • Figure 115: Middle East and Africa Market Y-o-Y Growth Comparison by End Use, 2025-2035
  • Figure 116: Middle East and Africa Market Attractiveness Analysis by End Use
  • Figure 117: Global Market - Tier Structure Analysis
  • Figure 118: Global Market - Company Share Analysis

Frequently Asked Questions

What is the current size of the fat filled milk powder market?

The market is valued at USD 5.66 billion in 2025.

What is the projected market size for fat filled milk powder by 2035?

The market is forecast to reach USD 13.15 billion by 2035.

What is the expected CAGR for the fat filled milk powder market?

The market is projected to grow at a CAGR of 8.8% from 2025 to 2035.

Which is the top product type segment in the fat filled milk powder market?

Instant fat filled milk powder leads with a 57.3% share in 2025.

Which country is expected to lead growth in the fat filled milk powder market?

India is projected to grow the fastest with a CAGR of 10.2% through 2035.

Explore Similar Insights

Future Market Insights

Fat Filled Milk Powder Market

Chat With

MaRIA

Hi There, I am MaRIA, Your Market Research Intelligence Assistant. How may I help you?