Demand and Trends Analysis of Fat Filled Milk Powder in Western Europe - Size and Share Forecast Outlook 2025 to 2035

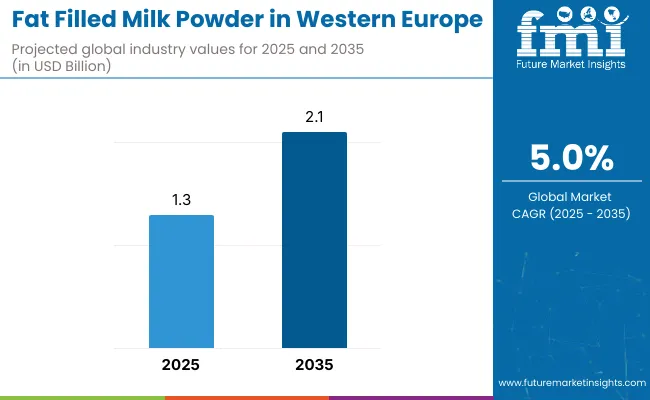
Sales of fat filled milk powder in Western Europe are estimated at USD 1.3 billion in 2025, and are projected to reach USD 2.1 billion by 2035, reflecting a CAGR of approximately 5.0% over the forecast period. This growth reflects expanding convenience food adoption and increased per capita consumption across major urban centers throughout the region. The rise in demand is linked to shifting lifestyle patterns, growing preference for shelf-stable dairy alternatives, and evolving food processing trends.
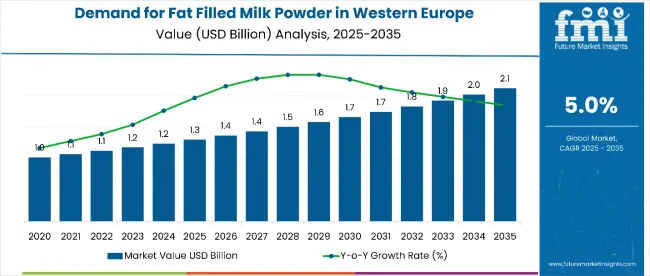
Value Analysis Demand And Trends Analysis Of Fat Filled Milk Powder In Western Europe

Fat Filled Milk Powder Sales Analysis in Western Europe: Key Takeaways

  • Fat Filled Milk Powder Sales in Western Europe Value (2025): USD 1.3 billion
  • Fat Filled Milk Powder in Western Europe Forecast Value (2035): USD 2.1 billion
  • Fat Filled Milk Powder in Western Europe Forecast CAGR (2025 to 2035): 5.0%
  • Leading Segment in Fat Filled Milk Powder Category by Product Type (2025): 28% Fat Content (37%)
  • Leading Segment in Fat Filled Milk Powder Category by End Use (2025): Dairy Products (28.4%)
  • Fastest Growing Countries for Fat Filled Milk Powderin Western Europe: Netherlands and Italy
  • Players in Fat Filled Milk Powder in Western Europe: FrieslandCampina, Arla Foods, Nestlé, Danone, and Fonterra

Demand And Trends Analysis Of Fat Filled Milk Powder In Western Europe

Metric Value
Market Size (2025) USD 1.3 Billion
Market Size (2035) USD 2.1 Billion
CAGR (2025 to 2035) 5.0%

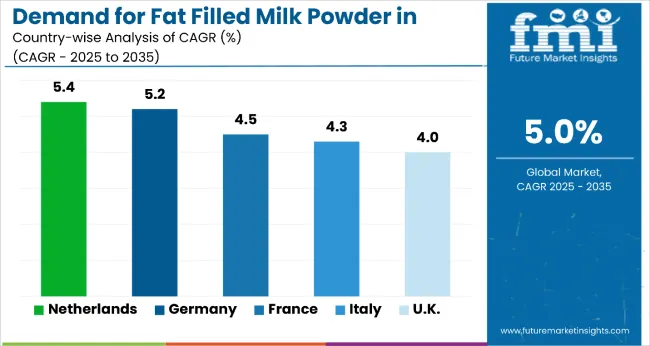
By 2025, per capita consumption in leading Western European countries such as Netherlands, Germany, and France averages between 2.1 to 2.8 kilograms, with projections reaching 3.4 to 4.5 kilograms by 2035. Netherlands leads among individual countries, expected to generate USD 467 million in fat filled milk powder sales by 2035, followed by Germany (USD 421 million), France (USD 378 million), Italy (USD 329 million), and United Kingdom (USD 287 million).

The largest contribution to demand continues to come from 28% fat content products, which are expected to account for 37% of total sales in 2025, owing to optimal nutritional composition, cost-effectiveness compared to whole milk powder, and consumer preference for moderate-fat dairy alternatives. By end use classification, dairy products represent the dominant application, responsible for 28.4% of all sales, while food processing and retail channels are expanding rapidly.

Consumer adoption is particularly concentrated among convenience-oriented households and cost-conscious families, with urbanization levels and disposable income emerging as significant drivers of demand. While pricing remains competitive, the average cost advantage over whole milk powder has stabilized around 20-25% in 2025.

Continued improvements in processing efficiency and supply chain optimization are expected to accelerate affordability and access across diverse income segments. Regional disparities persist, but per capita demand in Southern European countries is narrowing the gap with traditionally strong Northern European consumption patterns.

Analyzing Demand and Trends Analysis of Fat Filled Milk Powder in Western Europe by Top Investment Segments

The fat filled milk powder segment in Western Europe is classified across several categories. By product type, the key segments include 26% fat content, instant 26%, 28% fat content, and instant 28% variants. By end use, the segment spans B2B food processing applications including ice cream, bakery and confectionery, chocolate, beverages, soups, sauces, coffee and tea, and dairy products, as well as B2C retail channels including supermarkets, convenience stores, department stores, specialty stores, and online retail. By country, coverage includes United Kingdom, Germany, France, Italy, Spain, Netherlands, and rest of Western Europe territories.
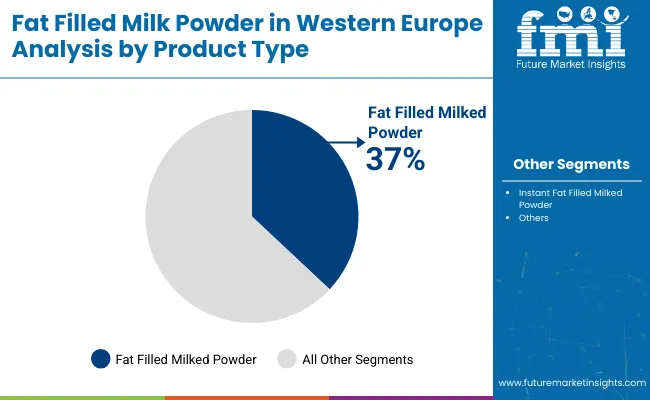
By Product Type, 28% Fat Content to Lead with 37% Share

Demand And Trends Analysis Of Fat Filled Milk Powder In Western Europe By Product

28% fat content variants are projected to dominate sales in 2025, supported by optimal nutritional balance, cost advantages over whole milk powder, and widespread adoption in both retail and food processing applications. Other variants such as 26% and instant formulations are growing steadily, each serving distinct consumption and processing needs.
  • 28% fat content products are expected to hold a 37% value share in 2025, driven by close resemblance to whole milk composition, significant cost savings for consumers and manufacturers, and versatile applications across dairy product manufacturing and household consumption patterns throughout Western Europe.
  • Instant 28% variants are gaining momentum in retail segments, especially among time-pressed urban consumers and working families, supported by convenience factors and increasing penetration in modern retail formats including supermarkets and online grocery platforms.
  • 26% fat content products are showing strong traction in industrial food processing, with 6% annual growth tied to cost optimization and demand for ingredient-grade powders in bakery, confectionery, and beverage manufacturing across Western European food production facilities.
  • Instant 26% formulations appeal to budget-conscious households and are expanding through traditional retail channels and value-oriented distribution, while maintaining adequate nutritional profiles for household beverage preparation and cooking applications.

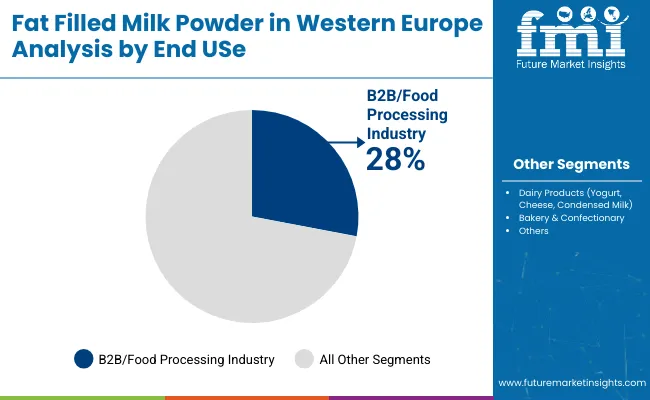
By End Use, Food Processing Industry to Lead with 28% Share

Demand And Trends Analysis Of Fat Filled Milk Powder In Western Europe By End Use4

In 2025, the B2B food processing industry is projected to account for 28% of total fat filled milk powder sales in Western Europe, cementing its position as the leading end-use segment. Its dominance stems from the ingredient’s adaptability across diverse product categories, cost competitiveness against whole milk powder, and ability to deliver consistent quality in large-scale production.

The sector benefits from strong demand in dairy manufacturing, bakery, confectionery, and beverage industries, all of which integrate fat filled milk powder for texture, taste, and nutritional enhancements. Western Europe’s advanced food processing infrastructure and established export further strengthen the segment’s growth prospects over the next decade.
  • Dairy applications dominate within food processing, covering yogurt, cheese, condensed milk, and creamers for both domestic and export.
  • Bakery and confectionery manufacturers rely on it for consistent taste and functionality in breads, pastries, and chocolates.
  • Beverage industry adoption is growing in coffee mixes, flavored drinks, and nutritional beverages.
  • Soups, sauces, and ready meals benefit from its emulsifying and thickening properties.
  • Ice cream and frozen desserts leverage it to maintain premium texture and taste at lower cost.

Demand and Trend Analysis of Fat Filled Milk Powder in Western Europe by Country

Demand And Trends Analysis Of Fat Filled Milk Powder In Western Europe Country Wise Analysis

Country CAGR (2025 to 2035)
Netherlands 5.4%
Germany 5.2%
France 4.5%
Italy 4.3%
UK 4.0%

The Netherlands leads with the highest projected CAGR of 5.4% from 2025 to 2035, supported by advanced production capacity and a strong export orientation. Germany follows closely at 5.2%, driven by its vast industrial processing infrastructure and competitive pricing strategies.

France, with a CAGR of 4.5%, benefits from premium positioning and strong culinary integration, appealing to both domestic and export. Italy is projected to grow at 4.3%, where modernization in processing and expanding exports to Mediterranean are key growth levers. The United Kingdom, at 4.0%, is leveraging retail network expansion and e-commerce adoption to sustain demand.

Fat filled milk powder sales will not grow uniformly across every Western European country. Rising dairy processing capabilities and faster adoption of cost-effective dairy alternatives in traditionally strong dairy regions give Netherlands and Italy a measurable edge, while mature consumer countries such as Germany and France expand more steadily from higher baseline consumption. The table below shows the compound annual growth rate (CAGR) each of the five key countries is expected to record between 2025 and 2035.

Production Capacity Trends in Fat Filled Milk Powder in the Netherlands

Fat filled milk powder in Netherlands lead the highest CAGR of 5.4%, driven by strong production infrastructure and efficient export channels. The country’s well-established dairy processing plants ensure consistent supply to both domestic and international. Its strategic port locations, including Rotterdam, allow easy access to EU and global destinations. Advanced automation in production boosts both volume and quality output.

The Netherlands also leads in R&D investment for product innovation, especially in nutritional fortification and tailored blends. Per capita consumption of dairy products here is among the highest in the region, supporting steady internal demand. Major brands, especially FrieslandCampina, dominate share with integrated farmer-to-market models. The country’s focus on sustainability and green energy adoption in dairy processing enhances its competitive edge globally.

  • Strong export-oriented dairy production base.
  • Advanced processing technology and automation.
  • Strategic location for European and global trade routes.

Output Expansion in Fat Filled Milk Powder in Germany

Sales of fat-filled milk powder in Germany is expected to grow at a CAGR of 5.2%, due to its vast food processing capabilities and large consumer base. High-quality production standards, combined with a diverse range of applications in bakery, confectionery, and beverages, drive consistent demand. Germany benefits from a well-connected logistics network, ensuring efficient supply to both domestic retailers and export destinations.

Retail penetration is exceptionally high, with fat filled milk powder available across supermarkets, hypermarkets, and discount chains. Increasing interest in cost-effective dairy alternatives further boosts the product’s competitiveness. Industrial buyers value the ingredient’s long shelf life and functionality in multiple recipes. Investments in automation and energy-efficient production methods are enhancing Germany’s output capacity. The country is also strengthening its export profile to neighboring EU states, ensuring growth beyond local consumption.

  • Extensive retail distribution and food service channels.
  • Competitive pricing of fat filled milk powder vs. whole milk powder.
  • Adoption in bakery, confectionery, and beverage industries.

Structural Adoption in Fat Filled Milk Powder in France

Revenue of fat-filled milk powder in France is projected to expand at a CAGR of 4.5%, driven by rich culinary traditions and demand for high-quality dairy products. The country integrates the ingredient into both artisanal and industrial production, ensuring broad coverage. Fat filled milk powder is increasingly used in bakery, confectionery, and dessert manufacturing, appealing to both premium and mass-market segments.

France’s export capacity is strong, particularly to French-speaking in Africa and the Middle East. Food service adoption is high, with chefs valuing its stability, taste, and cost benefits. Domestic demand is underpinned by a culture of high dairy consumption and innovation in product formats. Companies in France often focus on premium quality and EU certification compliance, enhancing consumer trust. Ongoing investment in processing technology is also improving efficiency and output consistency.

  • Culinary culture drives demand for quality dairy ingredients.
  • Balanced growth in both retail and industrial uses.
  • Strong dairy export capabilities across Europe and beyond.

Processing Modernization in Fat Filled Milk Powder in Italy

Sales of fat-filled milk powder in Italy is projected to grow at a CAGR of 4.3%, due to modernization in processing facilities, enabling higher efficiency and output quality. The ingredient is increasingly incorporated into traditional Mediterranean recipes, as well as modern convenience foods. Italian manufacturers are adapting their formulations to suit both domestic tastes and export requirements.

Export potential to Mediterranean and Middle Eastern is rising, supported by competitive pricing. Urbanization and busier lifestyles are driving higher retail adoption of shelf-stable dairy alternatives. Ice cream, coffee, and bakery sectors are among the biggest consumers of fat filled milk powder in Italy. Product innovation, including flavor-enhanced variants, is boosting appeal. Government incentives for sustainable manufacturing are further encouraging upgrades in dairy production facilities.

  • Modernization of dairy and food processing facilities.
  • Integration into traditional Mediterranean food products.
  • Expanding export-oriented dairy ingredient production.

Distribution Channel Evolution in Fat Filled Milk Powder in the United Kingdom

Sales of fat-filled milk powder in the United Kingdom is expected to grow at a CAGR of 4.0%, due to its strong retail distribution networks and growing online sales channels. Consumers increasingly value the product’s long shelf life, affordability, and versatility in food preparation. The food service sector is a significant consumer, integrating fat filled milk powder into beverages, desserts, and bakery products.

Competitive pricing compared to whole milk powder is encouraging adoption among both households and industrial users. Online grocery platforms have emerged as a strong growth driver, especially post-pandemic. Retail diversity, from supermarkets to specialty stores, ensures broad accessibility across the UK. Product innovation is also helping brands differentiate in a price-sensitive space. Sustainability initiatives in packaging and sourcing are increasingly influencing purchasing decisions.
  • Shelf-stable products appeal to diverse income groups.
  • Integration into food service and ready-to-eat segments.
  • Established supply chains supporting steady distribution.

Notable Players and Strategies in Western Europe Fat Filled Milk Powder Space

Demand And Trends Analysis Of Fat Filled Milk Powder In Western Europe By Company

The competitive environment is characterized by a mix of established dairy cooperatives and multinational food ingredient suppliers. Processing scale rather than pure product diversity remains the decisive success factor: the five largest suppliers collectively serve more than 25,000 food manufacturers and retailers across the region and account for a majority of both B2B and retail distribution in the category.

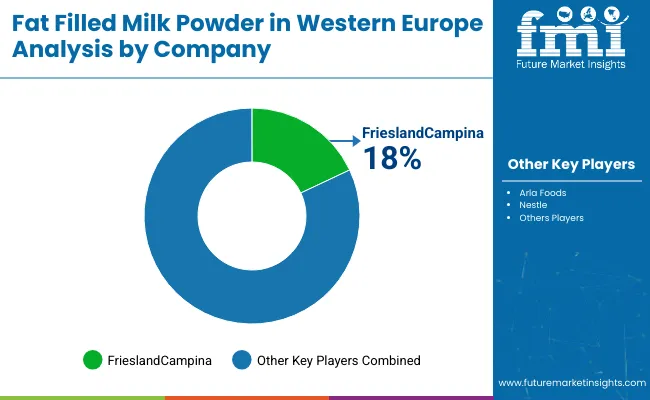
FrieslandCampina is the most established cooperative participant. As a leading European dairy cooperative, the company offers comprehensive fat filled milk powder solutions, all meeting strict European quality standards. Its core range of dairy ingredients and nutritional products gives it deep penetration in food processing channels while maintaining full regional coverage through major retailers and food service distributors.

Arla Foods, with strong Northern European heritage, leverages cooperative scale and sustainability positioning to place premium fat filled milk powder in quality-focused applications and health-conscious consumer segments. Recent investments in sustainable packaging and organic certifications have allowed Arla to introduce premium variants positioned for environmentally aware consumers, reinforcing its role as a responsibility-focused supplier.

The next tier comprises specialized processors and regional dairy companies. Danone focuses on premium applications for health-focused food manufacturing, recent innovation initiatives showed growth in functional ingredient applications, signaling established positioning in value-added segments. Fonterra, expanding through international positioning, adds high-specification fat filled powders to growing export-oriented supply chains and is expected to benefit from increasing demand for reliable global ingredient sourcing.

Private-label programs at major European retailers including Carrefour, Tesco, and REWE are widening consumer access at price points 10-18% below branded equivalents, putting margin pressure on smaller suppliers while supporting household adoption. Consolidation is therefore likely to continue as processing scale and distribution coverage become critical for maintaining retail partnerships and quality consistency in this expanding category.

Key Developments

  • In February 2025, FrieslandCampina introduced a new instant formulation line with enhanced solubility for food service applications, expanding B2B solution offerings.(Source: FrieslandCampina)

Key Players in Western Europe Fat Filled Milk Powder Space

  • FrieslandCampina
  • Arla Foods
  • Nestlé
  • Danone
  • Fonterra
  • Belgomilk
  • Hoogwegt International
  • Milky Holland
  • Vreugdenhil
  • Armor Proteines
  • BONILAIT PROTEINES
  • Alpen Food Group
  • Dale Farm Ltd
  • Lakeland Dairies
  • Holland Dairy Foods
  • Revala Ltd
  • DMK Group
  • Lactalis
  • Saputo
  • Glanbia

Report Scope - Western Europe Fat Filled Milk Powder

Item Value
Quantitative Units (2025) USD 1.3 Billion
By Product Type 26% Fat Content, Instant 26% Fat Content, 28% Fat Content, and Instant 28% Fat Content
By End-Use Application B2B/Food Processing Industry (Ice Cream, Bakery & Confectionery, Chocolate, Fruits & Flavored Beverages, Soups, Sauces, Coffee & Tea, and Dairy Products such as Yogurt, Cheese, Condensed Milk, and B2C/Retail (Supermarkets & Hypermarkets, Convenience Stores, Department Stores, Specialty Stores, and Online Retail)
Regions Covered Western Europe
Country Covered Netherlands, Germany, France, Italy, and United Kingdom
Top Companies Profiled Arla Foods, Alpen Food Group, Dana Dairy, Vreugdenhil, Armor Proteines, BONILAIT PROTEINES, Polindus, Hoogwegt International, Belgomilk, Dale Farm Ltd, Lakeland Diaries, Holland Dairy Foods, and Revala Ltd.
Additional Attributes Cost-effective alternative to whole milk powder, rising adoption in bakery, confectionery, and beverage manufacturing, strong export demand from Western Europe, advancements in dairy processing technology, increasing focus on sustainable and energy-efficient production

Key Segments

By Product Type:

  • Fat Filled Milk Powder 26%
  • Instant Fat Filled Milk Powder 26%
  • Fat Filled Milk Powder 28%
  • Instant Fat Filled Milk Powder 28%

By End Use:

  • B2B / Food Processing Industry
    • Ice Cream
    • Bakery & Confectionary
    • Chocolate
    • Fruits and Flavored Beverages
    • Soups
    • Sauces
    • Coffee and Tea
    • Dairy Products (Yogurt, Cheese, Condensed Milk)
  • B2C / Retail
    • Supermarkets and Hypermarkets
    • Convenience Stores
    • Department Stores
    • Specialty Stores
    • Online Retail

Western Europe - By Country:

  • UK
  • Germany
  • Italy
  • France
  • Spain
  • Rest of Western Europe

Frequently Asked Questions

How big is the demand and trends analysis of fat filled milk powder in Western Europe in 2025?

The global demand and trends analysis of fat filled milk powder in Western Europe is estimated to be valued at USD 1.3 billion in 2025.

What will be the size of demand and trends analysis of fat filled milk powder in Western Europe in 2035?

The market size for the demand and trends analysis of fat filled milk powder in Western Europe is projected to reach USD 2.1 billion by 2035.

How much will be the demand and trends analysis of fat filled milk powder in Western Europe growth between 2025 and 2035?

The demand and trends analysis of fat filled milk powder in Western Europe is expected to grow at a 4.8% CAGR between 2025 and 2035.

What are the key product types in the demand and trends analysis of fat filled milk powder in western europe?

The key product types in demand and trends analysis of fat filled milk powder in Western Europe are fat filled milk powder 26%, instant fat filled milk powder 26%, fat filled milk powder 28% and instant fat filled milk powder 28%.

Which end use segment to contribute significant share in the demand and trends analysis of fat filled milk powder in Western Europe in 2025?

In terms of end use, b2b / food processing industry segment to command 35.5% share in the demand and trends analysis of fat filled milk powder in Western Europe in 2025.

Table of Content

  1. Executive Summary
    • Global Market Outlook
    • Demand-side Trends
    • Supply-side Trends
    • Technology Roadmap Analysis
    • Analysis and Recommendations
  2. Market Overview
    • Market Coverage / Taxonomy
    • Market Definition / Scope / Limitations
  3. Market Background
    • Market Dynamics
      • Drivers
      • Restraints
      • Opportunity
      • Trends
    • Scenario Forecast
      • Demand in Optimistic Scenario
      • Demand in Likely Scenario
      • Demand in Conservative Scenario
    • Opportunity Map Analysis
    • Product Life Cycle Analysis
    • Supply Chain Analysis
    • Investment Feasibility Matrix
    • Value Chain Analysis
    • PESTLE and Porter’s Analysis
    • Regulatory Landscape
    • Regional Parent Market Outlook
    • Production and Consumption Statistics
    • Import and Export Statistics
  4. Global Analysis 2020 to 2024 and Forecast, 2025 to 2035
    • Historical Market Size Value (USD Million) Analysis, 2020 to 2024
    • Current and Future Market Size Value (USD Million) Projections, 2025 to 2035
      • Y-o-Y Growth Trend Analysis
      • Absolute $ Opportunity Analysis
  5. Global Pricing Analysis 2020 to 2024 and Forecast 2025 to 2035
  6. Global Analysis 2020 to 2024 and Forecast 2025 to 2035, By Product Type
    • Introduction / Key Findings
    • Historical Market Size Value (USD Million) Analysis By Product Type , 2020 to 2024
    • Current and Future Market Size Value (USD Million) Analysis and Forecast By Product Type , 2025 to 2035
      • Fat Filled Milk Powder 26%
      • Instant Fat Filled Milk Powder 26%
      • Fat Filled Milk Powder 28%
      • Instant Fat Filled Milk Powder 28%
    • Y-o-Y Growth Trend Analysis By Product Type , 2020 to 2024
    • Absolute $ Opportunity Analysis By Product Type , 2025 to 2035
  7. Global Analysis 2020 to 2024 and Forecast 2025 to 2035, By End Use
    • Introduction / Key Findings
    • Historical Market Size Value (USD Million) Analysis By End Use, 2020 to 2024
    • Current and Future Market Size Value (USD Million) Analysis and Forecast By End Use, 2025 to 2035
      • B2B / Food Processing Industry
        • Ice Cream
        • Bakery & Confectionary
        • Chocolate
        • Fruits And Flavored Beverages
        • Soups
        • Sauces
        • Coffee And Tea
        • Dairy Products (Yogurt, Cheese, Condensed Milk)
      • B2C / Retail
        • Supermarkets And Hypermarkets
        • Convenience Stores
        • Department Stores
        • Specialty Stores
        • Online Retail
    • Y-o-Y Growth Trend Analysis By End Use, 2020 to 2024
    • Absolute $ Opportunity Analysis By End Use, 2025 to 2035
  8. Global Analysis 2020 to 2024 and Forecast 2025 to 2035, By Region
    • Introduction
    • Historical Market Size Value (USD Million) Analysis By Region, 2020 to 2024
    • Current Market Size Value (USD Million) Analysis and Forecast By Region, 2025 to 2035
      • North America
      • Latin America
      • Western Europe
      • Eastern Europe
      • East Asia
      • South Asia and Pacific
      • Middle East & Africa
    • Market Attractiveness Analysis By Region
  9. North America Analysis 2020 to 2024 and Forecast 2025 to 2035, By Country
    • Historical Market Size Value (USD Million) Trend Analysis By Market Taxonomy, 2020 to 2024
    • Market Size Value (USD Million) Forecast By Market Taxonomy, 2025 to 2035
      • By Country
        • USA
        • Canada
        • Mexico
      • By Product Type
      • By End Use
    • Market Attractiveness Analysis
      • By Country
      • By Product Type
      • By End Use
    • Key Takeaways
  10. Latin America Analysis 2020 to 2024 and Forecast 2025 to 2035, By Country
    • Historical Market Size Value (USD Million) Trend Analysis By Market Taxonomy, 2020 to 2024
    • Market Size Value (USD Million) Forecast By Market Taxonomy, 2025 to 2035
      • By Country
        • Brazil
        • Chile
        • Rest of Latin America
      • By Product Type
      • By End Use
    • Market Attractiveness Analysis
      • By Country
      • By Product Type
      • By End Use
    • Key Takeaways
  11. Western Europe Analysis 2020 to 2024 and Forecast 2025 to 2035, By Country
    • Historical Market Size Value (USD Million) Trend Analysis By Market Taxonomy, 2020 to 2024
    • Market Size Value (USD Million) Forecast By Market Taxonomy, 2025 to 2035
      • By Country
        • Germany
        • UK
        • Italy
        • Spain
        • France
        • Nordic
        • BENELUX
        • Rest of Western Europe
      • By Product Type
      • By End Use
    • Market Attractiveness Analysis
      • By Country
      • By Product Type
      • By End Use
    • Key Takeaways
  12. Eastern Europe Analysis 2020 to 2024 and Forecast 2025 to 2035, By Country
    • Historical Market Size Value (USD Million) Trend Analysis By Market Taxonomy, 2020 to 2024
    • Market Size Value (USD Million) Forecast By Market Taxonomy, 2025 to 2035
      • By Country
        • Russia
        • Poland
        • Hungary
        • Balkan & Baltic
        • Rest of Eastern Europe
      • By Product Type
      • By End Use
    • Market Attractiveness Analysis
      • By Country
      • By Product Type
      • By End Use
    • Key Takeaways
  13. East Asia Analysis 2020 to 2024 and Forecast 2025 to 2035, By Country
    • Historical Market Size Value (USD Million) Trend Analysis By Market Taxonomy, 2020 to 2024
    • Market Size Value (USD Million) Forecast By Market Taxonomy, 2025 to 2035
      • By Country
        • China
        • Japan
        • South Korea
      • By Product Type
      • By End Use
    • Market Attractiveness Analysis
      • By Country
      • By Product Type
      • By End Use
    • Key Takeaways
  14. South Asia and Pacific Analysis 2020 to 2024 and Forecast 2025 to 2035, By Country
    • Historical Market Size Value (USD Million) Trend Analysis By Market Taxonomy, 2020 to 2024
    • Market Size Value (USD Million) Forecast By Market Taxonomy, 2025 to 2035
      • By Country
        • India
        • ASEAN
        • Australia & New Zealand
        • Rest of South Asia and Pacific
      • By Product Type
      • By End Use
    • Market Attractiveness Analysis
      • By Country
      • By Product Type
      • By End Use
    • Key Takeaways
  15. Middle East & Africa Analysis 2020 to 2024 and Forecast 2025 to 2035, By Country
    • Historical Market Size Value (USD Million) Trend Analysis By Market Taxonomy, 2020 to 2024
    • Market Size Value (USD Million) Forecast By Market Taxonomy, 2025 to 2035
      • By Country
        • Kingdom of Saudi Arabia
        • Other GCC Countries
        • Turkiye
        • South Africa
        • Other African Union
        • Rest of Middle East & Africa
      • By Product Type
      • By End Use
    • Market Attractiveness Analysis
      • By Country
      • By Product Type
      • By End Use
    • Key Takeaways
  16. Key Countries Analysis
    • USA
      • Pricing Analysis
      • Market Share Analysis, 2024
        • By Product Type
        • By End Use
    • Canada
      • Pricing Analysis
      • Market Share Analysis, 2024
        • By Product Type
        • By End Use
    • Mexico
      • Pricing Analysis
      • Market Share Analysis, 2024
        • By Product Type
        • By End Use
    • Brazil
      • Pricing Analysis
      • Market Share Analysis, 2024
        • By Product Type
        • By End Use
    • Chile
      • Pricing Analysis
      • Market Share Analysis, 2024
        • By Product Type
        • By End Use
    • Germany
      • Pricing Analysis
      • Market Share Analysis, 2024
        • By Product Type
        • By End Use
    • UK
      • Pricing Analysis
      • Market Share Analysis, 2024
        • By Product Type
        • By End Use
    • Italy
      • Pricing Analysis
      • Market Share Analysis, 2024
        • By Product Type
        • By End Use
    • Spain
      • Pricing Analysis
      • Market Share Analysis, 2024
        • By Product Type
        • By End Use
    • France
      • Pricing Analysis
      • Market Share Analysis, 2024
        • By Product Type
        • By End Use
    • India
      • Pricing Analysis
      • Market Share Analysis, 2024
        • By Product Type
        • By End Use
    • ASEAN
      • Pricing Analysis
      • Market Share Analysis, 2024
        • By Product Type
        • By End Use
    • Australia & New Zealand
      • Pricing Analysis
      • Market Share Analysis, 2024
        • By Product Type
        • By End Use
    • China
      • Pricing Analysis
      • Market Share Analysis, 2024
        • By Product Type
        • By End Use
    • Japan
      • Pricing Analysis
      • Market Share Analysis, 2024
        • By Product Type
        • By End Use
    • South Korea
      • Pricing Analysis
      • Market Share Analysis, 2024
        • By Product Type
        • By End Use
    • Russia
      • Pricing Analysis
      • Market Share Analysis, 2024
        • By Product Type
        • By End Use
    • Poland
      • Pricing Analysis
      • Market Share Analysis, 2024
        • By Product Type
        • By End Use
    • Hungary
      • Pricing Analysis
      • Market Share Analysis, 2024
        • By Product Type
        • By End Use
    • Kingdom of Saudi Arabia
      • Pricing Analysis
      • Market Share Analysis, 2024
        • By Product Type
        • By End Use
    • Turkiye
      • Pricing Analysis
      • Market Share Analysis, 2024
        • By Product Type
        • By End Use
    • South Africa
      • Pricing Analysis
      • Market Share Analysis, 2024
        • By Product Type
        • By End Use
  17. Market Structure Analysis
    • Competition Dashboard
    • Competition Benchmarking
    • Market Share Analysis of Top Players
      • By Regional
      • By Product Type
      • By End Use
  18. Competition Analysis
    • Competition Deep Dive
      • FrieslandCampina
        • Overview
        • Product Portfolio
        • Profitability by Market Segments (Product/Age /Sales Channel/Region)
        • Sales Footprint
        • Strategy Overview
          • Marketing Strategy
          • Product Strategy
          • Channel Strategy
      • Arla Foods
      • Nestlé
      • Danone
      • Fonterra
      • Belgomilk
      • Hoogwegt International
      • Milky Holland
      • Vreugdenhil
      • Armor Proteines
      • BONILAIT PROTEINES
      • Alpen Food Group
      • Dale Farm Ltd
      • Lakeland Dairies
      • Holland Dairy Foods
      • Revala Ltd
      • DMK Group
  19. Assumptions & Acronyms Used
  20. Research Methodology

List of Tables

  • Table 1: Global Value (USD Million) Forecast by Region, 2020-2035
  • Table 2: Global Value (USD Million) Forecast by Product Type , 2020-2035
  • Table 3: Global Value (USD Million) Forecast by End Use, 2020-2035
  • Table 4: North America Value (USD Million) Forecast by Country, 2020-2035
  • Table 5: North America Value (USD Million) Forecast by Product Type , 2020-2035
  • Table 6: North America Value (USD Million) Forecast by End Use, 2020-2035
  • Table 7: Latin America Value (USD Million) Forecast by Country, 2020-2035
  • Table 8: Latin America Value (USD Million) Forecast by Product Type , 2020-2035
  • Table 9: Latin America Value (USD Million) Forecast by End Use, 2020-2035
  • Table 10: Western Europe Value (USD Million) Forecast by Country, 2020-2035
  • Table 11: Western Europe Value (USD Million) Forecast by Product Type , 2020-2035
  • Table 12: Western Europe Value (USD Million) Forecast by End Use, 2020-2035
  • Table 13: Eastern Europe Value (USD Million) Forecast by Country, 2020-2035
  • Table 14: Eastern Europe Value (USD Million) Forecast by Product Type , 2020-2035
  • Table 15: Eastern Europe Value (USD Million) Forecast by End Use, 2020-2035
  • Table 16: East Asia Value (USD Million) Forecast by Country, 2020-2035
  • Table 17: East Asia Value (USD Million) Forecast by Product Type , 2020-2035
  • Table 18: East Asia Value (USD Million) Forecast by End Use, 2020-2035
  • Table 19: South Asia and Pacific Value (USD Million) Forecast by Country, 2020-2035
  • Table 20: South Asia and Pacific Value (USD Million) Forecast by Product Type , 2020-2035
  • Table 21: South Asia and Pacific Value (USD Million) Forecast by End Use, 2020-2035
  • Table 22: Middle East & Africa Value (USD Million) Forecast by Country, 2020-2035
  • Table 23: Middle East & Africa Value (USD Million) Forecast by Product Type , 2020-2035
  • Table 24: Middle East & Africa Value (USD Million) Forecast by End Use, 2020-2035

List of Figures

  • Figure 1: Global Pricing Analysis
  • Figure 2: Global Value (USD Million) Forecast 2020-2035
  • Figure 3: Global Value Share and BPS Analysis by Product Type , 2025 and 2035
  • Figure 4: Global Y-o-Y Growth Comparison by Product Type , 2025-2035
  • Figure 5: Global Attractiveness Analysis by Product Type
  • Figure 6: Global Value Share and BPS Analysis by End Use, 2025 and 2035
  • Figure 7: Global Y-o-Y Growth Comparison by End Use, 2025-2035
  • Figure 8: Global Attractiveness Analysis by End Use
  • Figure 9: Global Value (USD Million) Share and BPS Analysis by Region, 2025 and 2035
  • Figure 10: Global Y-o-Y Growth Comparison by Region, 2025-2035
  • Figure 11: Global Attractiveness Analysis by Region
  • Figure 12: North America Incremental Dollar Opportunity, 2025-2035
  • Figure 13: Latin America Incremental Dollar Opportunity, 2025-2035
  • Figure 14: Western Europe Incremental Dollar Opportunity, 2025-2035
  • Figure 15: Eastern Europe Incremental Dollar Opportunity, 2025-2035
  • Figure 16: East Asia Incremental Dollar Opportunity, 2025-2035
  • Figure 17: South Asia and Pacific Incremental Dollar Opportunity, 2025-2035
  • Figure 18: Middle East & Africa Incremental Dollar Opportunity, 2025-2035
  • Figure 19: North America Value Share and BPS Analysis by Country, 2025 and 2035
  • Figure 20: North America Value Share and BPS Analysis by Product Type , 2025 and 2035
  • Figure 21: North America Y-o-Y Growth Comparison by Product Type , 2025-2035
  • Figure 22: North America Attractiveness Analysis by Product Type
  • Figure 23: North America Value Share and BPS Analysis by End Use, 2025 and 2035
  • Figure 24: North America Y-o-Y Growth Comparison by End Use, 2025-2035
  • Figure 25: North America Attractiveness Analysis by End Use
  • Figure 26: Latin America Value Share and BPS Analysis by Country, 2025 and 2035
  • Figure 27: Latin America Value Share and BPS Analysis by Product Type , 2025 and 2035
  • Figure 28: Latin America Y-o-Y Growth Comparison by Product Type , 2025-2035
  • Figure 29: Latin America Attractiveness Analysis by Product Type
  • Figure 30: Latin America Value Share and BPS Analysis by End Use, 2025 and 2035
  • Figure 31: Latin America Y-o-Y Growth Comparison by End Use, 2025-2035
  • Figure 32: Latin America Attractiveness Analysis by End Use
  • Figure 33: Western Europe Value Share and BPS Analysis by Country, 2025 and 2035
  • Figure 34: Western Europe Value Share and BPS Analysis by Product Type , 2025 and 2035
  • Figure 35: Western Europe Y-o-Y Growth Comparison by Product Type , 2025-2035
  • Figure 36: Western Europe Attractiveness Analysis by Product Type
  • Figure 37: Western Europe Value Share and BPS Analysis by End Use, 2025 and 2035
  • Figure 38: Western Europe Y-o-Y Growth Comparison by End Use, 2025-2035
  • Figure 39: Western Europe Attractiveness Analysis by End Use
  • Figure 40: Eastern Europe Value Share and BPS Analysis by Country, 2025 and 2035
  • Figure 41: Eastern Europe Value Share and BPS Analysis by Product Type , 2025 and 2035
  • Figure 42: Eastern Europe Y-o-Y Growth Comparison by Product Type , 2025-2035
  • Figure 43: Eastern Europe Attractiveness Analysis by Product Type
  • Figure 44: Eastern Europe Value Share and BPS Analysis by End Use, 2025 and 2035
  • Figure 45: Eastern Europe Y-o-Y Growth Comparison by End Use, 2025-2035
  • Figure 46: Eastern Europe Attractiveness Analysis by End Use
  • Figure 47: East Asia Value Share and BPS Analysis by Country, 2025 and 2035
  • Figure 48: East Asia Value Share and BPS Analysis by Product Type , 2025 and 2035
  • Figure 49: East Asia Y-o-Y Growth Comparison by Product Type , 2025-2035
  • Figure 50: East Asia Attractiveness Analysis by Product Type
  • Figure 51: East Asia Value Share and BPS Analysis by End Use, 2025 and 2035
  • Figure 52: East Asia Y-o-Y Growth Comparison by End Use, 2025-2035
  • Figure 53: East Asia Attractiveness Analysis by End Use
  • Figure 54: South Asia and Pacific Value Share and BPS Analysis by Country, 2025 and 2035
  • Figure 55: South Asia and Pacific Value Share and BPS Analysis by Product Type , 2025 and 2035
  • Figure 56: South Asia and Pacific Y-o-Y Growth Comparison by Product Type , 2025-2035
  • Figure 57: South Asia and Pacific Attractiveness Analysis by Product Type
  • Figure 58: South Asia and Pacific Value Share and BPS Analysis by End Use, 2025 and 2035
  • Figure 59: South Asia and Pacific Y-o-Y Growth Comparison by End Use, 2025-2035
  • Figure 60: South Asia and Pacific Attractiveness Analysis by End Use
  • Figure 61: Middle East & Africa Value Share and BPS Analysis by Country, 2025 and 2035
  • Figure 62: Middle East & Africa Value Share and BPS Analysis by Product Type , 2025 and 2035
  • Figure 63: Middle East & Africa Y-o-Y Growth Comparison by Product Type , 2025-2035
  • Figure 64: Middle East & Africa Attractiveness Analysis by Product Type
  • Figure 65: Middle East & Africa Value Share and BPS Analysis by End Use, 2025 and 2035
  • Figure 66: Middle East & Africa Y-o-Y Growth Comparison by End Use, 2025-2035
  • Figure 67: Middle East & Africa Attractiveness Analysis by End Use
  • Figure 68: Global - Tier Structure Analysis
  • Figure 69: Global - Company Share Analysis
Dashboard
Dashboard
Dashboard
Dashboard
Dashboard
Dashboard

Full Research Suite comprises of:

Market outlook & trends analysis

Market outlook & trends analysis

Interviews & case studies

Interviews & case studies

Strategic recommendations

Strategic recommendations

Vendor profiles & capabilities analysis

Vendor profiles & capabilities analysis

5-year forecasts

5-year forecasts

8 regions and 60+ country-level data splits

8 regions and 60+ country-level data splits

Market segment data splits

Market segment data splits

12 months of continuous data updates

12 months of continuous data updates

DELIVERED AS:

PDF EXCEL ONLINE

Full Research Suite


$3500

$5000

$6500

Buy Report Now
Similar Industry Reports

Similar Industry Reports

Demand Signal Repository Solutions Market

Demand Signal Repository Solutions Market Size and Share Forecast Outlook 2025 to 2035

Demand Side Management Market

Demand Side Management Market Size and Share Forecast Outlook 2025 to 2035

Demand Response Market

Demand Response Market Analysis - Size, Share, and Forecast Outlook 2025 to 2035

Demand for Industrial Chocolate in EU

Demand for Industrial Chocolate in EU Size and Share Forecast Outlook 2025 to 2035

Demand for Industrial & Institutional Cleaning Products in EU

Demand for Industrial & Institutional Cleaning Products in EU Size and Share Forecast Outlook 2025 to 2035

Demand for Joint Compound in EU

Demand for Joint Compound in EU Size and Share Forecast Outlook 2025 to 2035

Demand for Taurine in EU

Demand for Taurine in EU Size and Share Forecast Outlook 2025 to 2035

Demand for Kaolin in India

Demand for Kaolin in India Size and Share Forecast Outlook 2025 to 2035

Demand for DMPA in EU

Demand for DMPA in EU Size and Share Forecast Outlook 2025 to 2035

Demand for 3D Printing Materials in Middle East

Demand for 3D Printing Materials in Middle East Size and Share Forecast Outlook 2025 to 2035

Demand for Protein-rich Shelf-stable UHT Oat Drinks in Latin America

Demand for Protein-rich Shelf-stable UHT Oat Drinks in Latin America Size and Share Forecast Outlook 2025 to 2035

Demand for Yeast in EU

Demand for Yeast in EU Size and Share Forecast Outlook 2025 to 2035

Demand for Oat Drink in EU

Demand for Oat Drink in EU Size and Share Forecast Outlook 2025 to 2035

Demand for Vanillin in EU

Demand for Vanillin in EU Size and Share Forecast Outlook 2025 to 2035

Demand for Spirulina Extract in EU

Demand for Spirulina Extract in EU Size and Share Forecast Outlook 2025 to 2035

Demand for Pulse Ingredients in EU

Demand for Pulse Ingredients in EU Size and Share Forecast Outlook 2025 to 2035

Demand for Gypsum in EU

Demand for Gypsum in EU Size and Share Forecast Outlook 2025 to 2035

Demand for Barite in EU

Demand for Barite in EU Size and Share Forecast Outlook 2025 to 2035

Demand for Shrimp in the EU

Demand for Shrimp in the EU Size and Share Forecast Outlook 2025 to 2035

Demand for Mezcal in EU

Demand for Mezcal in EU Size and Share Forecast Outlook 2025 to 2035

Future Market Insights

Demand and Trends Analysis of Fat Filled Milk Powder in Western Europe

Chat With MaRIA

Chat With

MaRIA

Hi There, I am MaRIA, Your Market Research Intelligence Assistant. How may I help you?