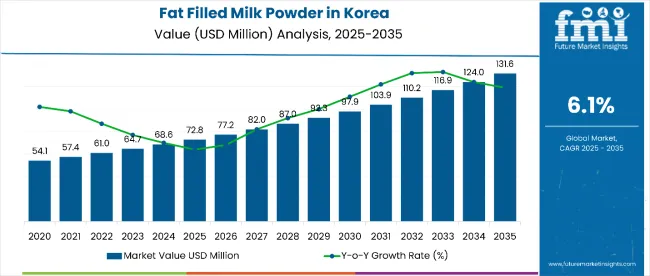
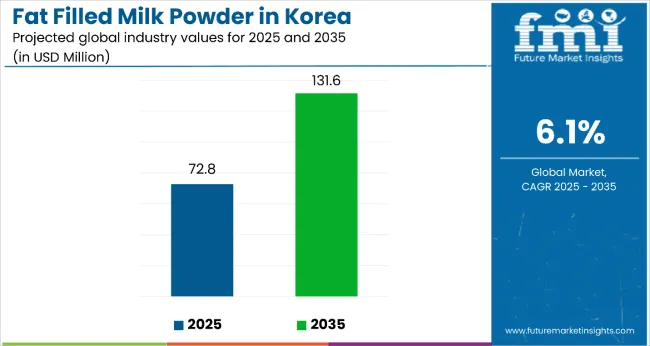
Sales of fat-filled milk powder in Korea are estimated at USD 72.8 million in 2025, with projections indicating a rise to USD 131.6 million by 2035, reflecting a CAGR of approximately 6.1% over the forecast period.
| Metric | Value |
|---|---|
| Estimated Size (2025E) | USD 72.8 million |
| Projected Value (2035F) | USD 131.6 million |
| CAGR (2025 to 2035) | 6.1% |
This growth demonstrates expanding health consciousness among Korean consumers and increased per capita consumption across major metropolitan centers. The rise in demand is linked to shifting dietary preferences, growing awareness of nutritional benefits, and evolving convenience food trends. By 2025, per capita consumption in leading Korean provinces such as South Jeolla, Gyeonggi, and Seoul average between 1.2 and 1.5 kilograms, with projections reaching 2.0 and 2.3 kilograms by 2035. South Jeolla leads among regional areas, expected to generate USD 39.7 million in fat-filled milk powder sales by 2035, followed by Seoul Metropolitan Area (USD 29 million), Busan-Ulsan region (USD 22.1 million), Gyeonggi Province (USD 18.9 million), and Jeju Island (USD 12.3 million).
The largest contribution to demand continues to come from 28% fat content products, which are expected to account for 35% of total sales in 2025, owing to optimal protein content, balanced nutritional profile, and consumer preference for moderate-fat dairy alternatives. By end-use classification, dairy products represent the dominant application, responsible for 29% of all sales, while food processing and retail channels are expanding rapidly.
Consumer adoption is particularly concentrated among health-conscious metropolitan families and nutrition-aware millennials, with income levels and metropolitan growth emerging as significant drivers of demand. While premium pricing remains a factor, the average price premium over regular milk powder has declined from 18% in 2020 to 12% in 2025 due to improved local production efficiency. Continued improvements in processing technology and local manufacturing capabilities are expected to accelerate affordability and access across middle-income households. Regional disparities persist, but per capita demand in developing provinces is narrowing the gap with traditionally strong metropolitan areas.
The fat-filled milk powder segment in Korea is classified into several categories. By product type, the key segments include fat-filled milk powder 26%, instant fat-filled milk powder 26%, fat-filled milk powder 28%, and instant fat-filled milk powder 28%. By distribution channel, the segment spans supermarkets and hypermarkets, convenience stores, department stores, specialty stores, and online. By end use, it includes dairy products, bakery products, confectionery, ice cream, and others. By region, coverage includes South Gyeongsang, North Jeolla, South Jeolla, Jeju, and the rest of Korea.
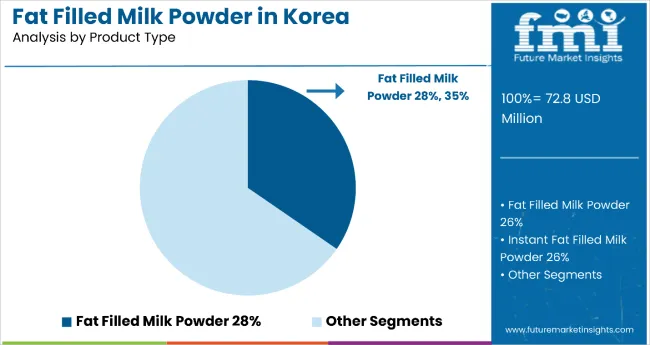
28% fat content variants are projected to dominate sales in 2025, supported by optimal nutritional balance, consumer preference for moderate-fat options, and widespread adoption in both retail and food processing applications. Other variants, such as 26% and instant formulations, are growing steadily, each serving distinct consumption needs.
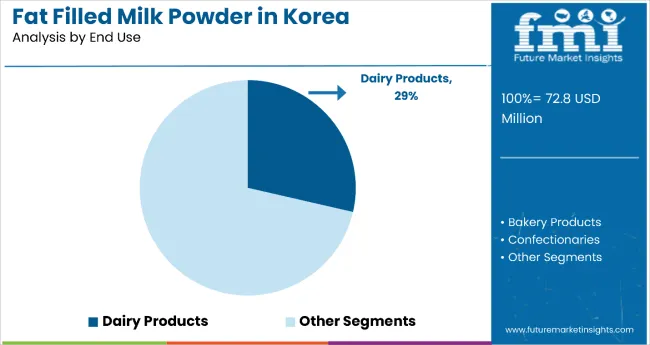
Fat-filled milk powder in Korea is utilized across B2B food processing and B2C retail applications. Dairy products are expected to remain the primary application in 2025, followed by bakery and confectionery uses and beverage applications. Usage patterns are evolving to match Korean food culture preferences, with growth coming from both traditional and innovative food applications.
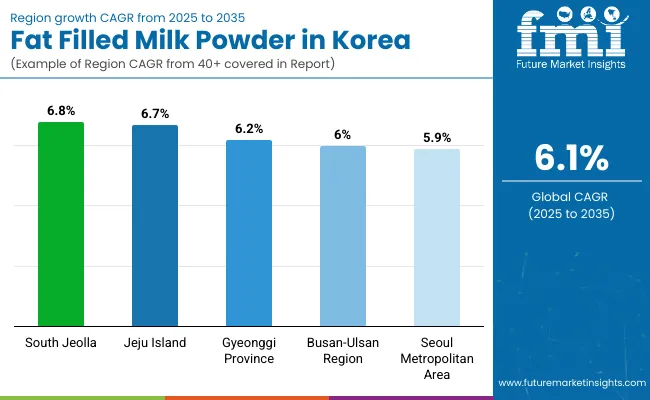
| Regions | CAGR (2025 to 2035) |
|---|---|
| South Jeolla | 6.8% |
| Jeju Island | 6.7% |
| Gyeonggi Province | 6.2% |
| Seoul Metropolitan Area | 5.9% |
| Busan-Ulsan Region | 6.0% |
Fat-filled milk powder sales will not grow uniformly across every Korean province. Rising metropolitan growth and faster adoption of processed dairy products in agricultural regions give South Jeolla and Jeju Island a measurable edge. At the same time, mature metropolitan areas such as Seoul expand more steadily from higher baseline consumption. The table below shows the compound annual growth rate (CAGR) each of the five key regions is expected to record between 2025 and 2035.
Between 2025 and 2035, demand for fat-filled milk powder is projected to expand across all major Korean regions. Still, the pace of growth will vary based on dairy infrastructure development, metropolitan expansion patterns, and baseline consumption levels. Among the top five areas analyzed, South Jeolla and Jeju Island are expected to register the fastest compound annual growth rates of 6.8% and 6.7% respectively, outpacing more urbanized metropolitan areas.
This acceleration is underpinned by a combination of factors: expanding dairy processing capabilities, growing agricultural modernization, and increasing availability of value-added dairy products across rural and semi-urban retail networks. In both regions, per capita consumption is projected to rise from 1.3 kg in 2025 to 2.4 kg by 2035, closing the gap with higher-consumption metropolitan areas. Processing infrastructure is also expanding faster in these regions, with new powder production facilities gaining efficiency in local supply chains.
The fat-filled milk powder category in Korea appeals to diverse consumer segments across age groups, lifestyle patterns, and dietary priorities. While motivations range from health benefits to convenience factors to cost considerations, demand is concentrated among four key demographic clusters. Each group demonstrates distinct purchase behaviors, channel preferences, and product expectations.
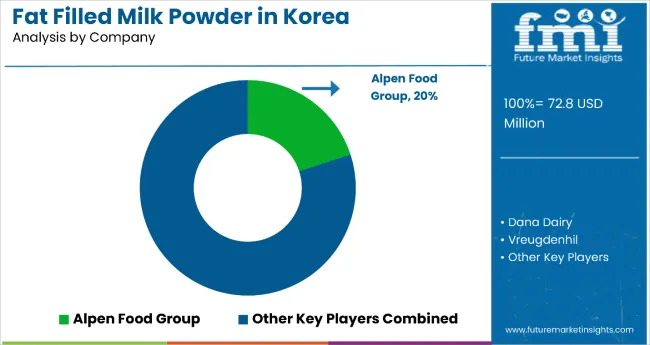
The competitive environment is characterized by a mix of domestic dairy processors and international ingredient suppliers. Processing efficiency rather than pure scale remains the decisive success factor: the five largest suppliers collectively serve more than 8,000 food manufacturers and retailers nationwide and account for a majority of both B2B and retail distribution in the category.
HEECHANG DAIRY&FOOD CO., LTD is the most established domestic participant. As a specialized dairy processor, the company offers comprehensive fat-filled milk powder solutions, all meeting Korean food safety standards. Its core range of dairy ingredients and finished products gives it deep penetration in local food processing channels while maintaining nationwide coverage through major retailers and foodservice distributors.
Kaskat Dairy, with international dairy expertise, leverages advanced processing technologies to place premium, fat-filled milk powder in high-end applications and specialty food manufacturers. Recent investments in facility modernization have allowed Kaskat to introduce enhanced nutritional variants positioned for health-conscious consumers, reinforcing its role as a quality-focused supplier.
Alpen Food Group, part of European dairy networks, benefits from scale synergies inside a comprehensive dairy ingredients portfolio and from technical partnerships with Korean food manufacturers. Recent product innovations under specialized nutrition platforms extend Alpen beyond basic powders into fortified formulations targeting specific health benefits and age-group nutrition needs.
The next tier comprises specialized processors and regional distributors. Dana Dairy focuses on cost-effective solutions for mid-scale food processors. Recent capacity expansions showed solid growth in industrial applications, signaling established positioning in B2B segments. Vreugdenhil, expanding through premium positioning, adds high-specification fat-filled powders to growing quality-focused supply chains and is expected to benefit from increasing demand for certified ingredient sourcing.
Private-label programs at major Korean retailers, including Lotte Mart, E-Mart, and Homeplus, are widening consumer access at price points 8-15% below branded equivalents, putting margin pressure on smaller suppliers while supporting household adoption. Consolidation is therefore likely to continue as processing scale and distribution coverage become critical for maintaining retail partnerships and quality consistency in this expanding category.
Key Developments
| Items | Values |
|---|---|
| Quantitative Units (2025) | USD 72.8 Million |
| Product Type | Fat Filled Milk Powder 26%, Instant Fat Filled Milk Powder 26%, Fat Filled Milk Powder 28%, Instant Fat Filled Milk Powder 28% |
| Distribution Channel | Supermarkets and Hypermarkets, Convenience Stores, Department Stores, Specialty Stores, Online |
| End User | Dairy Products, Bakery Products, Confectionery, Ice Cream, Others |
| Regions Covered | South Gyeongsang, North Jeolla, South Jeolla, Jeju, Rest of Korea |
| Key Companies Profiled | HEECHANG DAIRY&FOOD CO., LTD, Kaskat Dairy, Alpen Food Group, Dana Dairy, Vreugdenhil, Armor Proteines, MP Biomedicals LLC, BONILAIT PROTEINES, Polindus, Holland Dairy Foods, Hoogwegt International, Belgomilk, Revala Ltd, Dale Farm Ltd |
| Additional Attributes | Dollar sales by application and purity grade, regional demand trends, competitive landscape, consumer preferences for natural versus synthetic alternatives, integration with sustainable sourcing practices, innovations in extraction technology and quality standardization for diverse industrial applications |
The global demand and trends analysis of fat filled milk powder in Korea is estimated to be valued at USD 72.8 million in 2025.
The market size for the demand and trends analysis of fat filled milk powder in Korea is projected to reach USD 128.3 million by 2035.
The demand and trends analysis of fat filled milk powder in Korea is expected to grow at a 5.8% CAGR between 2025 and 2035.
The key product types in demand and trends analysis of fat filled milk powder in Korea are fat filled milk powder 28%, fat filled milk powder 26%, instant fat filled milk powder 28% and instant fat filled milk powder 26%.
In terms of distribution channel, supermarkets and hypermarkets segment to command 25.0% share in the demand and trends analysis of fat filled milk powder in Korea in 2025.


Our Research Products

The "Full Research Suite" delivers actionable market intel, deep dives on markets or technologies, so clients act faster, cut risk, and unlock growth.

The Leaderboard benchmarks and ranks top vendors, classifying them as Established Leaders, Leading Challengers, or Disruptors & Challengers.

Locates where complements amplify value and substitutes erode it, forecasting net impact by horizon

We deliver granular, decision-grade intel: market sizing, 5-year forecasts, pricing, adoption, usage, revenue, and operational KPIs—plus competitor tracking, regulation, and value chains—across 60 countries broadly.

Spot the shifts before they hit your P&L. We track inflection points, adoption curves, pricing moves, and ecosystem plays to show where demand is heading, why it is changing, and what to do next across high-growth markets and disruptive tech

Real-time reads of user behavior. We track shifting priorities, perceptions of today’s and next-gen services, and provider experience, then pace how fast tech moves from trial to adoption, blending buyer, consumer, and channel inputs with social signals (#WhySwitch, #UX).

Partner with our analyst team to build a custom report designed around your business priorities. From analysing market trends to assessing competitors or crafting bespoke datasets, we tailor insights to your needs.
Supplier Intelligence
Discovery & Profiling
Capacity & Footprint
Performance & Risk
Compliance & Governance
Commercial Readiness
Who Supplies Whom
Scorecards & Shortlists
Playbooks & Docs
Category Intelligence
Definition & Scope
Demand & Use Cases
Cost Drivers
Market Structure
Supply Chain Map
Trade & Policy
Operating Norms
Deliverables
Buyer Intelligence
Account Basics
Spend & Scope
Procurement Model
Vendor Requirements
Terms & Policies
Entry Strategy
Pain Points & Triggers
Outputs
Pricing Analysis
Benchmarks
Trends
Should-Cost
Indexation
Landed Cost
Commercial Terms
Deliverables
Brand Analysis
Positioning & Value Prop
Share & Presence
Customer Evidence
Go-to-Market
Digital & Reputation
Compliance & Trust
KPIs & Gaps
Outputs
Full Research Suite comprises of:
Market outlook & trends analysis
Interviews & case studies
Strategic recommendations
Vendor profiles & capabilities analysis
5-year forecasts
8 regions and 60+ country-level data splits
Market segment data splits
12 months of continuous data updates
DELIVERED AS:
PDF EXCEL ONLINE
Demand and Trends Analysis of Fat Filled Milk Powder in Western Europe Size and Share Forecast Outlook 2025 to 2035
Fat Filled Milk Powder Market Analysis - Size, Share, and Forecast Outlook 2025 to 2035
Japan Fat Filled Milk Powder Market Analysis by Product Type, End Use, and Region Through 2035
Demand for Fat Filled Milk Powder in EU Size and Share Forecast Outlook 2025 to 2035
Milk Powder Packaging Market Size and Share Forecast Outlook 2025 to 2035
Milk Powder Packaging Machines Market Size and Share Forecast Outlook 2025 to 2035
Milk Powder Market Analysis by Type, Distribution Channel, Region and Other Applications Through 2035
Milk Fat Fractions Market
Korea Powdered Cellulose Market Analysis by Source, End-use, Functionality, and Region Through 2035
Powdered Fats Market – Growth, Demand & Industrial Applications
Korea Baby Powder Market Analysis – Size, Share & Trends 2025 to 2035
Skim Milk Powder Market Outlook – Growth, Demand & Forecast 2025 to 2035
Non-fat Dry Milk Market Size and Share Forecast Outlook 2025 to 2035
Buttermilk Powder Market Analysis by Product Type, Sale Channel, and Region Through 2035
Competitive Breakdown of Buttermilk Powder Providers
Whole Milk Powder Market
Malted Milk Powder Market Trends - Growth & Industry Forecast 2025 to 2035
Instant Fat Powder Market Size, Growth, and Forecast for 2025 to 2035
Coconut Milk Powder Market Size and Share Forecast Outlook 2025 to 2035
Skimmed Milk Powder Market Size and Share Forecast Outlook 2025 to 2035

Thank you!
You will receive an email from our Business Development Manager. Please be sure to check your SPAM/JUNK folder too.
Chat With
MaRIA