Western Europe Automated People Mover Industry Size and Share Forecast Outlook 2025 to 2035

The Western Europe Automated People Mover Industry is estimated to be valued at USD 0.7 billion in 2025 and is projected to reach USD 1.3 billion by 2035, registering a compound annual growth rate (CAGR) of 6.0% over the forecast period.
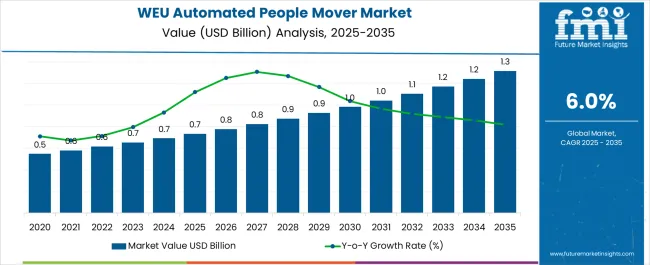
Quick Stats for Western Europe Automated People Mover Industry

  • Western Europe Automated People Mover Industry Industry Value (2025): USD 0.7 billion
  • Western Europe Automated People Mover Industry Forecast Value (2035): USD 1.3 billion
  • Western Europe Automated People Mover Industry Forecast CAGR: 6.0%
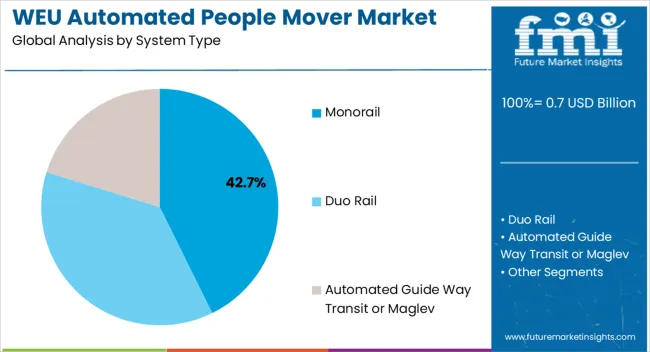
  • Leading Segment in Western Europe Automated People Mover Industry in 2025: Monorail (42.7%)
  • Key Growth Region in Western Europe Automated People Mover Industry: North America, Asia-Pacific, Europe
  • Top Key Players in Western Europe Automated People Mover Industry: Siemens AG, Bombardier Transportation, Poma, Thales Group, Alstom SA, Ansaldo STS

Weu Automated People Mover Market Market Value Analysis

Metric Value
Western Europe Automated People Mover Industry Estimated Value in (2025 E) USD 0.7 billion
Western Europe Automated People Mover Industry Forecast Value in (2035 F) USD 1.3 billion
Forecast CAGR (2025 to 2035) 6.0%

Rationale for Segmental Growth in the Western Europe Automated People Mover Industry

The Western Europe automated people mover industry is expanding steadily due to growing urbanization, rising demand for sustainable mobility, and increasing investments in advanced public transportation infrastructure. Current industry dynamics are defined by the adoption of automated systems to improve passenger flow efficiency, reduce traffic congestion, and support environmentally friendly transport solutions.

Technological progress in automation, energy efficiency, and digital monitoring systems has further strengthened market acceptance. The future outlook is being shaped by large-scale infrastructure development projects, policy-driven emphasis on reducing carbon emissions, and the modernization of urban transit frameworks.

Growth rationale is reinforced by the ability of automated people movers to deliver cost-efficient, reliable, and safe mobility solutions that align with long-term sustainability goals Ongoing collaboration between system manufacturers, government agencies, and urban planners is expected to ensure widespread adoption, with demand projected to rise across both urban transit and specialized commercial applications.
Segmental Analysis

Insights into the System Type Segment

Weu Automated People Mover Market Analysis By System Type

The monorail segment, holding 42.70% of the system type category, has emerged as the dominant configuration owing to its suitability for dense urban environments and relatively lower land-use requirements. The segment’s growth has been supported by technological improvements in automated control, structural durability, and energy efficiency, which have enhanced operational reliability.

Monorails are being increasingly deployed in metropolitan areas to alleviate congestion and provide seamless connectivity to existing transport hubs. Market share has been reinforced by government-backed infrastructure programs and public-private partnerships that prioritize sustainable and space-efficient solutions.

The integration of smart monitoring systems has enabled predictive maintenance and optimized performance, further elevating adoption Over the forecast horizon, the segment is expected to retain its leadership position, supported by continuous advancements in design and construction techniques that reduce lifecycle costs and improve passenger capacity.
Insights into the Application Segment

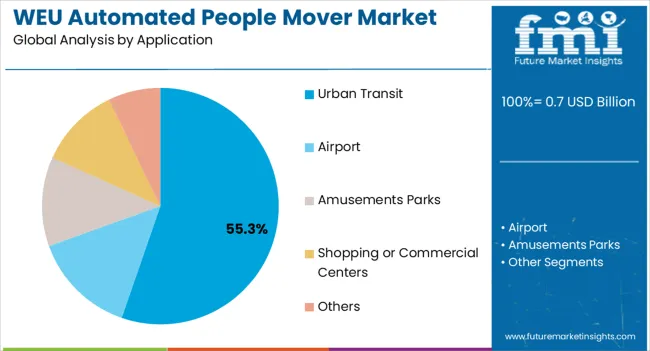
Weu Automated People Mover Market Analysis By Application

The urban transit segment, representing 55.30% of the application category, has maintained dominance as cities across Western Europe prioritize efficient, automated mobility solutions for growing populations. Its leadership has been driven by increasing demand for reduced road congestion, improved air quality, and enhanced connectivity across metropolitan areas.

The segment’s growth has been strengthened by integration with multimodal transit systems, ensuring last-mile connectivity and optimized passenger flow. Urban transit projects have benefited from strong regulatory support and significant government investments in green transportation infrastructure.

The segment has also been reinforced by technological innovation in autonomous driving systems, communication-based train control, and energy-efficient propulsion technologies Looking ahead, ongoing urban development and the push for carbon-neutral mobility are expected to drive sustained demand, ensuring that automated people movers continue to play a central role in shaping the future of Western Europe’s transit landscape.

Key Insights on Factors Boosting the Sales of Automated People Mover in Western Europe

  • Growing demand for eco-friendly transit solutions fuels the adoption of automated people mover in Western Europe.
  • IoT and AI advancements enhance automated people mover systems, attracting tech savvy cities and boosting sales.
  • Automated people mover addresses the need for efficient, automated transportation catering to the evolving urban landscape in Western Europe.
  • Collaborations between technology providers and urban planners drive continuous innovation, positively influencing automated people mover sales.
  • Focus on improving passenger comfort and experience boosts the appeal and adoption of automated people mover in Western Europe.

Key Trends Influencing the Demand for Automated People Mover in Western Europe

  • Automated people mover aligns with Western Europe's urban planning strategies, becoming integral to city development initiatives.
  • Trends favor scalable and modular automated people mover systems, allowing flexibility in adapting to diverse urban infrastructures and needs.
  • A growing emphasis on solving last-mile connectivity challenges fuels demand for automated people mover in Western Europe's urban centers.
  • A trend toward adaptive infrastructure planning ensures automated people mover seamlessly integrate with evolving urban landscapes, enhancing overall transit efficiency.
  • The reliance on data-driven insights for transit planning and optimization influences the adoption of automated people mover in Western Europe.

Category-wise insights

Duo Rail's Supremacy Shapes the Future of Urban Mobility in Western Europe

Duo rail is the dominant force, projected to claim an impressive 81.5% industry share in the Western Europe automated people mover industry in 2025. The duo rail system excels in urban transit scenarios and is renowned for its unparalleled precision and efficiency.

System Type Duo Rail
Industry Share in 2025 81.5%

Its dual-track design ensures enhanced stability, reliability, and streamlined operations. Embracing cutting-edge technology and modular adaptability, duo rail provides a versatile solution for varying infrastructural needs, solidifying its supremacy.

As Western Europe seeks advanced transit solutions, the exceptional performance of duo rail cements its status as the system of choice, shaping the future of urban mobility.

Automated People Mover is Set to Rule Airports across Western Europe

With a projected formidable 62.6% industry share in 2025, the airport application segment emerges as the powerhouse in the Western Europe automated people mover industry. Tailored to optimize passenger flow, reduce transit times, and enhance the overall airport experience, these systems are pivotal in large-scale terminals.

Application Airports
Industry Share in 2025 62.6%

With a focus on efficiency and passenger comfort, automated people mover elevates the air travel journey, positioning airports as the primary adopters. As the Western Europe aviation sector thrives, the dominance of automated people mover within airport infrastructures continues to reshape the landscape of seamless tech-driven travel experiences.

Country-wise Insights

Regions Profiled CAGR from 2025 to 2035
France 7.9%
Germany 7.5%

Automated People Mover Seamlessly Integrates into France's Cityscapes

France's automated people mover industry rides a wave of evolution with a robust 7.9% CAGR through 2035, unveiling transformative trends. A surge in urban mobility projects witnesses’ automated people mover seamlessly integrated into France's cityscapes, connecting communities and reducing congestion.

The evolution of smart stations emerges, leveraging advanced technologies to optimize passenger experiences, from intelligent ticketing to real-time information dissemination. Its commitment to sustainability manifests in eco-friendly automated people mover, aligning with its green initiatives and promoting environmentally conscious transit solutions.

The rise of intermodal transit hubs signifies a trend where automated people mover seamlessly connects with various modes of transportation, fostering efficient and interconnected transit networks. A digital revolution unfolds, leveraging data analytics and IoT to enhance operational efficiency, predictive maintenance, and overall service quality, marking a new era in France's automated people mover landscape.

Automated People Mover is Transforming Germany's Iconic Attractions

The Germany automated people mover industry, projecting a 7.5% CAGR through 2035, unveils a landscape ripe with opportunities. Germany's bustling airports present a significant opportunity for automated people mover, especially as airports expand to accommodate growing passenger traffic.

Integration into smart city projects marks a strategic opportunity, with automated people mover becoming integral components of its urban infrastructure. Developing interconnected transportation hubs provides fertile ground for automated people mover, enhancing seamless connectivity within its transit networks.

Opportunities arise to enhance tourist experiences as automated people mover offer efficient and novel ways to explore Germany's iconic attractions, fostering tourism-driven opportunities. With Germany's commitment to technological innovation, there is an opportunity for investment in research and development, pushing the boundaries of automated people mover capabilities and efficiency.
Competitive Landscape

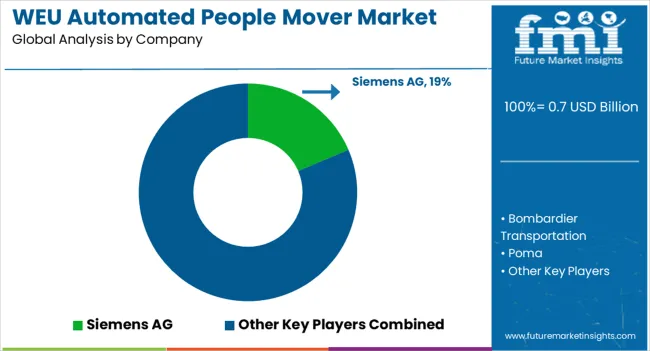
Weu Automated People Mover Market Analysis By Company

A dynamic competitive landscape unfolds in the Western Europe automated people mover industry. Industry leaders like Siemens spearhead innovation, offering advanced and customizable solutions. Local players, such as Poma and Doppelmayr, contribute region-specific expertise. Collaboration and strategic partnerships thrive, with companies like Hitachi joining forces for seamless integration. As urbanization and transit needs evolve, key players continually invest in research, development, and sustainable practices, ensuring a competitive edge. This amalgamation of global giants and niche specialists shapes a landscape where innovation, efficiency, and adaptability are the cornerstones of success.

Product Portfolio:

  • Siemens AG pioneers automated people mover, offering cutting-edge solutions for efficiency and sustainability. From urban transit to airport connectivity, Siemens delivers smart, integrated mobility.
  • Bombardier Transportation is a global leader specializing in automated people mover systems. Their portfolio boasts advanced technologies, ensuring seamless, efficient, and comfortable transit experiences in urban and airport environments.
  • A French innovator, Poma presents a diverse product portfolio in automated people mover. Poma creates efficient and sustainable mobility experiences worldwide, from urban transit solutions to scenic transport.

Some of the Important Players Dealing with Automated People Mover in Western Europe

  • Siemens AG
  • Bombardier Transportation
  • Poma
  • Thales Group
  • Alstom SA
  • Ansaldo STS

Scope of the Report

Attribute Details
Estimated Industry Size in 2025 USD 0.7 billion
Projected Industry Size by 2035 USD 1.3 billion
Attributed CAGR between 2025 and 2035 6.0%
Historical Analysis of Demand for Automated People Mover in Western Europe Countries 2020 to 2025
Forecast Period 2025 to 2035
Report Coverage Industry size, industry trends, analysis of key factors influencing Automated People Mover in Western Europe insights on global players and their industry strategy in Western Europe ecosystem analysis of local and regional Western Europe providers.
Key Countries Analyzed while Studying Opportunities for Automated People Mover in Western Europe Germany, Italy, France, Spain, United Kingdom, BENELUX, Rest of Western Europe
Key Companies Profiled in the Industry Analysis of Automated People Mover in Western Europe Siemens AG; Bombardier Transportation; Poma; Thales Group; Alstom SA; Ansaldo STS

Key Segments

By System Type:

  • Monorail
  • Duo Rail
  • Automated Guide Way Transit or Maglev

By Application:

  • Airport
  • Urban Transit
  • Amusements Parks
  • Shopping or Commercial Centers
  • Others

By Country:

  • Germany
  • Italy
  • France
  • Spain
  • United Kingdom
  • BENELUX
  • Rest of Western Europe

Table of Content

  1. Executive Summary
    • Global Market Outlook
    • Demand-side Trends
    • Supply-side Trends
    • Technology Roadmap Analysis
    • Analysis and Recommendations
  2. Market Overview
    • Market Coverage / Taxonomy
    • Market Definition / Scope / Limitations
  3. Market Background
    • Market Dynamics
      • Drivers
      • Restraints
      • Opportunity
      • Trends
    • Scenario Forecast
      • Demand in Optimistic Scenario
      • Demand in Likely Scenario
      • Demand in Conservative Scenario
    • Opportunity Map Analysis
    • Product Life Cycle Analysis
    • Supply Chain Analysis
    • Investment Feasibility Matrix
    • Value Chain Analysis
    • PESTLE and Porter’s Analysis
    • Regulatory Landscape
    • Regional Parent Market Outlook
    • Production and Consumption Statistics
    • Import and Export Statistics
  4. Global Analysis 2020 to 2024 and Forecast, 2025 to 2035
    • Historical Market Size Value (USD Million) Analysis, 2020 to 2024
    • Current and Future Market Size Value (USD Million) Projections, 2025 to 2035
      • Y-o-Y Growth Trend Analysis
      • Absolute $ Opportunity Analysis
  5. Global Pricing Analysis 2020 to 2024 and Forecast 2025 to 2035
  6. Global Analysis 2020 to 2024 and Forecast 2025 to 2035, By System Type
    • Introduction / Key Findings
    • Historical Market Size Value (USD Million) Analysis By System Type , 2020 to 2024
    • Current and Future Market Size Value (USD Million) Analysis and Forecast By System Type , 2025 to 2035
      • Monorail
      • Duo Rail
      • Automated Guide Way Transit or Maglev
    • Y-o-Y Growth Trend Analysis By System Type , 2020 to 2024
    • Absolute $ Opportunity Analysis By System Type , 2025 to 2035
  7. Global Analysis 2020 to 2024 and Forecast 2025 to 2035, By Application
    • Introduction / Key Findings
    • Historical Market Size Value (USD Million) Analysis By Application, 2020 to 2024
    • Current and Future Market Size Value (USD Million) Analysis and Forecast By Application, 2025 to 2035
      • Urban Transit
      • Airport
      • Amusements Parks
      • Shopping or Commercial Centers
      • Others
    • Y-o-Y Growth Trend Analysis By Application, 2020 to 2024
    • Absolute $ Opportunity Analysis By Application, 2025 to 2035
  8. Global Analysis 2020 to 2024 and Forecast 2025 to 2035, By Region
    • Introduction
    • Historical Market Size Value (USD Million) Analysis By Region, 2020 to 2024
    • Current Market Size Value (USD Million) Analysis and Forecast By Region, 2025 to 2035
      • North America
      • Latin America
      • Western Europe
      • Eastern Europe
      • East Asia
      • South Asia and Pacific
      • Middle East & Africa
    • Market Attractiveness Analysis By Region
  9. North America Analysis 2020 to 2024 and Forecast 2025 to 2035, By Country
    • Historical Market Size Value (USD Million) Trend Analysis By Market Taxonomy, 2020 to 2024
    • Market Size Value (USD Million) Forecast By Market Taxonomy, 2025 to 2035
      • By Country
        • USA
        • Canada
        • Mexico
      • By System Type
      • By Application
    • Market Attractiveness Analysis
      • By Country
      • By System Type
      • By Application
    • Key Takeaways
  10. Latin America Analysis 2020 to 2024 and Forecast 2025 to 2035, By Country
    • Historical Market Size Value (USD Million) Trend Analysis By Market Taxonomy, 2020 to 2024
    • Market Size Value (USD Million) Forecast By Market Taxonomy, 2025 to 2035
      • By Country
        • Brazil
        • Chile
        • Rest of Latin America
      • By System Type
      • By Application
    • Market Attractiveness Analysis
      • By Country
      • By System Type
      • By Application
    • Key Takeaways
  11. Western Europe Analysis 2020 to 2024 and Forecast 2025 to 2035, By Country
    • Historical Market Size Value (USD Million) Trend Analysis By Market Taxonomy, 2020 to 2024
    • Market Size Value (USD Million) Forecast By Market Taxonomy, 2025 to 2035
      • By Country
        • Germany
        • UK
        • Italy
        • Spain
        • France
        • Nordic
        • BENELUX
        • Rest of Western Europe
      • By System Type
      • By Application
    • Market Attractiveness Analysis
      • By Country
      • By System Type
      • By Application
    • Key Takeaways
  12. Eastern Europe Analysis 2020 to 2024 and Forecast 2025 to 2035, By Country
    • Historical Market Size Value (USD Million) Trend Analysis By Market Taxonomy, 2020 to 2024
    • Market Size Value (USD Million) Forecast By Market Taxonomy, 2025 to 2035
      • By Country
        • Russia
        • Poland
        • Hungary
        • Balkan & Baltic
        • Rest of Eastern Europe
      • By System Type
      • By Application
    • Market Attractiveness Analysis
      • By Country
      • By System Type
      • By Application
    • Key Takeaways
  13. East Asia Analysis 2020 to 2024 and Forecast 2025 to 2035, By Country
    • Historical Market Size Value (USD Million) Trend Analysis By Market Taxonomy, 2020 to 2024
    • Market Size Value (USD Million) Forecast By Market Taxonomy, 2025 to 2035
      • By Country
        • China
        • Japan
        • South Korea
      • By System Type
      • By Application
    • Market Attractiveness Analysis
      • By Country
      • By System Type
      • By Application
    • Key Takeaways
  14. South Asia and Pacific Analysis 2020 to 2024 and Forecast 2025 to 2035, By Country
    • Historical Market Size Value (USD Million) Trend Analysis By Market Taxonomy, 2020 to 2024
    • Market Size Value (USD Million) Forecast By Market Taxonomy, 2025 to 2035
      • By Country
        • India
        • ASEAN
        • Australia & New Zealand
        • Rest of South Asia and Pacific
      • By System Type
      • By Application
    • Market Attractiveness Analysis
      • By Country
      • By System Type
      • By Application
    • Key Takeaways
  15. Middle East & Africa Analysis 2020 to 2024 and Forecast 2025 to 2035, By Country
    • Historical Market Size Value (USD Million) Trend Analysis By Market Taxonomy, 2020 to 2024
    • Market Size Value (USD Million) Forecast By Market Taxonomy, 2025 to 2035
      • By Country
        • Kingdom of Saudi Arabia
        • Other GCC Countries
        • Turkiye
        • South Africa
        • Other African Union
        • Rest of Middle East & Africa
      • By System Type
      • By Application
    • Market Attractiveness Analysis
      • By Country
      • By System Type
      • By Application
    • Key Takeaways
  16. Key Countries Analysis
    • USA
      • Pricing Analysis
      • Market Share Analysis, 2024
        • By System Type
        • By Application
    • Canada
      • Pricing Analysis
      • Market Share Analysis, 2024
        • By System Type
        • By Application
    • Mexico
      • Pricing Analysis
      • Market Share Analysis, 2024
        • By System Type
        • By Application
    • Brazil
      • Pricing Analysis
      • Market Share Analysis, 2024
        • By System Type
        • By Application
    • Chile
      • Pricing Analysis
      • Market Share Analysis, 2024
        • By System Type
        • By Application
    • Germany
      • Pricing Analysis
      • Market Share Analysis, 2024
        • By System Type
        • By Application
    • UK
      • Pricing Analysis
      • Market Share Analysis, 2024
        • By System Type
        • By Application
    • Italy
      • Pricing Analysis
      • Market Share Analysis, 2024
        • By System Type
        • By Application
    • Spain
      • Pricing Analysis
      • Market Share Analysis, 2024
        • By System Type
        • By Application
    • France
      • Pricing Analysis
      • Market Share Analysis, 2024
        • By System Type
        • By Application
    • India
      • Pricing Analysis
      • Market Share Analysis, 2024
        • By System Type
        • By Application
    • ASEAN
      • Pricing Analysis
      • Market Share Analysis, 2024
        • By System Type
        • By Application
    • Australia & New Zealand
      • Pricing Analysis
      • Market Share Analysis, 2024
        • By System Type
        • By Application
    • China
      • Pricing Analysis
      • Market Share Analysis, 2024
        • By System Type
        • By Application
    • Japan
      • Pricing Analysis
      • Market Share Analysis, 2024
        • By System Type
        • By Application
    • South Korea
      • Pricing Analysis
      • Market Share Analysis, 2024
        • By System Type
        • By Application
    • Russia
      • Pricing Analysis
      • Market Share Analysis, 2024
        • By System Type
        • By Application
    • Poland
      • Pricing Analysis
      • Market Share Analysis, 2024
        • By System Type
        • By Application
    • Hungary
      • Pricing Analysis
      • Market Share Analysis, 2024
        • By System Type
        • By Application
    • Kingdom of Saudi Arabia
      • Pricing Analysis
      • Market Share Analysis, 2024
        • By System Type
        • By Application
    • Turkiye
      • Pricing Analysis
      • Market Share Analysis, 2024
        • By System Type
        • By Application
    • South Africa
      • Pricing Analysis
      • Market Share Analysis, 2024
        • By System Type
        • By Application
  17. Market Structure Analysis
    • Competition Dashboard
    • Competition Benchmarking
    • Market Share Analysis of Top Players
      • By Regional
      • By System Type
      • By Application
  18. Competition Analysis
    • Competition Deep Dive
      • Siemens AG
        • Overview
        • Product Portfolio
        • Profitability by Market Segments (Product/Age /Sales Channel/Region)
        • Sales Footprint
        • Strategy Overview
          • Marketing Strategy
          • Product Strategy
          • Channel Strategy
      • Bombardier Transportation
      • Poma
      • Thales Group
      • Alstom SA
      • Ansaldo STS
  19. Assumptions & Acronyms Used
  20. Research Methodology

List of Tables

  • Table 1: Global Value (USD Million) Forecast by Region, 2020-2035
  • Table 2: Global Value (USD Million) Forecast by System Type , 2020-2035
  • Table 3: Global Value (USD Million) Forecast by Application, 2020-2035
  • Table 4: North America Value (USD Million) Forecast by Country, 2020-2035
  • Table 5: North America Value (USD Million) Forecast by System Type , 2020-2035
  • Table 6: North America Value (USD Million) Forecast by Application, 2020-2035
  • Table 7: Latin America Value (USD Million) Forecast by Country, 2020-2035
  • Table 8: Latin America Value (USD Million) Forecast by System Type , 2020-2035
  • Table 9: Latin America Value (USD Million) Forecast by Application, 2020-2035
  • Table 10: Western Europe Value (USD Million) Forecast by Country, 2020-2035
  • Table 11: Western Europe Value (USD Million) Forecast by System Type , 2020-2035
  • Table 12: Western Europe Value (USD Million) Forecast by Application, 2020-2035
  • Table 13: Eastern Europe Value (USD Million) Forecast by Country, 2020-2035
  • Table 14: Eastern Europe Value (USD Million) Forecast by System Type , 2020-2035
  • Table 15: Eastern Europe Value (USD Million) Forecast by Application, 2020-2035
  • Table 16: East Asia Value (USD Million) Forecast by Country, 2020-2035
  • Table 17: East Asia Value (USD Million) Forecast by System Type , 2020-2035
  • Table 18: East Asia Value (USD Million) Forecast by Application, 2020-2035
  • Table 19: South Asia and Pacific Value (USD Million) Forecast by Country, 2020-2035
  • Table 20: South Asia and Pacific Value (USD Million) Forecast by System Type , 2020-2035
  • Table 21: South Asia and Pacific Value (USD Million) Forecast by Application, 2020-2035
  • Table 22: Middle East & Africa Value (USD Million) Forecast by Country, 2020-2035
  • Table 23: Middle East & Africa Value (USD Million) Forecast by System Type , 2020-2035
  • Table 24: Middle East & Africa Value (USD Million) Forecast by Application, 2020-2035

List of Figures

  • Figure 1: Global Pricing Analysis
  • Figure 2: Global Value (USD Million) Forecast 2020-2035
  • Figure 3: Global Value Share and BPS Analysis by System Type , 2025 and 2035
  • Figure 4: Global Y-o-Y Growth Comparison by System Type , 2025-2035
  • Figure 5: Global Attractiveness Analysis by System Type
  • Figure 6: Global Value Share and BPS Analysis by Application, 2025 and 2035
  • Figure 7: Global Y-o-Y Growth Comparison by Application, 2025-2035
  • Figure 8: Global Attractiveness Analysis by Application
  • Figure 9: Global Value (USD Million) Share and BPS Analysis by Region, 2025 and 2035
  • Figure 10: Global Y-o-Y Growth Comparison by Region, 2025-2035
  • Figure 11: Global Attractiveness Analysis by Region
  • Figure 12: North America Incremental Dollar Opportunity, 2025-2035
  • Figure 13: Latin America Incremental Dollar Opportunity, 2025-2035
  • Figure 14: Western Europe Incremental Dollar Opportunity, 2025-2035
  • Figure 15: Eastern Europe Incremental Dollar Opportunity, 2025-2035
  • Figure 16: East Asia Incremental Dollar Opportunity, 2025-2035
  • Figure 17: South Asia and Pacific Incremental Dollar Opportunity, 2025-2035
  • Figure 18: Middle East & Africa Incremental Dollar Opportunity, 2025-2035
  • Figure 19: North America Value Share and BPS Analysis by Country, 2025 and 2035
  • Figure 20: North America Value Share and BPS Analysis by System Type , 2025 and 2035
  • Figure 21: North America Y-o-Y Growth Comparison by System Type , 2025-2035
  • Figure 22: North America Attractiveness Analysis by System Type
  • Figure 23: North America Value Share and BPS Analysis by Application, 2025 and 2035
  • Figure 24: North America Y-o-Y Growth Comparison by Application, 2025-2035
  • Figure 25: North America Attractiveness Analysis by Application
  • Figure 26: Latin America Value Share and BPS Analysis by Country, 2025 and 2035
  • Figure 27: Latin America Value Share and BPS Analysis by System Type , 2025 and 2035
  • Figure 28: Latin America Y-o-Y Growth Comparison by System Type , 2025-2035
  • Figure 29: Latin America Attractiveness Analysis by System Type
  • Figure 30: Latin America Value Share and BPS Analysis by Application, 2025 and 2035
  • Figure 31: Latin America Y-o-Y Growth Comparison by Application, 2025-2035
  • Figure 32: Latin America Attractiveness Analysis by Application
  • Figure 33: Western Europe Value Share and BPS Analysis by Country, 2025 and 2035
  • Figure 34: Western Europe Value Share and BPS Analysis by System Type , 2025 and 2035
  • Figure 35: Western Europe Y-o-Y Growth Comparison by System Type , 2025-2035
  • Figure 36: Western Europe Attractiveness Analysis by System Type
  • Figure 37: Western Europe Value Share and BPS Analysis by Application, 2025 and 2035
  • Figure 38: Western Europe Y-o-Y Growth Comparison by Application, 2025-2035
  • Figure 39: Western Europe Attractiveness Analysis by Application
  • Figure 40: Eastern Europe Value Share and BPS Analysis by Country, 2025 and 2035
  • Figure 41: Eastern Europe Value Share and BPS Analysis by System Type , 2025 and 2035
  • Figure 42: Eastern Europe Y-o-Y Growth Comparison by System Type , 2025-2035
  • Figure 43: Eastern Europe Attractiveness Analysis by System Type
  • Figure 44: Eastern Europe Value Share and BPS Analysis by Application, 2025 and 2035
  • Figure 45: Eastern Europe Y-o-Y Growth Comparison by Application, 2025-2035
  • Figure 46: Eastern Europe Attractiveness Analysis by Application
  • Figure 47: East Asia Value Share and BPS Analysis by Country, 2025 and 2035
  • Figure 48: East Asia Value Share and BPS Analysis by System Type , 2025 and 2035
  • Figure 49: East Asia Y-o-Y Growth Comparison by System Type , 2025-2035
  • Figure 50: East Asia Attractiveness Analysis by System Type
  • Figure 51: East Asia Value Share and BPS Analysis by Application, 2025 and 2035
  • Figure 52: East Asia Y-o-Y Growth Comparison by Application, 2025-2035
  • Figure 53: East Asia Attractiveness Analysis by Application
  • Figure 54: South Asia and Pacific Value Share and BPS Analysis by Country, 2025 and 2035
  • Figure 55: South Asia and Pacific Value Share and BPS Analysis by System Type , 2025 and 2035
  • Figure 56: South Asia and Pacific Y-o-Y Growth Comparison by System Type , 2025-2035
  • Figure 57: South Asia and Pacific Attractiveness Analysis by System Type
  • Figure 58: South Asia and Pacific Value Share and BPS Analysis by Application, 2025 and 2035
  • Figure 59: South Asia and Pacific Y-o-Y Growth Comparison by Application, 2025-2035
  • Figure 60: South Asia and Pacific Attractiveness Analysis by Application
  • Figure 61: Middle East & Africa Value Share and BPS Analysis by Country, 2025 and 2035
  • Figure 62: Middle East & Africa Value Share and BPS Analysis by System Type , 2025 and 2035
  • Figure 63: Middle East & Africa Y-o-Y Growth Comparison by System Type , 2025-2035
  • Figure 64: Middle East & Africa Attractiveness Analysis by System Type
  • Figure 65: Middle East & Africa Value Share and BPS Analysis by Application, 2025 and 2035
  • Figure 66: Middle East & Africa Y-o-Y Growth Comparison by Application, 2025-2035
  • Figure 67: Middle East & Africa Attractiveness Analysis by Application
  • Figure 68: Global - Tier Structure Analysis
  • Figure 69: Global - Company Share Analysis

Frequently Asked Questions

How big is the Western Europe automated people mover industry in 2025?

The global Western Europe automated people mover industry is estimated to be valued at USD 0.7 billion in 2025.

What will be the size of Western Europe automated people mover industry in 2035?

The market size for the Western Europe automated people mover industry is projected to reach USD 1.3 billion by 2035.

How much will be the Western Europe automated people mover industry growth between 2025 and 2035?

The Western Europe automated people mover industry is expected to grow at a 6.0% CAGR between 2025 and 2035.

What are the key product types in the Western Europe automated people mover industry?

The key product types in Western Europe automated people mover industry are monorail, duo rail and automated guide way transit or maglev.

Which application segment to contribute significant share in the Western Europe automated people mover industry in 2025?

In terms of application, urban transit segment to command 55.3% share in the Western Europe automated people mover industry in 2025.

Explore Similar Insights

Future Market Insights

Western Europe Automated People Mover Industry

Chat With MaRIA

Chat With

MaRIA

Hi There, I am MaRIA, Your Market Research Intelligence Assistant. How may I help you?