Western Europe Automotive Performance Tuning & Engine Remapping Market Size and Share Forecast Outlook 2025 to 2035

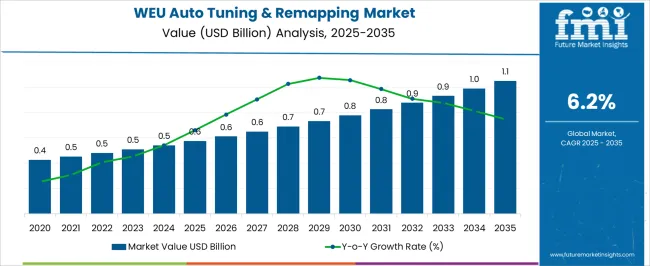
The Western Europe Automotive Performance Tuning & Engine Remapping Market is estimated to be valued at USD 0.6 billion in 2025 and is projected to reach USD 1.1 billion by 2035, registering a compound annual growth rate (CAGR) of 6.2% over the forecast period.
Quick Stats for Western Europe Automotive Performance Tuning & Engine Remapping Market

  • Western Europe Automotive Performance Tuning & Engine Remapping Market Industry Value (2025): USD 0.6 billion
  • Western Europe Automotive Performance Tuning & Engine Remapping Market Forecast Value (2035): USD 1.1 billion
  • Western Europe Automotive Performance Tuning & Engine Remapping Market Forecast CAGR: 6.2%
  • Leading Segment in Western Europe Automotive Performance Tuning & Engine Remapping Market in 2025: Passenger Cars (52.4%)
  • Key Growth Region in Western Europe Automotive Performance Tuning & Engine Remapping Market: North America, Asia-Pacific, Europe
  • Top Key Players in Western Europe Automotive Performance Tuning & Engine Remapping Market: Viezu TecTechnologie, RS Tuning, Quantum Tuning, Yorkshire Remaps, RJ Tuning

Weu Auto Tuning & Remapping Market Market Value Analysis

Metric Value
Western Europe Automotive Performance Tuning & Engine Remapping Market Estimated Value in (2025 E) USD 0.6 billion
Western Europe Automotive Performance Tuning & Engine Remapping Market Forecast Value in (2035 F) USD 1.1 billion
Forecast CAGR (2025 to 2035) 6.2%

Rationale for Segmental Growth in the Western Europe Automotive Performance Tuning & Engine Remapping Market

The Western Europe automotive performance tuning and engine remapping market is expanding steadily. Rising consumer interest in enhancing vehicle performance, improving fuel efficiency, and personalizing driving experiences is driving demand. Current market conditions reflect strong adoption across both OEM-authorized service providers and aftermarket tuning specialists.

Regulatory considerations regarding emissions and fuel efficiency are influencing the development of compliant tuning solutions. Increasing penetration of advanced ECU technologies and digital platforms has simplified remapping processes, making them more accessible to end-users. The market outlook remains positive, supported by technological advancements, expansion of specialized workshops, and growing awareness among vehicle owners regarding performance optimization.

Future growth is being underpinned by the combination of consumer preference for enhanced drivability, the availability of advanced software-driven solutions, and the regional automotive culture that emphasizes vehicle modification These factors collectively provide a strong rationale for the consistent growth of the market across Western Europe.
Segmental Analysis

Insights into the Vehicle Type Segment

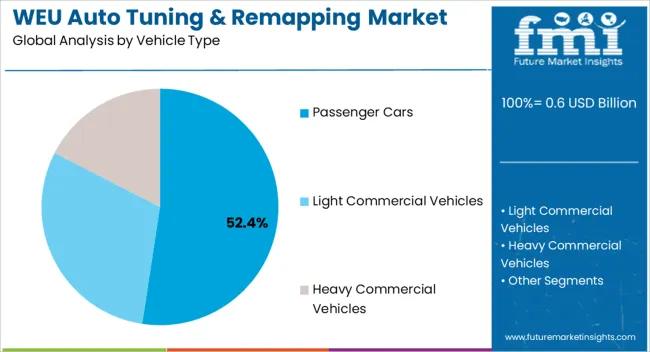
Weu Auto Tuning & Remapping Market Analysis By Vehicle Type

Passenger cars, accounting for 52.40% of the vehicle type category, dominate the market due to their widespread ownership and higher propensity for customization. Strong consumer demand for enhanced acceleration, improved throttle response, and optimized fuel efficiency has reinforced the prominence of this segment.

Availability of a wide range of tuning and remapping services tailored to passenger cars has further increased adoption. Technological advances in ECU programming and diagnostic tools have supported efficient, safe, and reversible tuning processes.

The appeal of performance tuning has been strengthened by enthusiasts as well as everyday users seeking better drivability As vehicle owners across Western Europe increasingly adopt personalization trends, passenger cars are expected to maintain their leadership, supported by growing availability of authorized and independent service providers.
Insights into the Fuel Type Segment

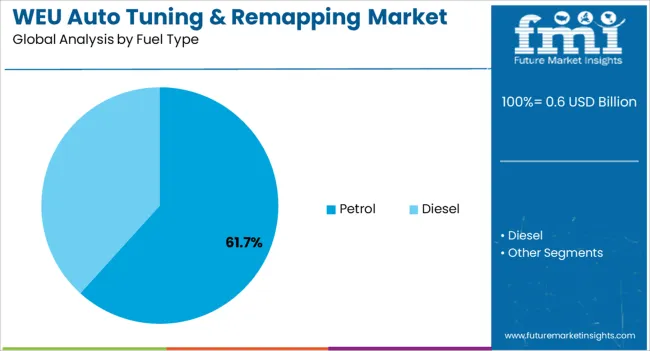
Weu Auto Tuning & Remapping Market Analysis By Fuel Type

The petrol segment, representing 61.70% of the fuel type category, has remained dominant due to the higher concentration of petrol-powered vehicles in the Western European fleet. Petrol engines are more receptive to tuning and remapping compared to diesel engines, offering greater scope for performance enhancements.

Consumer preference for smoother acceleration and sporty driving dynamics has supported stronger uptake within this category. In addition, stricter emissions regulations affecting diesel vehicles have further bolstered the market share of petrol tuning solutions.

Advancements in turbocharging and fuel injection systems have provided additional opportunities for remapping in petrol vehicles, improving both efficiency and power delivery With continued consumer demand for enhanced performance and compliance with evolving regulatory frameworks, the petrol segment is expected to retain its leading position.
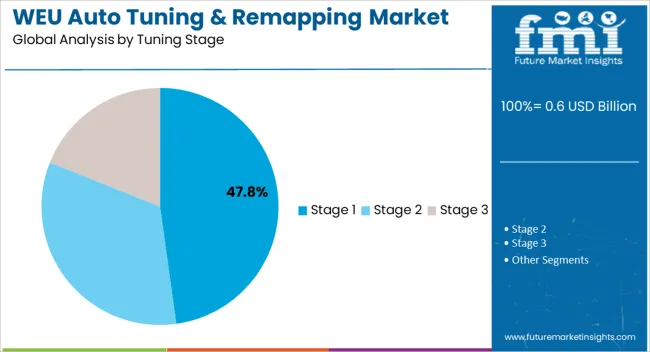
Insights into the Tuning Stage Segment

Weu Auto Tuning & Remapping Market Analysis By Tuning Stage

Stage 1 tuning, holding 47.80% of the tuning stage category, has emerged as the most adopted option due to its balance between performance gains and regulatory compliance. This stage requires no hardware modifications, making it cost-effective and accessible for a broad customer base.

Widespread availability of Stage 1 solutions across authorized dealers and independent workshops has accelerated adoption. Enhanced drivability, fuel efficiency improvements, and moderate power gains without compromising engine reliability have contributed to strong market acceptance.

Stage 1 remapping has also gained favor due to its reversible nature, allowing flexibility for end-users As consumers increasingly seek reliable yet effective performance upgrades, Stage 1 tuning is anticipated to remain the leading choice, supported by continuous software innovations and expanding service accessibility across Western Europe.

Key Trends Influencing Demand for Automotive Performance Tuning and Engine Remapping Service in Western Europe

  • Rise of electric and hybrid vehicles and growing interest in tuning solutions aimed at optimizing electric motors and hybrid powertrains
  • The demand for tuning and engine remapping in the automobile sector is creating different opportunities for engine tuning and remapping parts manufacturers and service providers.

Country-wise Insights

Increased automotive activities in the United Kingdom boost demand

A growing trend among car enthusiasts and drivers in the United Kingdom seeking ways to enhance vehicle performance. Whether achieving more power, better fuel efficiency, or improved driving dynamics, there is a rising demand for aftermarket solutions like automotive performance tuning and engine remapping services in the United Kingdom. The market in United Kingdom is expected to grow with a CAGR of 6.20% in 2025.

The automotive performance tuning and engine mapping service across the United Kingdom has gained traction due to the involvement of several well-established players in these regional markets. The rapidly rising popularity of passenger vehicle remapping services has boosted countries' revenue capacity.

The rapid technological advances in automotive technology drive industry demand in Germany

Germany is renowned for its automotive engineering prowess. This expertise has led to the developing advanced tuning solutions and performance upgrades. The market in Germany is expected to grow with a CAGR of 7.30% in 2025.

Germany has a vibrant automotive culture with a high number of performance-oriented car enthusiasts. This demand for improved performance and driving experience fuels the growth of the automotive performance tuning and engine remapping services

In recent years, manufacturers are continuously developed a new base of customers in Germany. The demand is expected to increase within Germany as the German automotive sector develops. Drivers in the country are looking for high performance as vehicles on the road grow.

Category-wise Insights

Passenger Car Segment to Hold a Lion’s Share

In 2025, the passenger car segment accounted for an industry share of 65%.

Performance tuning and engine remapping services have gained remarkable momentum in the passenger and commercial vehicle markets beyond their conventional application in auto racing.

Attribute Details
Vehicle Passenger Cars
Value Share 65%

Diesel Fuel Vehicle Segment Is Gaining Popularity

Diesel fuel vehicles have a significant share in automotive efficiency tuning and engine remapping. Diesel engines have substantial tuning potential. Engine remapping can result in noticeable power and torque gains, improving performance without compromising reliability or efficiency.

Diesel fuel vehicles are expected to account for over 60.1% of the market share by the end of the forecast period.

Attribute Details
Fuel Diesel
Value Share 60.1%

Competitive Landscape

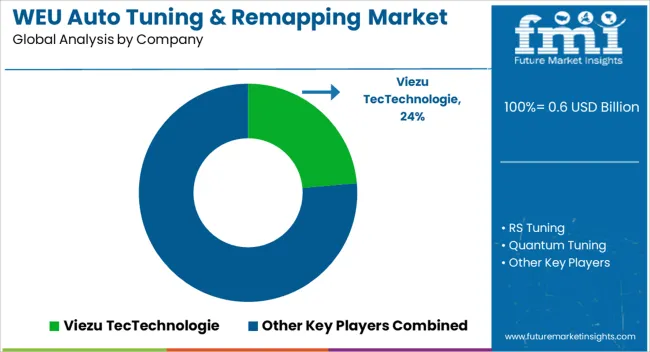
Weu Auto Tuning & Remapping Market Analysis By Company

With their extensive expertise, resources, and focus on sustainability, masking tape companies are actively contributing to expansion. Some participants concentrate on securing the largest possible market share by introducing the most cutting-edge technology through research & development tactics.

Many big players are also using mergers & acquisitions as a critical strategy for expanding their geographical presence and for more business in terms of revenue. Massive investments in Research and Development and strategic partnerships have allowed the players to establish a firm foothold in the market, enlarging their automotive performance tuning and engine remapping service share.

  • MRC Tuning operating from Banbury, UK, MRC Tuning specializes in high-performance tuning, offering services ranging from software upgrades to hardware modifications for various car brands.
  • Shiftech A Belgian company with a strong presence in Western Europe, Shiftech focuses on performance tuning and engine remapping services. They provide customized solutions for both gasoline and diesel engines.
  • Viezu Technologie based in Worcestershire, United Kingdom, Viezu Technologies specializes in ECU remapping, offering performance tuning solutions while focusing on maintaining fuel efficiency and emissions compliance.

Scope of the Report

Attribute Details
Estimated Industry Size in 2025 USD 0.6 billion
Projected Industry Size in 2035 USD 1.1 billion
Anticipated CAGR between 2025 to 2035 6.2% CAGR
Historical Analysis of Demand for Deployment of Automotive Performance Tuning and Engine Remapping Service in Western Europe 2020 to 2025
Demand Forecast for Deployment of Automotive Performance Tuning and Engine Remapping Service in Western Europe 2025 to 2035
Report Coverage Industry Size, Industry Trends, Analysis of key factors influencing Deployment of Automotive Performance Tuning and Engine Remapping Service in Western Europe, Insights on Global Players and their Industry Strategy in Western Europe, Ecosystem Analysis of Local Providers in Western Europe.
Key Countries Analyzed while Studying Opportunities in Deployment of Automotive Performance Tuning and Engine Remapping Service in Western Europe Germany, Italy, France, Spain, The United Kingdom, BENELUX, Rest of Western Europe
Key Companies Profiled Viezu TecTechnologie; RS Tuning; Quantum Tuning; Yorkshire Remaps; RJ Tuning

Key Segments Profiled in the Automotive Performance Tuning and Engine Remapping Service Industry Survey

By Vehicle Type:

  • Passenger Cars
  • Light Commercial Vehicles
  • Heavy Commercial Vehicles

By Fuel Type:

  • Petrol
  • Diesel

By Tuning Stage:

  • Stage 1
  • Stage 2
  • Stage 3

By Tuning Method:

  • OBD Ports
  • Bench Tuning

By Application:

  • Racing
  • Fuel Economizing
  • Performance Tuning

By Country:

  • Germany
  • Italy
  • France
  • Spain
  • The United Kingdom
  • BENELUX
  • Rest of Western Europe

Table of Content

  1. Executive Summary
    • Global Market Outlook
    • Demand-side Trends
    • Supply-side Trends
    • Technology Roadmap Analysis
    • Analysis and Recommendations
  2. Market Overview
    • Market Coverage / Taxonomy
    • Market Definition / Scope / Limitations
  3. Market Background
    • Market Dynamics
      • Drivers
      • Restraints
      • Opportunity
      • Trends
    • Scenario Forecast
      • Demand in Optimistic Scenario
      • Demand in Likely Scenario
      • Demand in Conservative Scenario
    • Opportunity Map Analysis
    • Product Life Cycle Analysis
    • Supply Chain Analysis
    • Investment Feasibility Matrix
    • Value Chain Analysis
    • PESTLE and Porter’s Analysis
    • Regulatory Landscape
    • Regional Parent Market Outlook
    • Production and Consumption Statistics
    • Import and Export Statistics
  4. Global Market Analysis 2020 to 2024 and Forecast, 2025 to 2035
    • Historical Market Size Value (USD Million) Analysis, 2020 to 2024
    • Current and Future Market Size Value (USD Million) Projections, 2025 to 2035
      • Y-o-Y Growth Trend Analysis
      • Absolute $ Opportunity Analysis
  5. Global Market Pricing Analysis 2020 to 2024 and Forecast 2025 to 2035
  6. Global Market Analysis 2020 to 2024 and Forecast 2025 to 2035, By Vehicle Type
    • Introduction / Key Findings
    • Historical Market Size Value (USD Million) Analysis By Vehicle Type , 2020 to 2024
    • Current and Future Market Size Value (USD Million) Analysis and Forecast By Vehicle Type , 2025 to 2035
      • Passenger Cars
      • Light Commercial Vehicles
      • Heavy Commercial Vehicles
    • Y-o-Y Growth Trend Analysis By Vehicle Type , 2020 to 2024
    • Absolute $ Opportunity Analysis By Vehicle Type , 2025 to 2035
  7. Global Market Analysis 2020 to 2024 and Forecast 2025 to 2035, By Fuel Type
    • Introduction / Key Findings
    • Historical Market Size Value (USD Million) Analysis By Fuel Type, 2020 to 2024
    • Current and Future Market Size Value (USD Million) Analysis and Forecast By Fuel Type, 2025 to 2035
      • Petrol
      • Diesel
    • Y-o-Y Growth Trend Analysis By Fuel Type, 2020 to 2024
    • Absolute $ Opportunity Analysis By Fuel Type, 2025 to 2035
  8. Global Market Analysis 2020 to 2024 and Forecast 2025 to 2035, By Tuning Stage
    • Introduction / Key Findings
    • Historical Market Size Value (USD Million) Analysis By Tuning Stage, 2020 to 2024
    • Current and Future Market Size Value (USD Million) Analysis and Forecast By Tuning Stage, 2025 to 2035
      • Stage 1
      • Stage 2
      • Stage 3
    • Y-o-Y Growth Trend Analysis By Tuning Stage, 2020 to 2024
    • Absolute $ Opportunity Analysis By Tuning Stage, 2025 to 2035
  9. Global Market Analysis 2020 to 2024 and Forecast 2025 to 2035, By Tuning Method
    • Introduction / Key Findings
    • Historical Market Size Value (USD Million) Analysis By Tuning Method, 2020 to 2024
    • Current and Future Market Size Value (USD Million) Analysis and Forecast By Tuning Method, 2025 to 2035
      • OBD Ports
      • Bench Tuning
    • Y-o-Y Growth Trend Analysis By Tuning Method, 2020 to 2024
    • Absolute $ Opportunity Analysis By Tuning Method, 2025 to 2035
  10. Global Market Analysis 2020 to 2024 and Forecast 2025 to 2035, By Application
    • Introduction / Key Findings
    • Historical Market Size Value (USD Million) Analysis By Application, 2020 to 2024
    • Current and Future Market Size Value (USD Million) Analysis and Forecast By Application, 2025 to 2035
      • Performance Tuning
      • Racing
      • Fuel Economizing
    • Y-o-Y Growth Trend Analysis By Application, 2020 to 2024
    • Absolute $ Opportunity Analysis By Application, 2025 to 2035
  11. Global Market Analysis 2020 to 2024 and Forecast 2025 to 2035, By Region
    • Introduction
    • Historical Market Size Value (USD Million) Analysis By Region, 2020 to 2024
    • Current Market Size Value (USD Million) Analysis and Forecast By Region, 2025 to 2035
      • North America
      • Latin America
      • Western Europe
      • Eastern Europe
      • East Asia
      • South Asia and Pacific
      • Middle East & Africa
    • Market Attractiveness Analysis By Region
  12. North America Market Analysis 2020 to 2024 and Forecast 2025 to 2035, By Country
    • Historical Market Size Value (USD Million) Trend Analysis By Market Taxonomy, 2020 to 2024
    • Market Size Value (USD Million) Forecast By Market Taxonomy, 2025 to 2035
      • By Country
        • USA
        • Canada
        • Mexico
      • By Vehicle Type
      • By Fuel Type
      • By Tuning Stage
      • By Tuning Method
      • By Application
    • Market Attractiveness Analysis
      • By Country
      • By Vehicle Type
      • By Fuel Type
      • By Tuning Stage
      • By Tuning Method
      • By Application
    • Key Takeaways
  13. Latin America Market Analysis 2020 to 2024 and Forecast 2025 to 2035, By Country
    • Historical Market Size Value (USD Million) Trend Analysis By Market Taxonomy, 2020 to 2024
    • Market Size Value (USD Million) Forecast By Market Taxonomy, 2025 to 2035
      • By Country
        • Brazil
        • Chile
        • Rest of Latin America
      • By Vehicle Type
      • By Fuel Type
      • By Tuning Stage
      • By Tuning Method
      • By Application
    • Market Attractiveness Analysis
      • By Country
      • By Vehicle Type
      • By Fuel Type
      • By Tuning Stage
      • By Tuning Method
      • By Application
    • Key Takeaways
  14. Western Europe Market Analysis 2020 to 2024 and Forecast 2025 to 2035, By Country
    • Historical Market Size Value (USD Million) Trend Analysis By Market Taxonomy, 2020 to 2024
    • Market Size Value (USD Million) Forecast By Market Taxonomy, 2025 to 2035
      • By Country
        • Germany
        • UK
        • Italy
        • Spain
        • France
        • Nordic
        • BENELUX
        • Rest of Western Europe
      • By Vehicle Type
      • By Fuel Type
      • By Tuning Stage
      • By Tuning Method
      • By Application
    • Market Attractiveness Analysis
      • By Country
      • By Vehicle Type
      • By Fuel Type
      • By Tuning Stage
      • By Tuning Method
      • By Application
    • Key Takeaways
  15. Eastern Europe Market Analysis 2020 to 2024 and Forecast 2025 to 2035, By Country
    • Historical Market Size Value (USD Million) Trend Analysis By Market Taxonomy, 2020 to 2024
    • Market Size Value (USD Million) Forecast By Market Taxonomy, 2025 to 2035
      • By Country
        • Russia
        • Poland
        • Hungary
        • Balkan & Baltic
        • Rest of Eastern Europe
      • By Vehicle Type
      • By Fuel Type
      • By Tuning Stage
      • By Tuning Method
      • By Application
    • Market Attractiveness Analysis
      • By Country
      • By Vehicle Type
      • By Fuel Type
      • By Tuning Stage
      • By Tuning Method
      • By Application
    • Key Takeaways
  16. East Asia Market Analysis 2020 to 2024 and Forecast 2025 to 2035, By Country
    • Historical Market Size Value (USD Million) Trend Analysis By Market Taxonomy, 2020 to 2024
    • Market Size Value (USD Million) Forecast By Market Taxonomy, 2025 to 2035
      • By Country
        • China
        • Japan
        • South Korea
      • By Vehicle Type
      • By Fuel Type
      • By Tuning Stage
      • By Tuning Method
      • By Application
    • Market Attractiveness Analysis
      • By Country
      • By Vehicle Type
      • By Fuel Type
      • By Tuning Stage
      • By Tuning Method
      • By Application
    • Key Takeaways
  17. South Asia and Pacific Market Analysis 2020 to 2024 and Forecast 2025 to 2035, By Country
    • Historical Market Size Value (USD Million) Trend Analysis By Market Taxonomy, 2020 to 2024
    • Market Size Value (USD Million) Forecast By Market Taxonomy, 2025 to 2035
      • By Country
        • India
        • ASEAN
        • Australia & New Zealand
        • Rest of South Asia and Pacific
      • By Vehicle Type
      • By Fuel Type
      • By Tuning Stage
      • By Tuning Method
      • By Application
    • Market Attractiveness Analysis
      • By Country
      • By Vehicle Type
      • By Fuel Type
      • By Tuning Stage
      • By Tuning Method
      • By Application
    • Key Takeaways
  18. Middle East & Africa Market Analysis 2020 to 2024 and Forecast 2025 to 2035, By Country
    • Historical Market Size Value (USD Million) Trend Analysis By Market Taxonomy, 2020 to 2024
    • Market Size Value (USD Million) Forecast By Market Taxonomy, 2025 to 2035
      • By Country
        • Kingdom of Saudi Arabia
        • Other GCC Countries
        • Turkiye
        • South Africa
        • Other African Union
        • Rest of Middle East & Africa
      • By Vehicle Type
      • By Fuel Type
      • By Tuning Stage
      • By Tuning Method
      • By Application
    • Market Attractiveness Analysis
      • By Country
      • By Vehicle Type
      • By Fuel Type
      • By Tuning Stage
      • By Tuning Method
      • By Application
    • Key Takeaways
  19. Key Countries Market Analysis
    • USA
      • Pricing Analysis
      • Market Share Analysis, 2024
        • By Vehicle Type
        • By Fuel Type
        • By Tuning Stage
        • By Tuning Method
        • By Application
    • Canada
      • Pricing Analysis
      • Market Share Analysis, 2024
        • By Vehicle Type
        • By Fuel Type
        • By Tuning Stage
        • By Tuning Method
        • By Application
    • Mexico
      • Pricing Analysis
      • Market Share Analysis, 2024
        • By Vehicle Type
        • By Fuel Type
        • By Tuning Stage
        • By Tuning Method
        • By Application
    • Brazil
      • Pricing Analysis
      • Market Share Analysis, 2024
        • By Vehicle Type
        • By Fuel Type
        • By Tuning Stage
        • By Tuning Method
        • By Application
    • Chile
      • Pricing Analysis
      • Market Share Analysis, 2024
        • By Vehicle Type
        • By Fuel Type
        • By Tuning Stage
        • By Tuning Method
        • By Application
    • Germany
      • Pricing Analysis
      • Market Share Analysis, 2024
        • By Vehicle Type
        • By Fuel Type
        • By Tuning Stage
        • By Tuning Method
        • By Application
    • UK
      • Pricing Analysis
      • Market Share Analysis, 2024
        • By Vehicle Type
        • By Fuel Type
        • By Tuning Stage
        • By Tuning Method
        • By Application
    • Italy
      • Pricing Analysis
      • Market Share Analysis, 2024
        • By Vehicle Type
        • By Fuel Type
        • By Tuning Stage
        • By Tuning Method
        • By Application
    • Spain
      • Pricing Analysis
      • Market Share Analysis, 2024
        • By Vehicle Type
        • By Fuel Type
        • By Tuning Stage
        • By Tuning Method
        • By Application
    • France
      • Pricing Analysis
      • Market Share Analysis, 2024
        • By Vehicle Type
        • By Fuel Type
        • By Tuning Stage
        • By Tuning Method
        • By Application
    • India
      • Pricing Analysis
      • Market Share Analysis, 2024
        • By Vehicle Type
        • By Fuel Type
        • By Tuning Stage
        • By Tuning Method
        • By Application
    • ASEAN
      • Pricing Analysis
      • Market Share Analysis, 2024
        • By Vehicle Type
        • By Fuel Type
        • By Tuning Stage
        • By Tuning Method
        • By Application
    • Australia & New Zealand
      • Pricing Analysis
      • Market Share Analysis, 2024
        • By Vehicle Type
        • By Fuel Type
        • By Tuning Stage
        • By Tuning Method
        • By Application
    • China
      • Pricing Analysis
      • Market Share Analysis, 2024
        • By Vehicle Type
        • By Fuel Type
        • By Tuning Stage
        • By Tuning Method
        • By Application
    • Japan
      • Pricing Analysis
      • Market Share Analysis, 2024
        • By Vehicle Type
        • By Fuel Type
        • By Tuning Stage
        • By Tuning Method
        • By Application
    • South Korea
      • Pricing Analysis
      • Market Share Analysis, 2024
        • By Vehicle Type
        • By Fuel Type
        • By Tuning Stage
        • By Tuning Method
        • By Application
    • Russia
      • Pricing Analysis
      • Market Share Analysis, 2024
        • By Vehicle Type
        • By Fuel Type
        • By Tuning Stage
        • By Tuning Method
        • By Application
    • Poland
      • Pricing Analysis
      • Market Share Analysis, 2024
        • By Vehicle Type
        • By Fuel Type
        • By Tuning Stage
        • By Tuning Method
        • By Application
    • Hungary
      • Pricing Analysis
      • Market Share Analysis, 2024
        • By Vehicle Type
        • By Fuel Type
        • By Tuning Stage
        • By Tuning Method
        • By Application
    • Kingdom of Saudi Arabia
      • Pricing Analysis
      • Market Share Analysis, 2024
        • By Vehicle Type
        • By Fuel Type
        • By Tuning Stage
        • By Tuning Method
        • By Application
    • Turkiye
      • Pricing Analysis
      • Market Share Analysis, 2024
        • By Vehicle Type
        • By Fuel Type
        • By Tuning Stage
        • By Tuning Method
        • By Application
    • South Africa
      • Pricing Analysis
      • Market Share Analysis, 2024
        • By Vehicle Type
        • By Fuel Type
        • By Tuning Stage
        • By Tuning Method
        • By Application
  20. Market Structure Analysis
    • Competition Dashboard
    • Competition Benchmarking
    • Market Share Analysis of Top Players
      • By Regional
      • By Vehicle Type
      • By Fuel Type
      • By Tuning Stage
      • By Tuning Method
      • By Application
  21. Competition Analysis
    • Competition Deep Dive
      • Viezu TecTechnologie
        • Overview
        • Product Portfolio
        • Profitability by Market Segments (Product/Age /Sales Channel/Region)
        • Sales Footprint
        • Strategy Overview
          • Marketing Strategy
          • Product Strategy
          • Channel Strategy
      • RS Tuning
      • Quantum Tuning
      • Yorkshire Remaps
      • RJ Tuning
  22. Assumptions & Acronyms Used
  23. Research Methodology

List of Tables

  • Table 1: Global Market Value (USD Million) Forecast by Region, 2020-2035
  • Table 2: Global Market Value (USD Million) Forecast by Vehicle Type , 2020-2035
  • Table 3: Global Market Value (USD Million) Forecast by Fuel Type, 2020-2035
  • Table 4: Global Market Value (USD Million) Forecast by Tuning Stage, 2020-2035
  • Table 5: Global Market Value (USD Million) Forecast by Tuning Method, 2020-2035
  • Table 6: Global Market Value (USD Million) Forecast by Application, 2020-2035
  • Table 7: North America Market Value (USD Million) Forecast by Country, 2020-2035
  • Table 8: North America Market Value (USD Million) Forecast by Vehicle Type , 2020-2035
  • Table 9: North America Market Value (USD Million) Forecast by Fuel Type, 2020-2035
  • Table 10: North America Market Value (USD Million) Forecast by Tuning Stage, 2020-2035
  • Table 11: North America Market Value (USD Million) Forecast by Tuning Method, 2020-2035
  • Table 12: North America Market Value (USD Million) Forecast by Application, 2020-2035
  • Table 13: Latin America Market Value (USD Million) Forecast by Country, 2020-2035
  • Table 14: Latin America Market Value (USD Million) Forecast by Vehicle Type , 2020-2035
  • Table 15: Latin America Market Value (USD Million) Forecast by Fuel Type, 2020-2035
  • Table 16: Latin America Market Value (USD Million) Forecast by Tuning Stage, 2020-2035
  • Table 17: Latin America Market Value (USD Million) Forecast by Tuning Method, 2020-2035
  • Table 18: Latin America Market Value (USD Million) Forecast by Application, 2020-2035
  • Table 19: Western Europe Market Value (USD Million) Forecast by Country, 2020-2035
  • Table 20: Western Europe Market Value (USD Million) Forecast by Vehicle Type , 2020-2035
  • Table 21: Western Europe Market Value (USD Million) Forecast by Fuel Type, 2020-2035
  • Table 22: Western Europe Market Value (USD Million) Forecast by Tuning Stage, 2020-2035
  • Table 23: Western Europe Market Value (USD Million) Forecast by Tuning Method, 2020-2035
  • Table 24: Western Europe Market Value (USD Million) Forecast by Application, 2020-2035
  • Table 25: Eastern Europe Market Value (USD Million) Forecast by Country, 2020-2035
  • Table 26: Eastern Europe Market Value (USD Million) Forecast by Vehicle Type , 2020-2035
  • Table 27: Eastern Europe Market Value (USD Million) Forecast by Fuel Type, 2020-2035
  • Table 28: Eastern Europe Market Value (USD Million) Forecast by Tuning Stage, 2020-2035
  • Table 29: Eastern Europe Market Value (USD Million) Forecast by Tuning Method, 2020-2035
  • Table 30: Eastern Europe Market Value (USD Million) Forecast by Application, 2020-2035
  • Table 31: East Asia Market Value (USD Million) Forecast by Country, 2020-2035
  • Table 32: East Asia Market Value (USD Million) Forecast by Vehicle Type , 2020-2035
  • Table 33: East Asia Market Value (USD Million) Forecast by Fuel Type, 2020-2035
  • Table 34: East Asia Market Value (USD Million) Forecast by Tuning Stage, 2020-2035
  • Table 35: East Asia Market Value (USD Million) Forecast by Tuning Method, 2020-2035
  • Table 36: East Asia Market Value (USD Million) Forecast by Application, 2020-2035
  • Table 37: South Asia and Pacific Market Value (USD Million) Forecast by Country, 2020-2035
  • Table 38: South Asia and Pacific Market Value (USD Million) Forecast by Vehicle Type , 2020-2035
  • Table 39: South Asia and Pacific Market Value (USD Million) Forecast by Fuel Type, 2020-2035
  • Table 40: South Asia and Pacific Market Value (USD Million) Forecast by Tuning Stage, 2020-2035
  • Table 41: South Asia and Pacific Market Value (USD Million) Forecast by Tuning Method, 2020-2035
  • Table 42: South Asia and Pacific Market Value (USD Million) Forecast by Application, 2020-2035
  • Table 43: Middle East & Africa Market Value (USD Million) Forecast by Country, 2020-2035
  • Table 44: Middle East & Africa Market Value (USD Million) Forecast by Vehicle Type , 2020-2035
  • Table 45: Middle East & Africa Market Value (USD Million) Forecast by Fuel Type, 2020-2035
  • Table 46: Middle East & Africa Market Value (USD Million) Forecast by Tuning Stage, 2020-2035
  • Table 47: Middle East & Africa Market Value (USD Million) Forecast by Tuning Method, 2020-2035
  • Table 48: Middle East & Africa Market Value (USD Million) Forecast by Application, 2020-2035

List of Figures

  • Figure 1: Global Market Pricing Analysis
  • Figure 2: Global Market Value (USD Million) Forecast 2020-2035
  • Figure 3: Global Market Value Share and BPS Analysis by Vehicle Type , 2025 and 2035
  • Figure 4: Global Market Y-o-Y Growth Comparison by Vehicle Type , 2025-2035
  • Figure 5: Global Market Attractiveness Analysis by Vehicle Type
  • Figure 6: Global Market Value Share and BPS Analysis by Fuel Type, 2025 and 2035
  • Figure 7: Global Market Y-o-Y Growth Comparison by Fuel Type, 2025-2035
  • Figure 8: Global Market Attractiveness Analysis by Fuel Type
  • Figure 9: Global Market Value Share and BPS Analysis by Tuning Stage, 2025 and 2035
  • Figure 10: Global Market Y-o-Y Growth Comparison by Tuning Stage, 2025-2035
  • Figure 11: Global Market Attractiveness Analysis by Tuning Stage
  • Figure 12: Global Market Value Share and BPS Analysis by Tuning Method, 2025 and 2035
  • Figure 13: Global Market Y-o-Y Growth Comparison by Tuning Method, 2025-2035
  • Figure 14: Global Market Attractiveness Analysis by Tuning Method
  • Figure 15: Global Market Value Share and BPS Analysis by Application, 2025 and 2035
  • Figure 16: Global Market Y-o-Y Growth Comparison by Application, 2025-2035
  • Figure 17: Global Market Attractiveness Analysis by Application
  • Figure 18: Global Market Value (USD Million) Share and BPS Analysis by Region, 2025 and 2035
  • Figure 19: Global Market Y-o-Y Growth Comparison by Region, 2025-2035
  • Figure 20: Global Market Attractiveness Analysis by Region
  • Figure 21: North America Market Incremental Dollar Opportunity, 2025-2035
  • Figure 22: Latin America Market Incremental Dollar Opportunity, 2025-2035
  • Figure 23: Western Europe Market Incremental Dollar Opportunity, 2025-2035
  • Figure 24: Eastern Europe Market Incremental Dollar Opportunity, 2025-2035
  • Figure 25: East Asia Market Incremental Dollar Opportunity, 2025-2035
  • Figure 26: South Asia and Pacific Market Incremental Dollar Opportunity, 2025-2035
  • Figure 27: Middle East & Africa Market Incremental Dollar Opportunity, 2025-2035
  • Figure 28: North America Market Value Share and BPS Analysis by Country, 2025 and 2035
  • Figure 29: North America Market Value Share and BPS Analysis by Vehicle Type , 2025 and 2035
  • Figure 30: North America Market Y-o-Y Growth Comparison by Vehicle Type , 2025-2035
  • Figure 31: North America Market Attractiveness Analysis by Vehicle Type
  • Figure 32: North America Market Value Share and BPS Analysis by Fuel Type, 2025 and 2035
  • Figure 33: North America Market Y-o-Y Growth Comparison by Fuel Type, 2025-2035
  • Figure 34: North America Market Attractiveness Analysis by Fuel Type
  • Figure 35: North America Market Value Share and BPS Analysis by Tuning Stage, 2025 and 2035
  • Figure 36: North America Market Y-o-Y Growth Comparison by Tuning Stage, 2025-2035
  • Figure 37: North America Market Attractiveness Analysis by Tuning Stage
  • Figure 38: North America Market Value Share and BPS Analysis by Tuning Method, 2025 and 2035
  • Figure 39: North America Market Y-o-Y Growth Comparison by Tuning Method, 2025-2035
  • Figure 40: North America Market Attractiveness Analysis by Tuning Method
  • Figure 41: North America Market Value Share and BPS Analysis by Application, 2025 and 2035
  • Figure 42: North America Market Y-o-Y Growth Comparison by Application, 2025-2035
  • Figure 43: North America Market Attractiveness Analysis by Application
  • Figure 44: Latin America Market Value Share and BPS Analysis by Country, 2025 and 2035
  • Figure 45: Latin America Market Value Share and BPS Analysis by Vehicle Type , 2025 and 2035
  • Figure 46: Latin America Market Y-o-Y Growth Comparison by Vehicle Type , 2025-2035
  • Figure 47: Latin America Market Attractiveness Analysis by Vehicle Type
  • Figure 48: Latin America Market Value Share and BPS Analysis by Fuel Type, 2025 and 2035
  • Figure 49: Latin America Market Y-o-Y Growth Comparison by Fuel Type, 2025-2035
  • Figure 50: Latin America Market Attractiveness Analysis by Fuel Type
  • Figure 51: Latin America Market Value Share and BPS Analysis by Tuning Stage, 2025 and 2035
  • Figure 52: Latin America Market Y-o-Y Growth Comparison by Tuning Stage, 2025-2035
  • Figure 53: Latin America Market Attractiveness Analysis by Tuning Stage
  • Figure 54: Latin America Market Value Share and BPS Analysis by Tuning Method, 2025 and 2035
  • Figure 55: Latin America Market Y-o-Y Growth Comparison by Tuning Method, 2025-2035
  • Figure 56: Latin America Market Attractiveness Analysis by Tuning Method
  • Figure 57: Latin America Market Value Share and BPS Analysis by Application, 2025 and 2035
  • Figure 58: Latin America Market Y-o-Y Growth Comparison by Application, 2025-2035
  • Figure 59: Latin America Market Attractiveness Analysis by Application
  • Figure 60: Western Europe Market Value Share and BPS Analysis by Country, 2025 and 2035
  • Figure 61: Western Europe Market Value Share and BPS Analysis by Vehicle Type , 2025 and 2035
  • Figure 62: Western Europe Market Y-o-Y Growth Comparison by Vehicle Type , 2025-2035
  • Figure 63: Western Europe Market Attractiveness Analysis by Vehicle Type
  • Figure 64: Western Europe Market Value Share and BPS Analysis by Fuel Type, 2025 and 2035
  • Figure 65: Western Europe Market Y-o-Y Growth Comparison by Fuel Type, 2025-2035
  • Figure 66: Western Europe Market Attractiveness Analysis by Fuel Type
  • Figure 67: Western Europe Market Value Share and BPS Analysis by Tuning Stage, 2025 and 2035
  • Figure 68: Western Europe Market Y-o-Y Growth Comparison by Tuning Stage, 2025-2035
  • Figure 69: Western Europe Market Attractiveness Analysis by Tuning Stage
  • Figure 70: Western Europe Market Value Share and BPS Analysis by Tuning Method, 2025 and 2035
  • Figure 71: Western Europe Market Y-o-Y Growth Comparison by Tuning Method, 2025-2035
  • Figure 72: Western Europe Market Attractiveness Analysis by Tuning Method
  • Figure 73: Western Europe Market Value Share and BPS Analysis by Application, 2025 and 2035
  • Figure 74: Western Europe Market Y-o-Y Growth Comparison by Application, 2025-2035
  • Figure 75: Western Europe Market Attractiveness Analysis by Application
  • Figure 76: Eastern Europe Market Value Share and BPS Analysis by Country, 2025 and 2035
  • Figure 77: Eastern Europe Market Value Share and BPS Analysis by Vehicle Type , 2025 and 2035
  • Figure 78: Eastern Europe Market Y-o-Y Growth Comparison by Vehicle Type , 2025-2035
  • Figure 79: Eastern Europe Market Attractiveness Analysis by Vehicle Type
  • Figure 80: Eastern Europe Market Value Share and BPS Analysis by Fuel Type, 2025 and 2035
  • Figure 81: Eastern Europe Market Y-o-Y Growth Comparison by Fuel Type, 2025-2035
  • Figure 82: Eastern Europe Market Attractiveness Analysis by Fuel Type
  • Figure 83: Eastern Europe Market Value Share and BPS Analysis by Tuning Stage, 2025 and 2035
  • Figure 84: Eastern Europe Market Y-o-Y Growth Comparison by Tuning Stage, 2025-2035
  • Figure 85: Eastern Europe Market Attractiveness Analysis by Tuning Stage
  • Figure 86: Eastern Europe Market Value Share and BPS Analysis by Tuning Method, 2025 and 2035
  • Figure 87: Eastern Europe Market Y-o-Y Growth Comparison by Tuning Method, 2025-2035
  • Figure 88: Eastern Europe Market Attractiveness Analysis by Tuning Method
  • Figure 89: Eastern Europe Market Value Share and BPS Analysis by Application, 2025 and 2035
  • Figure 90: Eastern Europe Market Y-o-Y Growth Comparison by Application, 2025-2035
  • Figure 91: Eastern Europe Market Attractiveness Analysis by Application
  • Figure 92: East Asia Market Value Share and BPS Analysis by Country, 2025 and 2035
  • Figure 93: East Asia Market Value Share and BPS Analysis by Vehicle Type , 2025 and 2035
  • Figure 94: East Asia Market Y-o-Y Growth Comparison by Vehicle Type , 2025-2035
  • Figure 95: East Asia Market Attractiveness Analysis by Vehicle Type
  • Figure 96: East Asia Market Value Share and BPS Analysis by Fuel Type, 2025 and 2035
  • Figure 97: East Asia Market Y-o-Y Growth Comparison by Fuel Type, 2025-2035
  • Figure 98: East Asia Market Attractiveness Analysis by Fuel Type
  • Figure 99: East Asia Market Value Share and BPS Analysis by Tuning Stage, 2025 and 2035
  • Figure 100: East Asia Market Y-o-Y Growth Comparison by Tuning Stage, 2025-2035
  • Figure 101: East Asia Market Attractiveness Analysis by Tuning Stage
  • Figure 102: East Asia Market Value Share and BPS Analysis by Tuning Method, 2025 and 2035
  • Figure 103: East Asia Market Y-o-Y Growth Comparison by Tuning Method, 2025-2035
  • Figure 104: East Asia Market Attractiveness Analysis by Tuning Method
  • Figure 105: East Asia Market Value Share and BPS Analysis by Application, 2025 and 2035
  • Figure 106: East Asia Market Y-o-Y Growth Comparison by Application, 2025-2035
  • Figure 107: East Asia Market Attractiveness Analysis by Application
  • Figure 108: South Asia and Pacific Market Value Share and BPS Analysis by Country, 2025 and 2035
  • Figure 109: South Asia and Pacific Market Value Share and BPS Analysis by Vehicle Type , 2025 and 2035
  • Figure 110: South Asia and Pacific Market Y-o-Y Growth Comparison by Vehicle Type , 2025-2035
  • Figure 111: South Asia and Pacific Market Attractiveness Analysis by Vehicle Type
  • Figure 112: South Asia and Pacific Market Value Share and BPS Analysis by Fuel Type, 2025 and 2035
  • Figure 113: South Asia and Pacific Market Y-o-Y Growth Comparison by Fuel Type, 2025-2035
  • Figure 114: South Asia and Pacific Market Attractiveness Analysis by Fuel Type
  • Figure 115: South Asia and Pacific Market Value Share and BPS Analysis by Tuning Stage, 2025 and 2035
  • Figure 116: South Asia and Pacific Market Y-o-Y Growth Comparison by Tuning Stage, 2025-2035
  • Figure 117: South Asia and Pacific Market Attractiveness Analysis by Tuning Stage
  • Figure 118: South Asia and Pacific Market Value Share and BPS Analysis by Tuning Method, 2025 and 2035
  • Figure 119: South Asia and Pacific Market Y-o-Y Growth Comparison by Tuning Method, 2025-2035
  • Figure 120: South Asia and Pacific Market Attractiveness Analysis by Tuning Method
  • Figure 121: South Asia and Pacific Market Value Share and BPS Analysis by Application, 2025 and 2035
  • Figure 122: South Asia and Pacific Market Y-o-Y Growth Comparison by Application, 2025-2035
  • Figure 123: South Asia and Pacific Market Attractiveness Analysis by Application
  • Figure 124: Middle East & Africa Market Value Share and BPS Analysis by Country, 2025 and 2035
  • Figure 125: Middle East & Africa Market Value Share and BPS Analysis by Vehicle Type , 2025 and 2035
  • Figure 126: Middle East & Africa Market Y-o-Y Growth Comparison by Vehicle Type , 2025-2035
  • Figure 127: Middle East & Africa Market Attractiveness Analysis by Vehicle Type
  • Figure 128: Middle East & Africa Market Value Share and BPS Analysis by Fuel Type, 2025 and 2035
  • Figure 129: Middle East & Africa Market Y-o-Y Growth Comparison by Fuel Type, 2025-2035
  • Figure 130: Middle East & Africa Market Attractiveness Analysis by Fuel Type
  • Figure 131: Middle East & Africa Market Value Share and BPS Analysis by Tuning Stage, 2025 and 2035
  • Figure 132: Middle East & Africa Market Y-o-Y Growth Comparison by Tuning Stage, 2025-2035
  • Figure 133: Middle East & Africa Market Attractiveness Analysis by Tuning Stage
  • Figure 134: Middle East & Africa Market Value Share and BPS Analysis by Tuning Method, 2025 and 2035
  • Figure 135: Middle East & Africa Market Y-o-Y Growth Comparison by Tuning Method, 2025-2035
  • Figure 136: Middle East & Africa Market Attractiveness Analysis by Tuning Method
  • Figure 137: Middle East & Africa Market Value Share and BPS Analysis by Application, 2025 and 2035
  • Figure 138: Middle East & Africa Market Y-o-Y Growth Comparison by Application, 2025-2035
  • Figure 139: Middle East & Africa Market Attractiveness Analysis by Application
  • Figure 140: Global Market - Tier Structure Analysis
  • Figure 141: Global Market - Company Share Analysis

Frequently Asked Questions

How big is the Western Europe automotive performance tuning & engine remapping market in 2025?

The global Western Europe automotive performance tuning & engine remapping market is estimated to be valued at USD 0.6 billion in 2025.

What will be the size of Western Europe automotive performance tuning & engine remapping market in 2035?

The market size for the Western Europe automotive performance tuning & engine remapping market is projected to reach USD 1.1 billion by 2035.

How much will be the Western Europe automotive performance tuning & engine remapping market growth between 2025 and 2035?

The Western Europe automotive performance tuning & engine remapping market is expected to grow at a 6.2% CAGR between 2025 and 2035.

What are the key product types in the Western Europe automotive performance tuning & engine remapping market?

The key product types in Western Europe automotive performance tuning & engine remapping market are passenger cars, light commercial vehicles and heavy commercial vehicles.

Which fuel type segment to contribute significant share in the Western Europe automotive performance tuning & engine remapping market in 2025?

In terms of fuel type, petrol segment to command 61.7% share in the Western Europe automotive performance tuning & engine remapping market in 2025.

Explore Similar Insights

Future Market Insights

Western Europe Automotive Performance Tuning & Engine Remapping Market

Chat With MaRIA

Chat With

MaRIA

Hi There, I am MaRIA, Your Market Research Intelligence Assistant. How may I help you?