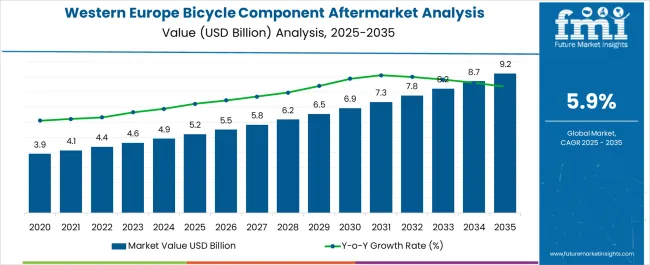
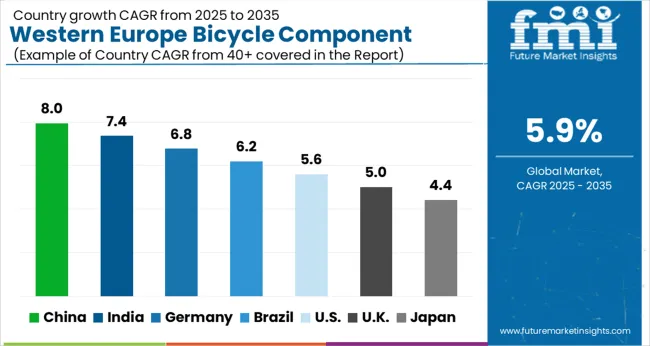
The bicycle component aftermarket in Western Europe is expected to demonstrate a CAGR of 6.2% by 2034. The bicycle components aftermarket in Western Europe is poised to witness significant opportunities with USD 4,902.8 million in 2024.
Attributes | Details |
---|---|
Demand Analysis (2024) | USD 4,902.8 million |
Demand Forecast (2034) | USD 8,947.25 million |
CAGR Estimation (2024 to 2034) | 6.2% |
The bicycle components aftermarket is witnessing substantial growth driven by the increasing adoption of green energy, stringent global regulations addressing rising carbon footprints, and significant investments in developing environmentally efficient modes of transportation. By 2034, bicycle components aftermarket in Western Europe will likely secure USD 8,947.25 million.
The bicycle component aftermarket in Italy is projected to experience growth with a CAGR of 6.3% through 2034, indicating a thriving market. Meanwhile, despite exhibiting a slightly lower CAGR of 5.8%, Germany still signifies a steady and promising trajectory in the aftermarket sector. Both countries showcase positive trends, reflecting a buoyant landscape for bicycle component sales and adoption.
Countries | CAGR through 2034 |
---|---|
Italy | 6.3% |
Germany | 5.8% |
The bicycle component aftermarket in Italy is on an upward trajectory, forecasting a CAGR of 6.3% through 2034. This impressive growth signifies a flourishing industrial landscape driven by heightened consumer demand for aftermarket upgrades and components.
The favorable environment sets the stage for manufacturers and retailers to thrive, presenting ample opportunities for innovation and expansion of the dynamic bicycle component sector in Italy.
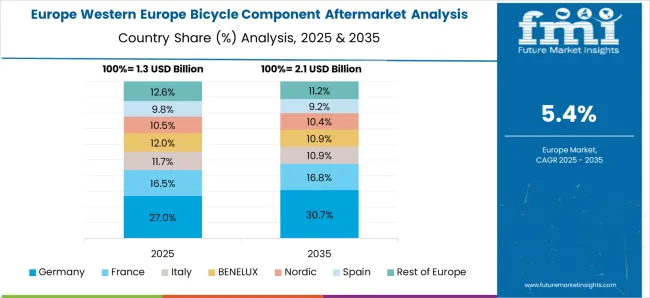
Germany bicycle component aftermarket demonstrates a promising outlook, boasting a noteworthy CAGR of 5.8% through 2034. While slightly below Italy growth rate, Germany market maintains resilience and steady progression.
Fueled by a robust cycling culture and a preference for high-quality, innovative components, Germany emerges as a pivotal player in the European aftermarket landscape. The projected growth underscores sustained consumer interest, offering a conducive market for businesses to explore and capitalize on emerging opportunities within the flourishing German bicycle component sector.Top of Form
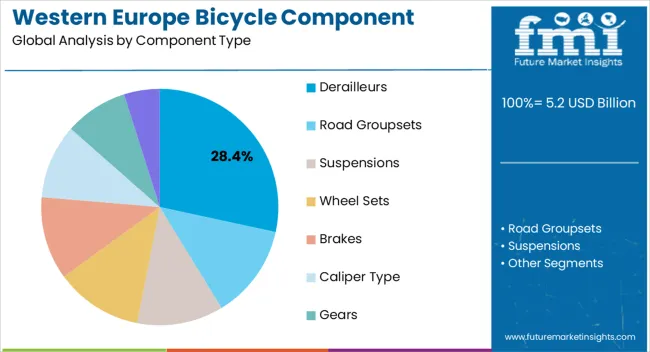
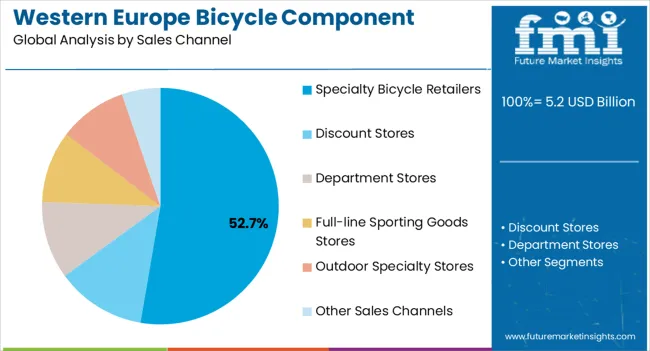
In 2024, the bicycle component aftermarket is especially lucrative for road groupsets, constituting a substantial industrial share of 58.6%. By sales channel, departmental stores play a significant role, capturing a notable share of 37.5%, indicating diverse consumer channels within the bicycle component sector.
This distribution underscores the industrial focus on specialized components for road cycling and the accessibility of components through departmental retail outlets, contributing to a dynamic and varied aftermarket landscape.
Category | Industrial Share in 2024 |
---|---|
Road Groupsets | 58.6% |
Departmental Store | 37.5% |
In the landscape of the bicycle component aftermarket in 2024, road groupsets emerged as the dominant category, commanding a substantial industrial share of 58.6%.
This high percentage underscores a pronounced preference among consumers for specialized components tailored to road cycling, reflecting a strong market demand for performance-driven and technologically advanced groupsets.
The departmental store category claims a noteworthy share of 37.5%, highlighting the significance of diverse retail channels within the bicycle component sector. The accessibility of components through departmental stores signifies a broad consumer reach, indicating a robust retail presence for bicycle components beyond specialized outlets.
This diversified approach to distribution contributes to the overall resilience and accessibility of the bicycle component aftermarket, catering to a wide range of consumer preferences and purchasing behaviors.
Attribute | Details |
---|---|
Estimated Size in 2024 | USD 4,902.8 million |
Projected Size in 2034 | USD 8,947.25 million |
Anticipated CAGR between 2024 to 2034 | 6.2% CAGR |
Demand Forecast for the Bicycle Component Aftermarket in Western Europe | 2024 to 2034 |
Report Coverage | Industry Size, Industry Trends, Analysis of key factors influencing the Bicycle Component Aftermarket in Western Europe, Insights on Global Players and their Strategy in Western Europe, Ecosystem Analysis of Local and Regional Western Europe Providers |
Key Provinces Analyzed |
The United Kingdom, Germany, France, The Netherlands, Spain, Italy, Rest of Western Europe |
Key Companies Profiled |
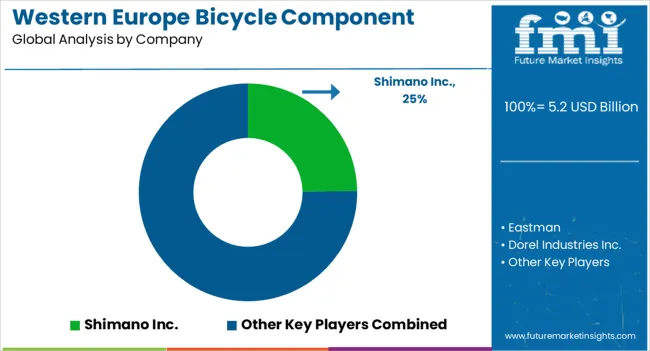
Eastman; Dorel Industries Inc.; Accell Group N.V.; Shimano Inc.; SRAM LLC; Hero Cycles Limited; Campagnolo S.R.L.; Merida Industry Co. Ltd.; Specialized Bicycle Components; Rohloff AG |
Table 1: Industry Analysis and Outlook Value (US$ Million) Forecast by Country, 2019 to 2034
Table 2: Industry Analysis and Outlook Volume (Units) Forecast by Country, 2019 to 2034
Table 3: Industry Analysis and Outlook Value (US$ Million) Forecast by Component Type, 2019 to 2034
Table 4: Industry Analysis and Outlook Volume (Units) Forecast by Component Type, 2019 to 2034
Table 5: Industry Analysis and Outlook Value (US$ Million) Forecast by Sales Channel, 2019 to 2034
Table 6: Industry Analysis and Outlook Volume (Units) Forecast by Sales Channel, 2019 to 2034
Table 7: Industry Analysis and Outlook Value (US$ Million) Forecast by Bicycle Type, 2019 to 2034
Table 8: Industry Analysis and Outlook Volume (Units) Forecast by Bicycle Type, 2019 to 2034
Table 9: UK Industry Analysis and Outlook Value (US$ Million) Forecast By Region, 2019 to 2034
Table 10: UK Industry Analysis and Outlook Volume (Units) Forecast By Region, 2019 to 2034
Table 11: UK Industry Analysis and Outlook Value (US$ Million) Forecast by Component Type, 2019 to 2034
Table 12: UK Industry Analysis and Outlook Volume (Units) Forecast by Component Type, 2019 to 2034
Table 13: UK Industry Analysis and Outlook Value (US$ Million) Forecast by Sales Channel, 2019 to 2034
Table 14: UK Industry Analysis and Outlook Volume (Units) Forecast by Sales Channel, 2019 to 2034
Table 15: UK Industry Analysis and Outlook Value (US$ Million) Forecast by Bicycle Type, 2019 to 2034
Table 16: UK Industry Analysis and Outlook Volume (Units) Forecast by Bicycle Type, 2019 to 2034
Table 17: Germany Industry Analysis and Outlook Value (US$ Million) Forecast By Region, 2019 to 2034
Table 18: Germany Industry Analysis and Outlook Volume (Units) Forecast By Region, 2019 to 2034
Table 19: Germany Industry Analysis and Outlook Value (US$ Million) Forecast by Component Type, 2019 to 2034
Table 20: Germany Industry Analysis and Outlook Volume (Units) Forecast by Component Type, 2019 to 2034
Table 21: Germany Industry Analysis and Outlook Value (US$ Million) Forecast by Sales Channel, 2019 to 2034
Table 22: Germany Industry Analysis and Outlook Volume (Units) Forecast by Sales Channel, 2019 to 2034
Table 23: Germany Industry Analysis and Outlook Value (US$ Million) Forecast by Bicycle Type, 2019 to 2034
Table 24: Germany Industry Analysis and Outlook Volume (Units) Forecast by Bicycle Type, 2019 to 2034
Table 25: Italy Industry Analysis and Outlook Value (US$ Million) Forecast By Region, 2019 to 2034
Table 26: Italy Industry Analysis and Outlook Volume (Units) Forecast By Region, 2019 to 2034
Table 27: Italy Industry Analysis and Outlook Value (US$ Million) Forecast by Component Type, 2019 to 2034
Table 28: Italy Industry Analysis and Outlook Volume (Units) Forecast by Component Type, 2019 to 2034
Table 29: Italy Industry Analysis and Outlook Value (US$ Million) Forecast by Sales Channel, 2019 to 2034
Table 30: Italy Industry Analysis and Outlook Volume (Units) Forecast by Sales Channel, 2019 to 2034
Table 31: Italy Industry Analysis and Outlook Value (US$ Million) Forecast by Bicycle Type, 2019 to 2034
Table 32: Italy Industry Analysis and Outlook Volume (Units) Forecast by Bicycle Type, 2019 to 2034
Table 33: France Industry Analysis and Outlook Value (US$ Million) Forecast By Region, 2019 to 2034
Table 34: France Industry Analysis and Outlook Volume (Units) Forecast By Region, 2019 to 2034
Table 35: France Industry Analysis and Outlook Value (US$ Million) Forecast by Component Type, 2019 to 2034
Table 36: France Industry Analysis and Outlook Volume (Units) Forecast by Component Type, 2019 to 2034
Table 37: France Industry Analysis and Outlook Value (US$ Million) Forecast by Sales Channel, 2019 to 2034
Table 38: France Industry Analysis and Outlook Volume (Units) Forecast by Sales Channel, 2019 to 2034
Table 39: France Industry Analysis and Outlook Value (US$ Million) Forecast by Bicycle Type, 2019 to 2034
Table 40: France Industry Analysis and Outlook Volume (Units) Forecast by Bicycle Type, 2019 to 2034
Table 41: Spain Industry Analysis and Outlook Value (US$ Million) Forecast By Region, 2019 to 2034
Table 42: Spain Industry Analysis and Outlook Volume (Units) Forecast By Region, 2019 to 2034
Table 43: Spain Industry Analysis and Outlook Value (US$ Million) Forecast by Component Type, 2019 to 2034
Table 44: Spain Industry Analysis and Outlook Volume (Units) Forecast by Component Type, 2019 to 2034
Table 45: Spain Industry Analysis and Outlook Value (US$ Million) Forecast by Sales Channel, 2019 to 2034
Table 46: Spain Industry Analysis and Outlook Volume (Units) Forecast by Sales Channel, 2019 to 2034
Table 47: Spain Industry Analysis and Outlook Value (US$ Million) Forecast by Bicycle Type, 2019 to 2034
Table 48: Spain Industry Analysis and Outlook Volume (Units) Forecast by Bicycle Type, 2019 to 2034
Table 49: Rest of Industry Analysis and Outlook Value (US$ Million) Forecast by Component Type, 2019 to 2034
Table 50: Rest of Industry Analysis and Outlook Volume (Units) Forecast by Component Type, 2019 to 2034
Table 51: Rest of Industry Analysis and Outlook Value (US$ Million) Forecast by Sales Channel, 2019 to 2034
Table 52: Rest of Industry Analysis and Outlook Volume (Units) Forecast by Sales Channel, 2019 to 2034
Table 53: Rest of Industry Analysis and Outlook Value (US$ Million) Forecast by Bicycle Type, 2019 to 2034
Table 54: Rest of Industry Analysis and Outlook Volume (Units) Forecast by Bicycle Type, 2019 to 2034
Figure 1: Industry Analysis and Outlook Value (US$ Million) by Component Type, 2024 to 2034
Figure 2: Industry Analysis and Outlook Value (US$ Million) by Sales Channel, 2024 to 2034
Figure 3: Industry Analysis and Outlook Value (US$ Million) by Bicycle Type, 2024 to 2034
Figure 4: Industry Analysis and Outlook Value (US$ Million) by Country, 2024 to 2034
Figure 5: Industry Analysis and Outlook Value (US$ Million) Analysis by Country, 2019 to 2034
Figure 6: Industry Analysis and Outlook Volume (Units) Analysis by Country, 2019 to 2034
Figure 7: Industry Analysis and Outlook Value Share (%) and BPS Analysis by Country, 2024 to 2034
Figure 8: Industry Analysis and Outlook Y-o-Y Growth (%) Projections by Country, 2024 to 2034
Figure 9: Industry Analysis and Outlook Value (US$ Million) Analysis by Component Type, 2019 to 2034
Figure 10: Industry Analysis and Outlook Volume (Units) Analysis by Component Type, 2019 to 2034
Figure 11: Industry Analysis and Outlook Value Share (%) and BPS Analysis by Component Type, 2024 to 2034
Figure 12: Industry Analysis and Outlook Y-o-Y Growth (%) Projections by Component Type, 2024 to 2034
Figure 13: Industry Analysis and Outlook Value (US$ Million) Analysis by Sales Channel, 2019 to 2034
Figure 14: Industry Analysis and Outlook Volume (Units) Analysis by Sales Channel, 2019 to 2034
Figure 15: Industry Analysis and Outlook Value Share (%) and BPS Analysis by Sales Channel, 2024 to 2034
Figure 16: Industry Analysis and Outlook Y-o-Y Growth (%) Projections by Sales Channel, 2024 to 2034
Figure 17: Industry Analysis and Outlook Value (US$ Million) Analysis by Bicycle Type, 2019 to 2034
Figure 18: Industry Analysis and Outlook Volume (Units) Analysis by Bicycle Type, 2019 to 2034
Figure 19: Industry Analysis and Outlook Value Share (%) and BPS Analysis by Bicycle Type, 2024 to 2034
Figure 20: Industry Analysis and Outlook Y-o-Y Growth (%) Projections by Bicycle Type, 2024 to 2034
Figure 21: Industry Analysis and Outlook Attractiveness by Component Type, 2024 to 2034
Figure 22: Industry Analysis and Outlook Attractiveness by Sales Channel, 2024 to 2034
Figure 23: Industry Analysis and Outlook Attractiveness by Bicycle Type, 2024 to 2034
Figure 24: Industry Analysis and Outlook Attractiveness by Region, 2024 to 2034
Figure 25: UK Industry Analysis and Outlook Value (US$ Million) by Component Type, 2024 to 2034
Figure 26: UK Industry Analysis and Outlook Value (US$ Million) by Sales Channel, 2024 to 2034
Figure 27: UK Industry Analysis and Outlook Value (US$ Million) by Bicycle Type, 2024 to 2034
Figure 28: UK Industry Analysis and Outlook Value (US$ Million) By Region, 2024 to 2034
Figure 29: UK Industry Analysis and Outlook Value (US$ Million) Analysis By Region, 2019 to 2034
Figure 30: UK Industry Analysis and Outlook Volume (Units) Analysis By Region, 2019 to 2034
Figure 31: UK Industry Analysis and Outlook Value Share (%) and BPS Analysis By Region, 2024 to 2034
Figure 32: UK Industry Analysis and Outlook Y-o-Y Growth (%) Projections By Region, 2024 to 2034
Figure 33: UK Industry Analysis and Outlook Value (US$ Million) Analysis by Component Type, 2019 to 2034
Figure 34: UK Industry Analysis and Outlook Volume (Units) Analysis by Component Type, 2019 to 2034
Figure 35: UK Industry Analysis and Outlook Value Share (%) and BPS Analysis by Component Type, 2024 to 2034
Figure 36: UK Industry Analysis and Outlook Y-o-Y Growth (%) Projections by Component Type, 2024 to 2034
Figure 37: UK Industry Analysis and Outlook Value (US$ Million) Analysis by Sales Channel, 2019 to 2034
Figure 38: UK Industry Analysis and Outlook Volume (Units) Analysis by Sales Channel, 2019 to 2034
Figure 39: UK Industry Analysis and Outlook Value Share (%) and BPS Analysis by Sales Channel, 2024 to 2034
Figure 40: UK Industry Analysis and Outlook Y-o-Y Growth (%) Projections by Sales Channel, 2024 to 2034
Figure 41: UK Industry Analysis and Outlook Value (US$ Million) Analysis by Bicycle Type, 2019 to 2034
Figure 42: UK Industry Analysis and Outlook Volume (Units) Analysis by Bicycle Type, 2019 to 2034
Figure 43: UK Industry Analysis and Outlook Value Share (%) and BPS Analysis by Bicycle Type, 2024 to 2034
Figure 44: UK Industry Analysis and Outlook Y-o-Y Growth (%) Projections by Bicycle Type, 2024 to 2034
Figure 45: UK Industry Analysis and Outlook Attractiveness by Component Type, 2024 to 2034
Figure 46: UK Industry Analysis and Outlook Attractiveness by Sales Channel, 2024 to 2034
Figure 47: UK Industry Analysis and Outlook Attractiveness by Bicycle Type, 2024 to 2034
Figure 48: UK Industry Analysis and Outlook Attractiveness By Region, 2024 to 2034
Figure 49: Germany Industry Analysis and Outlook Value (US$ Million) by Component Type, 2024 to 2034
Figure 50: Germany Industry Analysis and Outlook Value (US$ Million) by Sales Channel, 2024 to 2034
Figure 51: Germany Industry Analysis and Outlook Value (US$ Million) by Bicycle Type, 2024 to 2034
Figure 52: Germany Industry Analysis and Outlook Value (US$ Million) By Region, 2024 to 2034
Figure 53: Germany Industry Analysis and Outlook Value (US$ Million) Analysis By Region, 2019 to 2034
Figure 54: Germany Industry Analysis and Outlook Volume (Units) Analysis By Region, 2019 to 2034
Figure 55: Germany Industry Analysis and Outlook Value Share (%) and BPS Analysis By Region, 2024 to 2034
Figure 56: Germany Industry Analysis and Outlook Y-o-Y Growth (%) Projections By Region, 2024 to 2034
Figure 57: Germany Industry Analysis and Outlook Value (US$ Million) Analysis by Component Type, 2019 to 2034
Figure 58: Germany Industry Analysis and Outlook Volume (Units) Analysis by Component Type, 2019 to 2034
Figure 59: Germany Industry Analysis and Outlook Value Share (%) and BPS Analysis by Component Type, 2024 to 2034
Figure 60: Germany Industry Analysis and Outlook Y-o-Y Growth (%) Projections by Component Type, 2024 to 2034
Figure 61: Germany Industry Analysis and Outlook Value (US$ Million) Analysis by Sales Channel, 2019 to 2034
Figure 62: Germany Industry Analysis and Outlook Volume (Units) Analysis by Sales Channel, 2019 to 2034
Figure 63: Germany Industry Analysis and Outlook Value Share (%) and BPS Analysis by Sales Channel, 2024 to 2034
Figure 64: Germany Industry Analysis and Outlook Y-o-Y Growth (%) Projections by Sales Channel, 2024 to 2034
Figure 65: Germany Industry Analysis and Outlook Value (US$ Million) Analysis by Bicycle Type, 2019 to 2034
Figure 66: Germany Industry Analysis and Outlook Volume (Units) Analysis by Bicycle Type, 2019 to 2034
Figure 67: Germany Industry Analysis and Outlook Value Share (%) and BPS Analysis by Bicycle Type, 2024 to 2034
Figure 68: Germany Industry Analysis and Outlook Y-o-Y Growth (%) Projections by Bicycle Type, 2024 to 2034
Figure 69: Germany Industry Analysis and Outlook Attractiveness by Component Type, 2024 to 2034
Figure 70: Germany Industry Analysis and Outlook Attractiveness by Sales Channel, 2024 to 2034
Figure 71: Germany Industry Analysis and Outlook Attractiveness by Bicycle Type, 2024 to 2034
Figure 72: Germany Industry Analysis and Outlook Attractiveness By Region, 2024 to 2034
Figure 73: Italy Industry Analysis and Outlook Value (US$ Million) by Component Type, 2024 to 2034
Figure 74: Italy Industry Analysis and Outlook Value (US$ Million) by Sales Channel, 2024 to 2034
Figure 75: Italy Industry Analysis and Outlook Value (US$ Million) by Bicycle Type, 2024 to 2034
Figure 76: Italy Industry Analysis and Outlook Value (US$ Million) By Region, 2024 to 2034
Figure 77: Italy Industry Analysis and Outlook Value (US$ Million) Analysis By Region, 2019 to 2034
Figure 78: Italy Industry Analysis and Outlook Volume (Units) Analysis By Region, 2019 to 2034
Figure 79: Italy Industry Analysis and Outlook Value Share (%) and BPS Analysis By Region, 2024 to 2034
Figure 80: Italy Industry Analysis and Outlook Y-o-Y Growth (%) Projections By Region, 2024 to 2034
Figure 81: Italy Industry Analysis and Outlook Value (US$ Million) Analysis by Component Type, 2019 to 2034
Figure 82: Italy Industry Analysis and Outlook Volume (Units) Analysis by Component Type, 2019 to 2034
Figure 83: Italy Industry Analysis and Outlook Value Share (%) and BPS Analysis by Component Type, 2024 to 2034
Figure 84: Italy Industry Analysis and Outlook Y-o-Y Growth (%) Projections by Component Type, 2024 to 2034
Figure 85: Italy Industry Analysis and Outlook Value (US$ Million) Analysis by Sales Channel, 2019 to 2034
Figure 86: Italy Industry Analysis and Outlook Volume (Units) Analysis by Sales Channel, 2019 to 2034
Figure 87: Italy Industry Analysis and Outlook Value Share (%) and BPS Analysis by Sales Channel, 2024 to 2034
Figure 88: Italy Industry Analysis and Outlook Y-o-Y Growth (%) Projections by Sales Channel, 2024 to 2034
Figure 89: Italy Industry Analysis and Outlook Value (US$ Million) Analysis by Bicycle Type, 2019 to 2034
Figure 90: Italy Industry Analysis and Outlook Volume (Units) Analysis by Bicycle Type, 2019 to 2034
Figure 91: Italy Industry Analysis and Outlook Value Share (%) and BPS Analysis by Bicycle Type, 2024 to 2034
Figure 92: Italy Industry Analysis and Outlook Y-o-Y Growth (%) Projections by Bicycle Type, 2024 to 2034
Figure 93: Italy Industry Analysis and Outlook Attractiveness by Component Type, 2024 to 2034
Figure 94: Italy Industry Analysis and Outlook Attractiveness by Sales Channel, 2024 to 2034
Figure 95: Italy Industry Analysis and Outlook Attractiveness by Bicycle Type, 2024 to 2034
Figure 96: Italy Industry Analysis and Outlook Attractiveness By Region, 2024 to 2034
Figure 97: France Industry Analysis and Outlook Value (US$ Million) by Component Type, 2024 to 2034
Figure 98: France Industry Analysis and Outlook Value (US$ Million) by Sales Channel, 2024 to 2034
Figure 99: France Industry Analysis and Outlook Value (US$ Million) by Bicycle Type, 2024 to 2034
Figure 100: France Industry Analysis and Outlook Value (US$ Million) By Region, 2024 to 2034
Figure 101: France Industry Analysis and Outlook Value (US$ Million) Analysis By Region, 2019 to 2034
Figure 102: France Industry Analysis and Outlook Volume (Units) Analysis By Region, 2019 to 2034
Figure 103: France Industry Analysis and Outlook Value Share (%) and BPS Analysis By Region, 2024 to 2034
Figure 104: France Industry Analysis and Outlook Y-o-Y Growth (%) Projections By Region, 2024 to 2034
Figure 105: France Industry Analysis and Outlook Value (US$ Million) Analysis by Component Type, 2019 to 2034
Figure 106: France Industry Analysis and Outlook Volume (Units) Analysis by Component Type, 2019 to 2034
Figure 107: France Industry Analysis and Outlook Value Share (%) and BPS Analysis by Component Type, 2024 to 2034
Figure 108: France Industry Analysis and Outlook Y-o-Y Growth (%) Projections by Component Type, 2024 to 2034
Figure 109: France Industry Analysis and Outlook Value (US$ Million) Analysis by Sales Channel, 2019 to 2034
Figure 110: France Industry Analysis and Outlook Volume (Units) Analysis by Sales Channel, 2019 to 2034
Figure 111: France Industry Analysis and Outlook Value Share (%) and BPS Analysis by Sales Channel, 2024 to 2034
Figure 112: France Industry Analysis and Outlook Y-o-Y Growth (%) Projections by Sales Channel, 2024 to 2034
Figure 113: France Industry Analysis and Outlook Value (US$ Million) Analysis by Bicycle Type, 2019 to 2034
Figure 114: France Industry Analysis and Outlook Volume (Units) Analysis by Bicycle Type, 2019 to 2034
Figure 115: France Industry Analysis and Outlook Value Share (%) and BPS Analysis by Bicycle Type, 2024 to 2034
Figure 116: France Industry Analysis and Outlook Y-o-Y Growth (%) Projections by Bicycle Type, 2024 to 2034
Figure 117: France Industry Analysis and Outlook Attractiveness by Component Type, 2024 to 2034
Figure 118: France Industry Analysis and Outlook Attractiveness by Sales Channel, 2024 to 2034
Figure 119: France Industry Analysis and Outlook Attractiveness by Bicycle Type, 2024 to 2034
Figure 120: France Industry Analysis and Outlook Attractiveness By Region, 2024 to 2034
Figure 121: Spain Industry Analysis and Outlook Value (US$ Million) by Component Type, 2024 to 2034
Figure 122: Spain Industry Analysis and Outlook Value (US$ Million) by Sales Channel, 2024 to 2034
Figure 123: Spain Industry Analysis and Outlook Value (US$ Million) by Bicycle Type, 2024 to 2034
Figure 124: Spain Industry Analysis and Outlook Value (US$ Million) By Region, 2024 to 2034
Figure 125: Spain Industry Analysis and Outlook Value (US$ Million) Analysis By Region, 2019 to 2034
Figure 126: Spain Industry Analysis and Outlook Volume (Units) Analysis By Region, 2019 to 2034
Figure 127: Spain Industry Analysis and Outlook Value Share (%) and BPS Analysis By Region, 2024 to 2034
Figure 128: Spain Industry Analysis and Outlook Y-o-Y Growth (%) Projections By Region, 2024 to 2034
Figure 129: Spain Industry Analysis and Outlook Value (US$ Million) Analysis by Component Type, 2019 to 2034
Figure 130: Spain Industry Analysis and Outlook Volume (Units) Analysis by Component Type, 2019 to 2034
Figure 131: Spain Industry Analysis and Outlook Value Share (%) and BPS Analysis by Component Type, 2024 to 2034
Figure 132: Spain Industry Analysis and Outlook Y-o-Y Growth (%) Projections by Component Type, 2024 to 2034
Figure 133: Spain Industry Analysis and Outlook Value (US$ Million) Analysis by Sales Channel, 2019 to 2034
Figure 134: Spain Industry Analysis and Outlook Volume (Units) Analysis by Sales Channel, 2019 to 2034
Figure 135: Spain Industry Analysis and Outlook Value Share (%) and BPS Analysis by Sales Channel, 2024 to 2034
Figure 136: Spain Industry Analysis and Outlook Y-o-Y Growth (%) Projections by Sales Channel, 2024 to 2034
Figure 137: Spain Industry Analysis and Outlook Value (US$ Million) Analysis by Bicycle Type, 2019 to 2034
Figure 138: Spain Industry Analysis and Outlook Volume (Units) Analysis by Bicycle Type, 2019 to 2034
Figure 139: Spain Industry Analysis and Outlook Value Share (%) and BPS Analysis by Bicycle Type, 2024 to 2034
Figure 140: Spain Industry Analysis and Outlook Y-o-Y Growth (%) Projections by Bicycle Type, 2024 to 2034
Figure 141: Spain Industry Analysis and Outlook Attractiveness by Component Type, 2024 to 2034
Figure 142: Spain Industry Analysis and Outlook Attractiveness by Sales Channel, 2024 to 2034
Figure 143: Spain Industry Analysis and Outlook Attractiveness by Bicycle Type, 2024 to 2034
Figure 144: Spain Industry Analysis and Outlook Attractiveness By Region, 2024 to 2034
Figure 145: Rest of Industry Analysis and Outlook Value (US$ Million) by Component Type, 2024 to 2034
Figure 146: Rest of Industry Analysis and Outlook Value (US$ Million) by Sales Channel, 2024 to 2034
Figure 147: Rest of Industry Analysis and Outlook Value (US$ Million) by Bicycle Type, 2024 to 2034
Figure 148: Rest of Industry Analysis and Outlook Value (US$ Million) Analysis by Component Type, 2019 to 2034
Figure 149: Rest of Industry Analysis and Outlook Volume (Units) Analysis by Component Type, 2019 to 2034
Figure 150: Rest of Industry Analysis and Outlook Value Share (%) and BPS Analysis by Component Type, 2024 to 2034
Figure 151: Rest of Industry Analysis and Outlook Y-o-Y Growth (%) Projections by Component Type, 2024 to 2034
Figure 152: Rest of Industry Analysis and Outlook Value (US$ Million) Analysis by Sales Channel, 2019 to 2034
Figure 153: Rest of Industry Analysis and Outlook Volume (Units) Analysis by Sales Channel, 2019 to 2034
Figure 154: Rest of Industry Analysis and Outlook Value Share (%) and BPS Analysis by Sales Channel, 2024 to 2034
Figure 155: Rest of Industry Analysis and Outlook Y-o-Y Growth (%) Projections by Sales Channel, 2024 to 2034
Figure 156: Rest of Industry Analysis and Outlook Value (US$ Million) Analysis by Bicycle Type, 2019 to 2034
Figure 157: Rest of Industry Analysis and Outlook Volume (Units) Analysis by Bicycle Type, 2019 to 2034
Figure 158: Rest of Industry Analysis and Outlook Value Share (%) and BPS Analysis by Bicycle Type, 2024 to 2034
Figure 159: Rest of Industry Analysis and Outlook Y-o-Y Growth (%) Projections by Bicycle Type, 2024 to 2034
Figure 160: Rest of Industry Analysis and Outlook Attractiveness by Component Type, 2024 to 2034
Figure 161: Rest of Industry Analysis and Outlook Attractiveness by Sales Channel, 2024 to 2034
Figure 162: Rest of Industry Analysis and Outlook Attractiveness by Bicycle Type, 2024 to 2034
By 2024, the estimated valuation of the bicycle component aftermarket is USD 4,902.8 million.
The anticipated CAGR for bicycle component aftermarket through 2034 is 6.2%.
By 2034, the demand for the bicycle component aftermarket will reach USD 8,947.25 million in value terms.
The Western Europe bicycle component aftermarket expanded at a CAGR of 6% from 2019 to 2023.
Explore Similar Insights
Thank you!
You will receive an email from our Business Development Manager. Please be sure to check your SPAM/JUNK folder too.