The Bicycle Components Aftermarket is expected to expand steadily over the next decade, rising from USD 8.9 billion in 2025 to USD 15.2 billion in 2035, with a CAGR of 5.5%. The growth pattern shows gradual increases with key breakpoints linked to innovations, rising adoption of electric and high-performance bicycles, and improvements in cycling infrastructure. Producers are likely to focus on lightweight materials, enhanced drivetrains, and ergonomic designs, creating periods of increased demand and market activity.
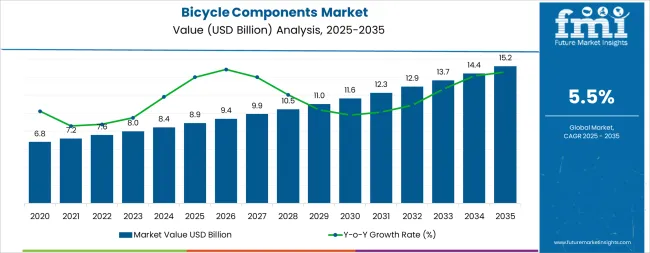
From 2025 to 2030, the market may reach an initial breakpoint as new products and upgraded components attract early adopters and cycling enthusiasts. Growth during this phase is expected to remain steady, reflecting gradual adoption across both mature and emerging regions. Between 2030 and 2035, a second breakpoint could emerge, supported by the rise of e-bikes and specialized components for recreational and performance cycling. These points mark periods of noticeable acceleration in market activity, followed by stabilization as adoption spreads more widely.
The Bicycle Components Aftermarket is mainly divided between Original Equipment Manufacturers (OEMs) and the aftermarket sector. OEMs hold around 70% of the market, driven by strong partnerships with bicycle producers, ensuring consistent demand for components in new bicycles. The aftermarket segment represents roughly 30%, serving consumers who require replacement parts, performance upgrades, or customization for existing bicycles. Growth in this segment is supported by increasing interest in cycling for recreation, fitness, and commuting, along with rising demand for personalized bicycle setups that cater to different riding styles and preferences.
Recent trends show a clear focus on lightweight and durable materials for improved riding efficiency. Carbon fiber, aluminum alloys, and high-strength polymers are increasingly adopted in component manufacturing. Advanced production methods, including precision machining and additive manufacturing, allow complex designs with enhanced accuracy and performance. The growing popularity of electric bicycles is driving the need for specialized parts suited to higher torque and battery integration. Components that improve ergonomics, aerodynamics, and connectivity are also gaining attention, reflecting evolving consumer expectations and technological progress in the cycling industry.
| Metric | Value |
|---|---|
| Estimated Value in (2025E) | USD 8.9 billion |
| Forecast Value in (2035F) | USD 15.2 billion |
| Forecast CAGR (2025 to 2035) | 5.5% |
Market expansion is being supported by the increasing demand for eco-friendly transportation solutions and the corresponding need for high-performance component systems in cycling applications across global bicycle manufacturing and aftermarket operations. Modern bicycle manufacturers are increasingly focused on specialized component technologies that can improve riding efficiency, reduce maintenance requirements, and enhance user experience while meeting stringent quality and safety requirements. The proven efficacy of advanced bicycle components in various cycling applications makes them an essential component of comprehensive bicycle manufacturing strategies and aftermarket service provision.
The growing emphasis on urban mobility transformation and advanced cycling performance optimization is driving demand for ultra-efficient bicycle components that meet stringent performance specifications and regulatory requirements for transportation and recreational applications. Bicycle manufacturers' preference for reliable, high-performance component systems that can ensure consistent riding outcomes is creating opportunities for innovative technologies and customized cycling solutions. The rising influence of regulations and safety protocols is also contributing to increased adoption of premium-grade bicycle components across different cycling applications and bicycle systems requiring specialized component technology.
The Bicycle Components Aftermarket represents a specialized growth opportunity, expanding from USD 8.9 billion in 2025 to USD 15.2 billion by 2035 at a 5.5% CAGR. As bicycle manufacturers prioritize performance optimization, ENVIRONMENT compliance, and rider experience in complex bicycle design processes, bicycle components have evolved from basic mechanical parts to essential systems enabling precision control, power efficiency, and multi-functional cycling performance across road, mountain, hybrid, and electric bicycle applications.
The convergence of e-bike market expansion, increasing urban cycling adoption, specialized component technology development, and fitness industry growth creates steady momentum in demand. High-performance drivetrains offering superior power transfer efficiency, advanced hydraulic disc brake systems balancing stopping power with modulation, and lightweight carbon fiber wheelsets for competitive applications will capture market premiums, while geographic expansion into high-growth Asian cycling markets and European sustainability-driven segments will drive volume leadership. Regulatory emphasis on bicycle safety and component reliability provides structural support.
The market is segmented by product type, bicycle type, distribution channel, and region. By product type, the market is divided into Drivetrain Components, Brakes, Wheels, Handlebars, Pedals, Saddles, and Others. Based on bicycle type, the market is categorized into Road Bikes, Mountain Bikes, Hybrid Bikes, Electric Bikes, and Others. By distribution channel, the market includes Original Equipment Manufacturers (OEM), Aftermarket, and Online Retail. Regionally, the market is divided into North America, Europe, Asia Pacific, Latin America, and the Middle East & Africa.
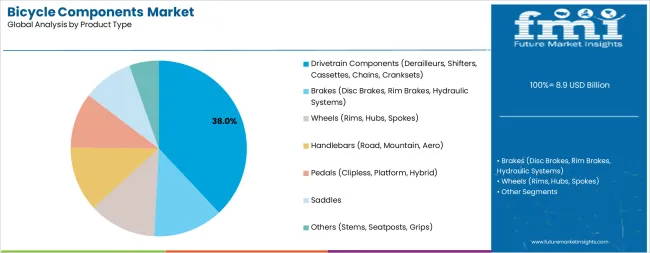
The drivetrain components segment is projected to account for 38% of the Bicycle Components Aftermarket in 2025, reaffirming its position as the category's dominant product type. Bicycle manufacturers increasingly recognize the critical importance of high-performance drivetrains for most cycling applications, particularly in competitive road cycling and mountain biking performance processes. This product category addresses both power transmission efficiency requirements and rider experience considerations while providing reliable performance across diverse cycling applications.
This product type forms the foundation of most bicycle designs for performance cycling applications, as it represents the most technically complex and functionally critical component system in the industry. Shifting precision standards and extensive durability testing continue to strengthen confidence in advanced drivetrain configurations among bicycle manufacturers and cycling enthusiasts. With increasing recognition of the power efficiency optimization requirements in competitive cycling, Drivetrain Components align with both performance enhancement and mechanical reliability goals, making them the central growth driver of comprehensive bicycle design strategies.
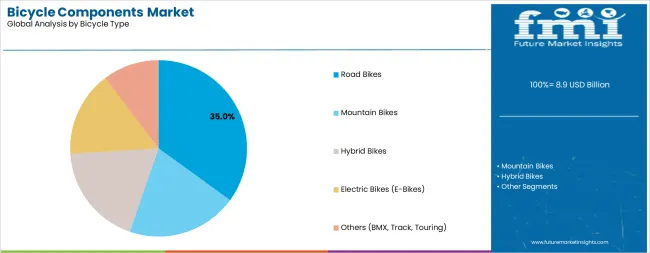
Road bikes are projected to represent 35% of bicycle components demand in 2025, underscoring their role as the primary bicycle type driving premium component adoption and market growth. Bicycle manufacturers recognize that road cycling performance requirements, including aerodynamic optimization, lightweight construction, and precision control systems, often require specialized components that standard bicycle technologies cannot adequately provide. Advanced bicycle components offer enhanced performance efficiency and competitive advantages in road cycling applications.
The segment is supported by the growing popularity of competitive cycling sports, requiring sophisticated component systems, and the increasing recognition that specialized technologies can improve athletic performance and cycling experience outcomes. The road cycling communities are increasingly adopting evidence-based equipment selection guidelines that recommend specific component upgrades for optimal riding outcomes. As understanding of cycling biomechanics advances and competitive standards become more demanding, advanced bicycle components will continue to play a crucial role in comprehensive training strategies within the road cycling market.
The Bicycle Components Aftermarket is advancing steadily due to increasing recognition of cycling as a green transportation mode and growing demand for high-performance component systems across the bicycle manufacturing and cycling enthusiast sectors. However, the market faces challenges, including complex supply chain dependencies on specialized materials, potential for counterfeit component proliferation in aftermarket channels, and concerns about technology standardization across different bicycle platforms. Innovation in electronic shifting technologies and connected cycling platforms continues to influence product development and market expansion patterns.
The growing adoption of electric bicycles is enabling the development of more sophisticated bicycle component designs and power management systems that can meet the demanding requirements of motor-assisted cycling. Specialized e-bike components offer comprehensive performance capabilities, including high-torque drivetrain processes that are particularly important for achieving efficient power delivery in electric cycling applications. Advanced component categories provide access to premium systems that can optimize battery range performance and reduce maintenance costs while maintaining cost-effectiveness for large-scale e-bike manufacturing operations.
Modern component manufacturers are incorporating digital technologies such as wireless shifting systems, power measurement sensors, and mobile application integration to enhance bicycle component functionality and rider experience processes. These technologies improve performance monitoring, enable continuous training optimization, and provide better connectivity between cyclists and digital fitness ecosystems throughout the riding experience. Advanced electronic platforms also enable customized performance configurations and real-time performance feedback capabilities, supporting data-driven cycling training and equipment optimization.
Regulatory pressures across European and North American markets are driving component manufacturers toward natural material sourcing, recyclable product designs, and circular economy business models. The bicycle industry is increasingly emphasizing carbon footprint reduction through localized manufacturing, sustainable packaging solutions, and component longevity optimization. Premium brands are developing take-back programs, refurbishment services, and certified pre-owned component markets to extend product lifecycles and reduce environmental impact. These initiatives are becoming competitive differentiators, particularly among environmentally conscious cycling demographics and urban mobility markets prioritizing low-carbon transportation solutions.
| Country/Region | CAGR (2025-2035) |
|---|---|
| United States | 5.1% |
| United Kingdom | 4.6% |
| Japan | 4.2% |
| South Korea | 4.0% |
| China | 4.1% |
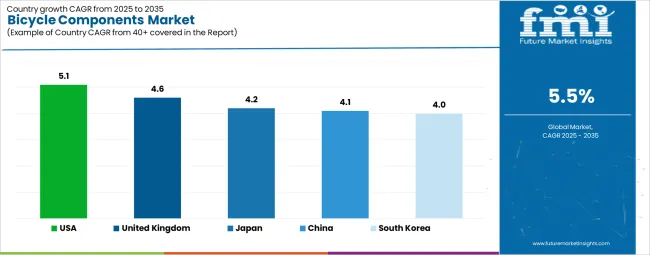
The Bicycle Components Aftermarket is experiencing varied growth globally, with the United States leading at a 5.1% CAGR through 2035, driven by the expansion of cycling culture, increasing fitness consciousness, and growing e-bike adoption for urban commuting. The United Kingdom shows growth at 4.6%, emphasizing urban cycling promotion and active transportation policies. Japan records 4.2% growth, with a focus on precision manufacturing and domestic cycling traditions. South Korea demonstrates 4.0% growth, representing an emerging market with growing cycling participation. China exhibits 4.1% growth trajectories, driven by urbanization, expanding middle classes, and increasing health awareness across rapidly developing cycling markets.
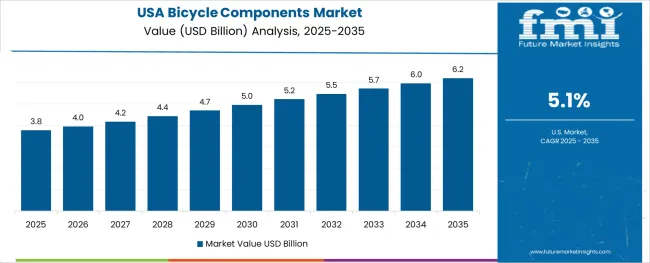
The demand for bicycle components in the United States is projected to exhibit robust growth with a CAGR of 5.1% through 2035, driven by ongoing fitness culture expansion and increasing recognition of bicycles as viable urban transportation alternatives for commuting and recreational activities. The country's expanding cycling infrastructure and growing availability of premium component technologies are creating significant opportunities for bicycle component adoption across both original equipment manufacturer and aftermarket channels. Major international and domestic component manufacturers are establishing comprehensive distribution networks to serve the growing population of cycling enthusiasts and urban commuters requiring high-performance component systems across road cycling, mountain biking, and e-bike applications throughout the United States' major metropolitan areas.
The American market's emphasis on outdoor recreation and personal fitness is driving substantial consumer investments in bicycle upgrades and performance optimization. This trend, combined with the country's large disposable income levels and expanding e-bike adoption rates, creates a favorable environment for premium bicycle component market development. American cyclists are increasingly focusing on high-value component upgrades to improve cycling experiences, with advanced bicycle components representing a key area of consumer spending in this recreational transportation transformation.
The Bicycle Components Aftermarket in the United Kingdom is projected to grow at a CAGR of 4.6% through 2035, supported by urban cycling infrastructure development and government initiatives promoting active transportation alternatives for commuting and short-distance travel. British cycling markets consistently emphasize quality component selection within integrated bicycle retail ecosystems that prioritize rider safety and performance optimization across both traditional cycling and emerging e-bike applications. The market benefits from strong cycling advocacy organizations, established component distribution channels, and comprehensive regulatory support for bicycle transportation.
The UK's cycling industry is characterized by growing participation rates, strong consumer interest in cycling as both transportation and recreation, and increasing emphasis on component quality and reliability. The country's post-Brexit market dynamics have created both challenges and opportunities, with increased focus on domestic supply chain development and direct-to-consumer component sales driving changes in traditional distribution models.
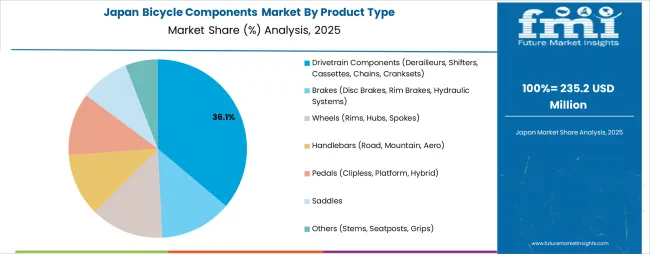
The bicycle components industry in Japan is projected to grow at a CAGR of 4.2% through 2035, supported by the country's well-established precision manufacturing infrastructure, comprehensive quality control standards, and systematic approach to product development that emphasizes reliability, innovation, and technical excellence. Japanese component manufacturers such as Shimano maintain global market leadership through continuous technological innovation and rigorous quality assurance processes. The domestic market is characterized by high technical standards, established cycling cultures particularly around road cycling and urban commuting, and long-term brand loyalty among cycling enthusiasts.
Japan's bicycle component industry benefits from advanced manufacturing technologies, sophisticated research and development capabilities, and a strong cultural emphasis on craftsmanship and continuous improvement. The country's aging population and urban density create steady demand for practical cycling solutions and component reliability, while the emphasis on precision engineering supports premium positioning for Japanese-manufactured components in global markets.
Demand for bicycle components in South Korea is projected to grow at a CAGR of 4.0% through 2035, driven by increasing cycling participation rates, urban cycling infrastructure development, and growing health consciousness among middle-class populations. The Korean market represents an emerging opportunity characterized by rapid adoption of cycling as both recreational activity and urban transportation mode, supported by government investments in cycling infrastructure and public awareness campaigns promoting active lifestyles. The market benefits from strong domestic manufacturing capabilities and increasing consumer spending on premium recreational equipment.
South Korea's position as a technology-forward market creates opportunities for advanced component technologies including electronic shifting systems, smart bicycle integration, and connected cycling platforms. The country's compact urban geography and well-developed public transportation networks create ideal conditions for bicycle commuting integration, while the growing popularity of cycling tourism and recreational riding drives demand for performance component upgrades.
The bicycle components industry in China is expanding at a CAGR exceeding 4.1%, supported by rapid urbanization, growing environmental consciousness, and the country's dominant position in global bicycle manufacturing. China represents both the world's largest bicycle production base and an increasingly important domestic consumption market as urban populations seek green transportation alternatives and middle-class consumers invest in recreational cycling equipment. The market is characterized by massive production scale, evolving quality standards, and increasing domestic brand competitiveness alongside established international component manufacturers.
China's bicycle component sector benefits from complete supply chain integration, cost-competitive manufacturing infrastructure, and government support for green transportation initiatives. The country's e-bike market is the world's largest, creating enormous demand for specialized components adapted to electric bicycle requirements. As Chinese manufacturers move upstream from basic component production to advanced technology development, domestic brands are increasingly competing with established international players in both domestic and export markets.
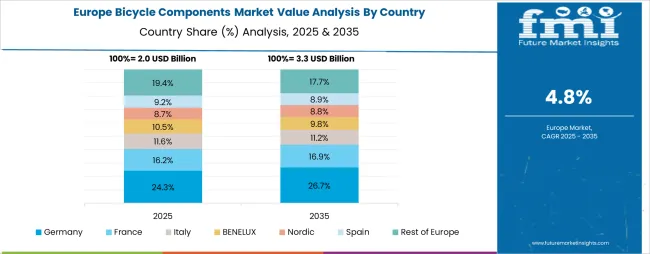
The Europe automotive load floor market is projected to grow from USD 82.4 million in 2025 to approximately USD 115.8 million by 2035, recording an absolute increase of USD 33.4 million over the forecast period. This represents a total growth of 40.5%, translating into a compound annual growth rate (CAGR) of 3.5% between 2025 and 2035.The market’s steady expansion is supported by the region’s premium vehicle manufacturing strength, adoption of lightweight interior materials, and innovation in vehicle cabin design to improve passenger experience and cargo functionality. Germany is set to maintain lea dership, while the United Kingdom and France follow as strong contributors driven by electrification and modernization strategies.
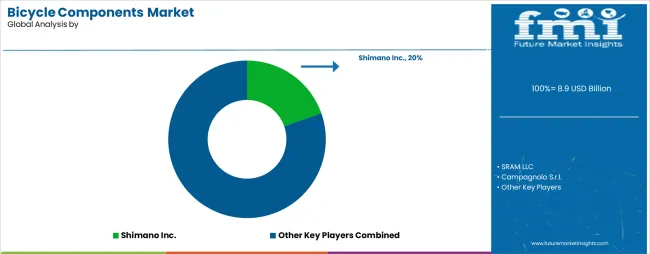
The Bicycle Components Aftermarket is characterized by concentrated competition among established global manufacturers, specialty component brands, and emerging technology-focused companies delivering high-performance, reliable, and innovative component systems. Companies are investing in research and development advancement, manufacturing process optimization, strategic partnerships with bicycle brands, and comprehensive dealer support programs to deliver effective, efficient, and technologically advanced bicycle component solutions that meet demanding performance and reliability requirements. Product innovation, weight optimization protocols, and supply chain efficiency are central to strengthening market positions and brand loyalty.
Shimano Inc. leads the market with comprehensive component group offerings spanning entry-level to professional racing tiers, with a focus on manufacturing consistency and global distribution reach for cycling applications. SRAM LLC provides specialized high-performance components with emphasis on innovative technologies including wireless electronic shifting and comprehensive drivetrain integration. Campagnolo S.r.l. focuses on premium road cycling components with Italian design heritage and precision engineering for enthusiast and professional markets. Giant Manufacturing Co. delivers vertically integrated component production alongside bicycle manufacturing with strong OEM relationships.
Tektro Technology Corp. operates with a focus on cost-effective braking solutions serving diverse bicycle segments and price points. Additional industry participants provide specialized component categories including wheels, saddles, and handlebar systems, while emerging technology companies develop electronic shifting platforms, power measurement devices, and connected cycling ecosystems that are increasingly integrated into premium component offerings and performance-oriented bicycle configurations.
| Items | Values |
|---|---|
| Quantitative Units (2025) | USD 8.9 billion |
| Product Type | Drivetrain Components, Brakes, Wheels, Handlebars, Pedals, Saddles, Others |
| Bicycle Type | Road Bikes, Mountain Bikes, Hybrid Bikes, Electric Bikes, Others |
| Distribution Channel | Original Equipment Manufacturer (OEM), Aftermarket, Online Retail |
| Regions Covered | North America, Europe, Asia Pacific, Latin America, Middle East & Africa |
| Countries Covered | United States, European Union, United Kingdom, Japan, South Korea, China, India and 40+ countries |
| Key Companies Profiled | Shimano Inc., SRAM LLC, Campagnolo S.r.l., Giant Manufacturing Co., Tektro Technology Corp. |
| Additional Attributes | Dollar sales by product type and bicycle type, regional demand trends, competitive landscape, manufacturer preferences for specific component technologies, integration with specialty bicycle platforms, innovations in electronic shifting and smart cycling systems, performance optimization, and aftermarket upgrade pathways |
The global Bicycle Components Aftermarket is estimated to be valued at USD 8.9 billion in 2025.
The market size for the Bicycle Components Aftermarket is projected to reach USD 15.2 billion by 2035.
The Bicycle Components Aftermarket is expected to grow at a 5.5% CAGR between 2025 and 2035.
The key product types in Bicycle Components Aftermarket are drivetrain components (derailleurs, shifters, cassettes, chains, cranksets), brakes (disc brakes, rim brakes, hydraulic systems), wheels (rims, hubs, spokes), handlebars (road, mountain, aero), pedals (clipless, platform, hybrid), saddles and others (stems, seatposts, grips).
In terms of bicycle type, road bikes segment to command 35.0% share in the Bicycle Components Aftermarket in 2025.


Full Research Suite comprises of:
Market outlook & trends analysis
Interviews & case studies
Strategic recommendations
Vendor profiles & capabilities analysis
5-year forecasts
8 regions and 60+ country-level data splits
Market segment data splits
12 months of continuous data updates
DELIVERED AS:
PDF EXCEL ONLINE
Bicycle Tire Market Size and Share Forecast Outlook 2025 to 2035
Bicycle Chain Market Size and Share Forecast Outlook 2025 to 2035
Bicycle Chain Tensioner Market Size and Share Forecast Outlook 2025 to 2035
Bicycle Crankset Market Size and Share Forecast Outlook 2025 to 2035
Bicycle Drivetrain Cassette Market Size and Share Forecast Outlook 2025 to 2035
Bicycle Frames Market Analysis - Size, Share, and Forecast Outlook 2025 to 2035
Bicycle Saddle Market Size and Share Forecast Outlook 2025 to 2035
Bicycle Electronic Drivetrain Market Size and Share Forecast Outlook 2025 to 2035
Bicycle Chain Device Market Size and Share Forecast Outlook 2025 to 2035
Bicycle Gear Shifter Market Size and Share Forecast Outlook 2025 to 2035
Bicycle Brake Lever Market Size and Share Forecast Outlook 2025 to 2035
Bicycle Bottom Bracket Market Size and Share Forecast Outlook 2025 to 2035
Bicycle Front Hub Market Size and Share Forecast Outlook 2025 to 2035
Bicycle Rim Market Size and Share Forecast Outlook 2025 to 2035
Bicycle Disc Brake Rotor Market Size and Share Forecast Outlook 2025 to 2035
Bicycle Trip Market Size and Share Forecast Outlook 2025 to 2035
Bicycle Mechanical Disc Brake Market Size and Share Forecast Outlook 2025 to 2035
Bicycle Light Market Growth - Trends & Forecast 2025 to 2035
Bicycle Market Analysis - Size, Share, and Forecast Outlook 2025 to 2035
Bicycle Bags and Backpacks Market - Trends, Growth & Forecast 2025 to 2035

Thank you!
You will receive an email from our Business Development Manager. Please be sure to check your SPAM/JUNK folder too.
Chat With
MaRIA