
- Market Size (2026)
- USD 126.2 Mn
- Forecast (2036)
- USD 251.8 Mn
- CAGR (2026 to 2036)
- 7.1%
How big is Bicycle Tourism Market in 2026?
The global bicycle tourism market is estimated at USD 117.8 million in 2025 and is expected to reach USD 126.2 million in 2026. Over 2026 to 2036, sales of cycling holidays are likely to grow at a CAGR of 7.1% and reach USD 251.8 million. FMI analysis puts leisure cycling in the lead, with an expected 62% of 2026 type sales.
Sales of cycling holidays are rising as more travellers choose easy-paced rides between towns on long-distance routes. This is visible in EuroVelo data, as cycling on the network grew 4% in 2025, with 108 million bicycle counts at 496 counting locations. As a result, operators have a steady flow of riders to convert into guided and self-guided trips. Demand for cycling packages among international travellers is also growing, since 1.52 billion international tourists crossed borders in 2025, up 4%. For instance, Backroads introduced a custom titanium performance e-bike on May 20, 2026, along with a four-country ride through the Ardennes for 2027. Adoption of e-bikes of this kind opens multi-day routes to riders of mixed fitness. FMI analysis finds that e-bikes let more guests finish each route, which raises the value of every departure.
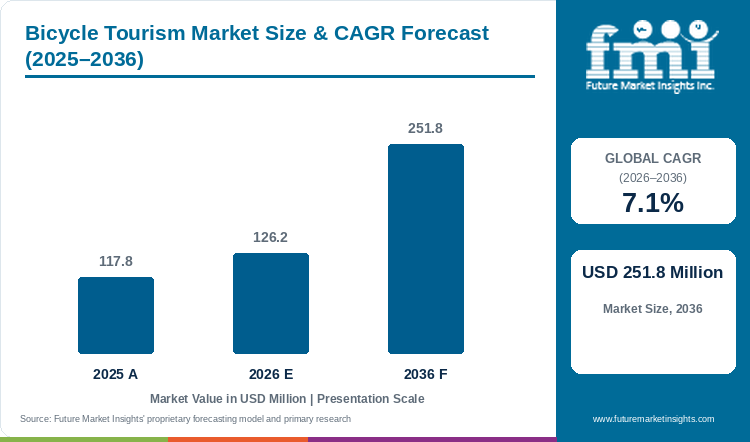
Table 1: Bicycle Tourism Market Size and Forecast (USD million), 2025 to 2036
| Market size and forecast | Value |
|---|---|
| 2025 market size | USD 117.8 million |
| Estimated market size in 2026 | USD 126.2 million |
| Projected market size by 2036 | USD 251.8 million |
| CAGR (2026 to 2036) | 7.1% |
| Added sales, 2026 to 2036 | USD 125.6 million |
Key Market Trends & Insights
- By type: Leisure cycling is expected to hold 62% of 2026 bookings, since gentle routes past rivers, vineyards and old towns suit couples and families with little training.
- By tourist type: Domestic riders form the larger group, with an estimated 57.3% of 2026 sales, as short breaks on home routes need no flights and little planning.
- By booking channel: With about 72% of 2026 sales, online platforms are the main way riders reserve trips, as route maps, bike hire and luggage transfer can be compared in one place.
Regional Highlights
- Fastest-growing country: Italy is projected to grow fastest, at a CAGR of 8.2% from 2026 to 2036, as regions invest in long-distance cycleways that link wine areas, lakes and heritage towns.
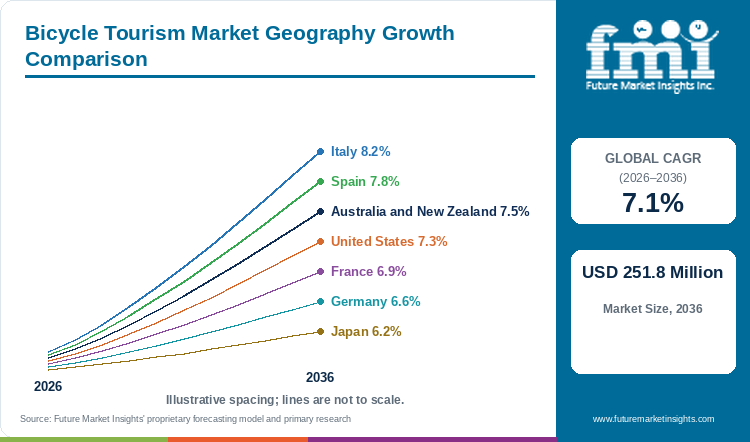
- Growth across other countries: Spain is set to grow at 7.8%, ahead of Australia and New Zealand at 7.5%. For the United States the rate is 7.3%, against 6.9% for France. Germany is placed at 6.6%, and Japan shows the lowest rate, at 6.2%.
Operators can only sell trips on routes that are safe and signed, so route infrastructure is the main capacity constraint. In the United States, Adventure Cycling Association said the U.S. Bicycle Route System now spans 24,144 miles of connected and vetted routes. Each new segment opens fresh itineraries for tour companies, and the latest additions in Tennessee and Wisconsin added 810.7 miles. Demand for point-to-point trips grows as networks get longer, which spreads bookings beyond a few famous corridors. In Europe, traffic on the EuroVelo network has grown 14.7% since 2019. Higher use on established routes supports more guesthouses and bike shops along each corridor, so service quality for tour groups keeps improving.
Consumption of cycle tourism services is large compared with the organised trip segment, and that gap shows how much room operators still have. Germany alone saw gross revenue from cycling tourists and day excursions of EUR 18 billion in 2024, according to an ECF report presented at the EuroVelo Conference. Most of that money goes to independent riders who book rooms and meals directly, so packaged tours capture only a small share. Italy shows a similar pattern of fast growth, as the economic impact of cycling tourism reached EUR 6.4 billion in 2025, up 39% since 2019. Rising visitor spend at destinations gives tour operators a larger pool to convert, especially among riders who want luggage transfer and route support.
E-bikes and digital route tools are changing who can join a cycling holiday. Strava said the platform serves over 180 million users in more than 185 countries, and a new route was created every 19 seconds through 2025. Sales of self-guided trips gain from route-planning habits of this kind, which favours platforms that bundle maps with bookings. On the hardware side, CONEBI said European bicycle sales in 2024 were settling back to pre-pandemic levels, though e-bikes remained a significant share of the market. Use of e-bikes keeps older and less active riders in the customer base, which supports demand for longer and hillier tours.
Table 2: Supporting Industry Indicators for the Bicycle Tourism Market, 2019 to 2026
| Indicator | Data point | Why it matters | Source |
|---|---|---|---|
| EuroVelo cycling volume | Cycling on EuroVelo grew 4% in 2025, with 108 million bicycle counts at 496 counting locations. | Route use shows the pool of riders that operators can convert. | |
| EuroVelo growth since 2019 | Cycling levels on the EuroVelo network grew 14.7% from 2019 to 2025. | Sustained growth supports services along long-distance corridors. | |
| Season spread | Summer accounted for 33% of annual EuroVelo traffic in 2025, down from about 40% in 2019. | A longer season lets operators run more departures each year. | |
| International arrivals | International tourist arrivals reached 1.52 billion in 2025, up 4%. | Cross-border travel feeds the international rider segment. | |
| Tourism outlook | International tourism is expected to grow 3% to 4% in 2026. | Wider travel growth sets the floor for cycling trip demand. | |
| Germany cycle tourism | Gross revenue from cycling tourists and day excursions in Germany reached EUR 18 billion in 2024. | Destination outlays dwarf packaged tour sales. | |
| Italy cycle tourism | The economic impact of cycling tourism in Italy reached EUR 6.4 billion in 2025, up 39% since 2019. | Fast growth in a leading destination widens the operator opportunity. | |
| US route network | The U.S. Bicycle Route System covers 24,144 miles, with 810.7 miles added in the latest round. | Longer networks create more point-to-point itineraries. | |
| US outdoor participation | Outdoor recreation participation in the United States reached 183.2 million people in 2025. | A broad active population supports domestic cycling trips. | |
| Digital route planning | Strava reports over 180 million users in more than 185 countries and a new route every 19 seconds in 2025. | Self-planned routes make self-guided products easier to sell. | |
| Operator equipment | Backroads introduced a custom titanium performance e-bike in May 2026. | Better e-bikes open multi-day trips to riders of mixed fitness. |
Demand Intensity Analysis
The bicycle tourism market size is easiest to test against destination expenditure in Germany. Gross revenue from cycling tourists and day excursions in Germany reached EUR 18 billion in 2024. Against that total, the market is estimated at USD 117.8 million in 2025. Since one euro buys more than one dollar, the market estimate is below 0.7% of the German figure alone. Scope explains most of the gap, since the German figure counts every meal, room and day trip, and the market estimate covers organised cycling holidays sold by operators and platforms. The small ratio shows how much independent cycle travel operators still have to package.
Italy offers a second benchmark for the leading segment. Applying the 62% leisure share to the 2026 estimate yields roughly USD 78.2 million of leisure trips. The economic impact of cycling tourism in Italy reached EUR 6.4 billion in 2025. On the same basis, the global leisure segment is less than 1.3% of the economic impact of cycling tourism in Italy alone. Packaged leisure trips therefore remain a niche within destination expenditure, which leaves room for steady share gains through 2036.
Outside growth rates offer a third comparison with the forecast. UN Tourism expects international tourism to grow 3% to 4% in 2026, and EuroVelo counts rose 4% in 2025. Set against the 7.1% CAGR, these volume rates leave a gap of about 3 to 4 percentage points a year. That gap needs to come from higher prices, longer trips and a rising operator share of riders. The forecast therefore assumes that more riders move from self-organised travel to packaged trips. E-bike guided tours and luggage transfer are the most likely sources of that shift, as both raise trip value per guest.
A last benchmark divides the estimate by bicycle counts on the EuroVelo network. Dividing the 2025 estimate by the 108 million bicycle counts on EuroVelo in 2025 gives about USD 1.1 per count. A count is one bicycle passing one sensor, so the measure overstates the number of riders, and the market covers every region, not only Europe. Even so, the low value per count suggests that organised tourism captures a very small part of route use, which leaves room for many years of growth.
Table 3: Demand Intensity Metrics for the Bicycle Tourism Market, 2024 and 2025 Data Against 2025 and 2026 Market Values
| Demand intensity metric | Value | Basis |
|---|---|---|
| Germany cycle tourism gross revenue, 2024 | EUR 18 billion | European Cyclists’ Federation report, Germany 2024 data |
| Market value as a share of German cycle tourism revenue | Below 0.7% | Calculated from the German 2024 figure and the 2025 market value |
| Italy cycle tourism economic impact, 2025 | EUR 6.4 billion | European Cyclists’ Federation report, Italy 2025 data |
| Leisure cycling segment value, 2026 | USD 78.2 million | Calculated as 62% of the 2026 market value |
| Leisure segment as a share of Italian cycle tourism impact | Below 1.3% | Calculated from the Italian 2025 figure and the 2026 leisure segment value |
| International tourism growth outlook, 2026 | 3% to 4% | UN Tourism, World Tourism Barometer, January 2026 |
| EuroVelo cycling growth, 2025 | 4% | European Cyclists’ Federation and Eco-Counter, EuroVelo Usage Barometer |
| Implied annual growth from price, trip length and operator share | About 3 to 4 percentage points | Calculated from the 7.1% CAGR and the UN Tourism and EuroVelo volume growth rates |
| EuroVelo bicycle counts, 2025 | 108 million | European Cyclists’ Federation and Eco-Counter, 496 counting locations |
| Market value per EuroVelo bicycle count | About USD 1.1 | Calculated from EuroVelo 2025 counts and the 2025 market value |
Analyst Perspective
“Cycling holidays are moving from a sport for the fit few to a slow-travel product for ordinary tourists, and e-bikes are the reason the age range keeps widening. Operators that control good routes, luggage logistics and bike fleets will hold pricing power. Self-guided trips sold online will grow fastest, though guided trips will keep the highest value per guest.”
- Ronak Shah, Principal Consultant, Future Market Insights.
How is the bicycle tourism market segmented?
The market is segmented into type, tourist type, booking channel, and region. Leisure cycling is expected to lead type with 62% share in 2026, and domestic tourists lead tourist type with an estimated 57.3%.
By type: leisure cycling, cultural cycling, sports and adventure cycling, eco cycling, and wellness cycling.
By tourist type: domestic tourists and international tourists.
By booking channel: online platforms, direct booking with operators, and in-person travel agencies.
By region: North America, Latin America, Western Europe, Eastern Europe, East Asia, South Asia and Pacific, and Middle East and Africa.
Why does leisure cycling lead bicycle tourism by type?
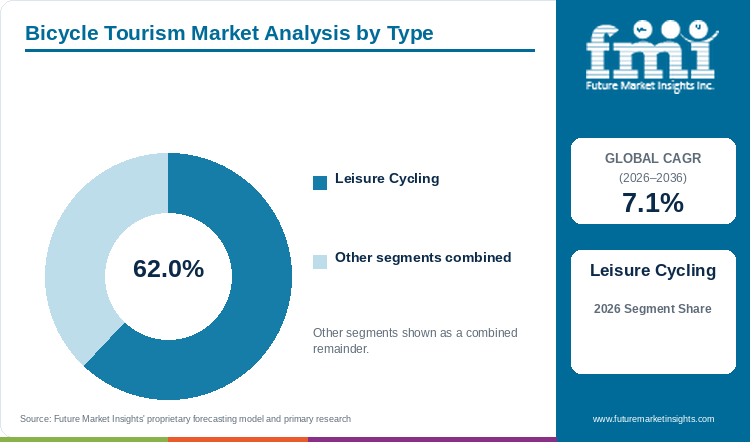
Leisure cycling is expected to lead type sales with 62% share in 2026, well ahead of cultural cycling at an estimated 13.4%.
Table 4: Type Share for the Bicycle Tourism Market (percentage share), 2026
| Type | Estimated Share (2026) |
|---|---|
| Leisure Cycling | 62% |
| Cultural Cycling | 13.4% |
| Sports & Adventure Cycling | 12.1% |
| Eco Cycling | 7.3% |
| Wellness Cycling | 5.2% |
| Total | 100.0% |
Table 5: Type Leadership and Market Growth for the Bicycle Tourism Market (segment and CAGR percentage), 2026 to 2036
| Metric | Value |
|---|---|
| Global CAGR (2026 to 2036) | 7.1% |
| Leading Segment | Leisure Cycling |
Popularity of leisure cycling is high, and the type is expected to take 62% of 2026 sales, as flat river paths and short daily stages attract travellers who want scenery more than exercise. Cultural cycling, at about 13.4%, links museums and heritage towns, and sports and adventure cycling at 12.1% serves riders who chase hills and events. Eco cycling holds 7.3% and wellness cycling 5.2%, both growing from small bases. Route use keeps spreading across the year, which suits relaxed leisure riders. Summer accounted for 33% of annual EuroVelo traffic in 2025, down from about 40% in 2019. A longer riding season lets operators fill shoulder months with easy leisure trips, and leisure cycling is expected to keep the lead through 2036.
- Leisure cycling covers river-path tours, lake circuits, wine-route rides and family trips with short daily distances.
- Spring and autumn are gaining riders on European routes as the season grows longer. Spring cycling on EuroVelo grew 6.7% in 2025, the fastest of any season. Busier spring months let leisure operators add departures before the summer peak.
Why do domestic tourists lead bicycle tourism by tourist type?
Domestic tourists are expected to lead tourist type sales with 57.3% share in 2026, ahead of international tourists at an estimated 42.7%.
Table 6: Tourist Type Share for the Bicycle Tourism Market (percentage share), 2026
| Tourist Type | Estimated Share (2026) |
|---|---|
| Domestic Tourists | 57.3% |
| International Tourists | 42.7% |
| Total | 100.0% |
Buyer preference for short home trips is strong, so domestic riders are estimated to account for 57.3% of 2026 sales, since a weekend on a home route needs only a train ticket and a booked room. International tourists, at 42.7%, spend more per trip on flights, guides and longer itineraries. A large active population at home sustains the domestic lead in North America. Outdoor recreation participation in the United States reached 183.2 million people in 2025, according to the Outdoor Industry Association. Such a broad base of active adults gives US operators a ready market for short regional rides. Over the forecast period, FMI expects international riders to gain ground as long-haul cycling holidays recover with wider travel.
- Domestic trips include weekend rail-and-ride breaks, regional path tours and club outings.
- Europe is the centre of cross-border riding, and the region welcomed 793 million international tourists in 2025, up 4%. A large inbound flow gives European operators a steady supply of foreign riders for multi-country routes.
Why do online platforms lead bicycle tourism by booking channel?
Online platforms are expected to lead booking channel sales with 72% share in 2026, ahead of direct booking with operators at an estimated 19.5%.
Table 7: Booking Channel Share for the Bicycle Tourism Market (percentage share), 2026
| Booking Channel | Estimated Share (2026) |
|---|---|
| Online Platforms | 72% |
| Direct Booking with Operators | 19.5% |
| In-Person Travel Agencies | 8.5% |
| Total | 100.0% |
Online platforms handle about 72% of 2026 sales, as riders compare routes, bike types and luggage options on one screen before paying. Direct booking with operators, at 19.5%, suits repeat guests of a trusted brand, and in-person travel agencies keep 8.5% among older buyers. Digital route planning feeds the online channel, since riders already map trips on apps. Strava said a new route was created every 19 seconds throughout 2025 on the platform. Riders who already plan routes online move easily to booking trips online, and FMI sees the online share holding firm through 2036.
- Online platforms include operator websites, marketplaces for active travel and route apps with booking links.
- Wider adventure travel growth also supports online sales of cycling trips. The adventure tourism market is projected to grow at an 8% CAGR from 2026 to 2036, and the overlap with cycling trips keeps online traffic high.
What are the drivers, restraints, and opportunities in the bicycle tourism market?
Better routes and wider e-bike use bring new riders into cycling holidays. Weather risk and seasonality restrain bookings, and shoulder-season and slow-travel products open new demand.
- Driver: Long-distance routes and e-bikes make cycling holidays practical for travellers with modest fitness.
- Restraint: Heat, rain and short peak seasons limit departures, and some routes still lack safe links between towns.
- Opportunity: Spring and autumn trips, wellness add-ons and rail-linked packages can fill months that were quiet before.
Route Networks and E-bikes Widen the Rider Base
Safe infrastructure between towns is the first thing that brings less experienced riders into the category. Europe has more than 166 million people living within 5 km of the nearest EuroVelo route, the ECF reports. Popularity of local paths near home matters, as these paths are often the first step toward a booked holiday, and e-bikes then extend the distance a guest can ride. The e-bike market is forecast to grow at a 4% CAGR from 2025 to 2035, adding steadily to the bikes available for rental fleets. As a result, FMI sees route access and e-bike rental as the two levers behind most new bookings through 2036.
Seasonality and Route Gaps Hold Back Bookings
Weather and short seasons cap the number of departures an operator can run each year. Even though demand is spreading across the year, summer remains the peak season on EuroVelo, with nearly 395,000 bicycle counts per day. Prices of hotels rise with peak crowding, which limits capacity and squeezes margins for tour companies in July and August. Volume growth is also uneven, as CONEBI said European bicycle sales in 2024 were settling back to pre-pandemic levels. A flatter bike market slows the arrival of new riders, so operators will compete harder for existing cyclists.
Shoulder Seasons and Slow Travel Open New Demand
Slow travel is creating room for packages outside the summer peak. Spring cycling on EuroVelo grew 6.7% in 2025, followed by autumn at 3.8%. Growth of the bicycle tourism market in these months lets operators run more departures with the same guides and bikes, which improves fleet use. Wellness themes add further value, and the wellness tourism market is projected to grow at a 10.4% CAGR from 2026 to 2036. Key trends in the bicycle tourism market point to easy rides with spa and food stops, and operators that combine them will gain the most from these quieter months.
Which country CAGRs are profiled in the bicycle tourism market?
Table 8: Country CAGR Comparison for the Bicycle Tourism Market (CAGR percentage), 2026 to 2036
| Country | CAGR |
|---|---|
| Italy | 8.2% |
| Spain | 7.8% |
| Australia and New Zealand | 7.5% |
| United States | 7.3% |
| France | 6.9% |
| Germany | 6.6% |
| Japan | 6.2% |
How do country-level CAGRs compare in the bicycle tourism market?
FMI ranks Italy first at 8.2%, 1.1 points above the 7.1% global CAGR, as new cycleways open wine and lake regions to riders. Spain comes next at 7.8%, helped by mild winters, and Australia and New Zealand are projected at 7.5%, helped by trips on former railway paths. The United States runs just above the global pace at 7.3%. Three mature markets fall below that rate, with France at 6.9%, Germany at 6.6% and Japan at 6.2%. Large existing rider bases leave less room for fast growth in these countries.
- Italian regions are building cycleways through wine country, which draws foreign riders and rewards operators with local guides.
- Mild winters let Spain sell cycling trips in months when northern Europe is too cold, so operators can run year-round fleets there.
- Former railway paths in Australia and New Zealand attract domestic families, favouring operators that offer bike hire with shuttle services.
- For the United States, a growing signed route network creates new multi-state itineraries for tour companies.
- France has a mature cycling holiday sector, so growth comes from premium e-bike and gastronomy trips.
- Germany already has one of the largest cycle tourism economies in Europe, which slows percentage growth but keeps volumes high.
- Japan relies on a few famous island and coastal routes, and operators gain most from inbound riders.
Full report country CAGRs cover: a 6.2% to 8.2% band across the seven profiled countries, led by Italy and closed by Japan, plus regional tables for each remaining standard country.
Country-wise Analysis
Italy Bicycle Tourism Market Outlook (2026 to 2036)
Italy is turning cycling into a tool for rural tourism, with routes that link vineyards, lakes and hill towns. The economic impact of cycling tourism in Italy reached EUR 6.4 billion in 2025, a 39% increase since 2019. Fast growth in visitor spend gives operators a large base of riders to package, so FMI projects Italy to grow at an 8.2% CAGR, the fastest among the profiled countries.
Key takeaway: Italy is expected to attract more cycling holidays as regions open new cycleways through wine areas and pair the rides with local food.
Spain Bicycle Tourism Market Outlook (2026 to 2036)
Spain offers warm weather when most European routes are quiet, and coastal regions host road cycling camps through winter. Island and southern routes attract both training groups and leisure riders. Spanish cycling trip bookings are set to rise by 7.8% a year to 2036.
Key takeaway: Mild winters let operators in Spain sell cycling trips in months when northern Europe is too cold, which gives Spain a longer season.
Australia and New Zealand Bicycle Tourism Market Outlook (2026 to 2036)
Former railway lines and coastal paths in both countries draw families and retired riders on multi-day trips. Operators bundle bike hire, luggage shuttles and farm-stay rooms into simple packages. Australia and New Zealand are projected to grow at a 7.5% CAGR, above the global rate.
Key takeaway: Families and retired riders in Australia and New Zealand book easy trips on former railway paths, often with bike hire and luggage shuttles included.
United States Bicycle Tourism Market Outlook (2026 to 2036)
The US route network keeps expanding, and each new signed route gives tour companies another itinerary to sell. Adventure Cycling Association said two new routes in Tennessee and Wisconsin added 810.7 miles to the U.S. Bicycle Route System. Longer connected routes suit multi-day trips, so the United States is projected to grow at a 7.3% CAGR.
Key takeaway: Tour companies in the United States can sell more multi-day trips as the signed route network grows longer and links more states.
France Bicycle Tourism Market Outlook (2026 to 2036)
France has well-known river routes along the Loire and the Rhône, and many riders already travel there independently. Operators add value with premium e-bikes, boutique hotels and food-led itineraries. With a mature base, France is likely to grow at a 6.9% CAGR, slightly below the global pace.
Key takeaway: In France, most riders already travel independently, so operators will grow by selling premium e-bike, hotel and food-led trips to them.
Germany Bicycle Tourism Market Outlook (2026 to 2036)
Germany has one of the largest cycle tourism economies in Europe, built on river paths and dense rail links. Gross revenue from cycling tourists and day excursions in Germany reached EUR 18 billion in 2024. A base of that size grows more slowly in percentage terms, and FMI projects Germany at a 6.6% CAGR.
Key takeaway: Germany will remain one of the largest markets for cycling holidays, even though growth there is expected to run below the global rate.
Japan Bicycle Tourism Market Outlook (2026 to 2036)
Japan promotes a small number of famous routes across islands and coastlines, and inbound visitors make up a growing part of riders. Domestic interest in long-distance cycling holidays is more limited than in Europe. Japan is therefore expected to grow at a 6.2% CAGR, the lowest among the profiled countries.
Key takeaway: Sales of bicycle holidays in Japan will rely mainly on foreign visitors who come to ride well-known coastal and island routes.
Who are the notable companies in the bicycle tourism market?
The profiled tour operators are Trek Travel, Butterfield & Robinson, Backroads, BikeTours.com, Satoyama Experience, PakaBike and Rutas Chévere. The profiled route and community platforms are Komoot, Ride with GPS, Strava, WarmShowers and Adventure Cycling Association.
The leading players in the bicycle tourism market split between guided operators, which compete on guides, hotels and bike quality, and route platforms, which compete on maps and community data. Backroads, founded in 1979, launched a custom titanium performance e-bike in May 2026. Own-brand e-bikes give premium operators a product edge over companies that rent generic fleets. Route platforms work at a far larger scale, and Strava reports over 180 million users in more than 185 countries. Platforms of that size influence the destinations riders choose, so operators increasingly partner with them. The profiled companies fall into two groups, tour operators and route and community platforms.
- Tour operators running guided and self-guided departures: Trek Travel, Butterfield & Robinson, Backroads, BikeTours.com, Satoyama Experience, PakaBike and Rutas Chévere.
- Route and community platforms: Komoot, Ride with GPS, Strava, WarmShowers and Adventure Cycling Association.
Competitive Benchmarking: Bicycle Tourism Market
Table 9: Competitive Benchmarking for the Bicycle Tourism Market (qualitative ratings), 2026
| Company | Guided Trip Range | E-bike Fleet | Digital Route Tools | Recent Activity |
|---|---|---|---|---|
| Backroads | High | High | Medium | High |
| Trek Travel | High | High | Medium | Medium |
| Butterfield & Robinson | High | Medium | Low | Medium |
| BikeTours.com | Medium | Medium | Medium | Low |
| Strava | Low | Low | High | High |
| Komoot | Low | Low | High | Medium |
Ratings compare the companies on guided trip range, e-bike fleet, digital route tools and recent activity.
Key Developments in the Bicycle Tourism Market
- In October 2026, the European Cyclists’ Federation presented a report on the economic impact of cycling tourism at the EuroVelo Conference. Fresh national figures help regional governments justify new investment in cycle routes.
- Backroads unveiled a custom titanium performance e-bike on May 20, 2026. Premium e-bikes help operators sell harder routes to a wider age range.
- On April 16, 2026, the ECF reported that cycling on EuroVelo grew 4% in 2025. Rising route use confirms steady demand for European cycle trips.
- Adventure Cycling Association announced the Fall 2025 additions to the U.S. Bicycle Route System in January 2026. New signed miles create fresh multi-day itineraries in Tennessee and Wisconsin.
- UN Tourism reported 1.52 billion international arrivals for 2025 in a January 2026 release. Broad travel growth gives cross-border cycling holidays a larger pool of guests.
- Strava published the 12th Year in Sport trend report in December 2025. Route-planning data increasingly shapes the destinations that riders choose for holidays.
Key Players in the Bicycle Tourism Market
Tour Operators
- Trek Travel
- Butterfield & Robinson
- Backroads
- BikeTours.com
- Satoyama Experience
- PakaBike
- Rutas Chévere
Route and Community Platforms
- Komoot
- Ride with GPS
- Strava
- WarmShowers
- Adventure Cycling Association
Bicycle Tourism Market - Report Scope
Table 10: Report Scope for the Bicycle Tourism Market (coverage fields and definitions), 2026 to 2036
| Coverage field | Report scope |
|---|---|
| Market breakdown | Type; tourist type; booking channel; region |
| Quantitative units | USD million |
| Market definition | Organised and self-guided cycling holidays and tours sold to travellers, including guided group trips, self-guided packages with luggage transfer, and bookings made through online platforms, operators and travel agencies. |
| Regions covered | North America; Latin America; Western Europe; Eastern Europe; East Asia; South Asia and Pacific; Middle East and Africa |
| Countries covered | Italy; Spain; Australia and New Zealand; United States; France; Germany; Japan |
| Key companies profiled | Trek Travel, Butterfield & Robinson, Backroads, BikeTours.com, Satoyama Experience, PakaBike, Rutas Chévere, Komoot, Ride with GPS, Strava, WarmShowers, Adventure Cycling Association |
| Forecast period | 2026 to 2036 |
Bicycle Tourism Market - Research Methodology
Table 11: Research Methodology for the Bicycle Tourism Market (research methods and approach), 2026 edition
| Method | Approach |
|---|---|
| Data Sources | Company results, industry associations, government statistics and trade publications. |
| Desk Research | Desk research covers route networks, rider volumes, e-bike use, travel flows and operator products. |
| Market Sizing | Market size combines trip sales across types, tourist types and booking channels by region. |
| Data Validation | Figures are cross-checked across company, industry and government sources. |
Bicycle Tourism Market by Segments
Bicycle Tourism Market segmented by Type:
- Leisure Cycling
- Cultural Cycling
- Sports & Adventure Cycling
- Eco Cycling
- Wellness Cycling
Bicycle Tourism Market segmented by Tourist Type:
- Domestic Tourists
- International Tourists
Bicycle Tourism Market segmented by Booking Channel:
- Online Platforms
- Direct Booking with Operators
- In-Person Travel Agencies
Bicycle Tourism Market by Region
- North America
- United States
- Canada
- Latin America
- Brazil
- Mexico
- Argentina
- Chile
- Western Europe
- Germany
- France
- United Kingdom
- Italy
- Spain
- Benelux
- Nordics
- Eastern Europe
- Poland
- Czech Republic
- Romania
- Hungary
- East Asia
- China
- Japan
- South Korea
- South Asia and Pacific
- India
- ASEAN
- Australia and New Zealand
- Middle East and Africa
- GCC Countries
- South Africa
- Türkiye
- Israel
Research Sources and Bibliography
- [1] European Cyclists' Federation. (2026, April 16). Cycling on EuroVelo grows in 2025, with renewed momentum and seasonal spread. https://pro.eurovelo.com/news/2026-04-16_cycling-on-eurovelo-grows-in-2025-with-renewed-momentum-and-seasonal-spread
- [2] UN Tourism. (2026, January 20). International tourist arrivals up 4% in 2025 reflecting strong travel demand around the world. https://www.untourism.int/news/international-tourist-arrivals-up-4-in-2025-reflecting-strong-travel-demand-around-the-world
- [3] Backroads. (2026, May 20). Backroads' New Custom Performance E-bike Rolls Out in Honor of National Bike Month. https://www.backroads.com/about/media/press-releases/backroads-new-custom-performance-e-bike-rolls-out-honor-national-bike
- [4] Adventure Cycling Association. (2026, January 15). Introducing the Fall 2025 Additions to the United States Bicycle Route System. https://www.adventurecycling.org/member_news/fall-2025-usbrs-updates/
- [5] Zag Daily. (2026, October 1). What is the economic impact of cycling tourism? ECF unveils new report at the EuroVelo Conference. https://zagdaily.com/featured/what-is-the-economic-impact-of-cycling-tourism-ecf-unveils-new-report-at-eurovelo-2026/
- [6] Strava. (2025, December 3). Strava Releases 12th Annual Year in Sport Trend Report, Revealing That Doomscrolling Is Out, Movement Is In. https://www.adnkronos.com/immediapress/eng/strava-releases-12th-annual-year-in-sport-trend-report-revealing-that-doomscrolling-is-out-movement-is-in_iPmltuOBI6UULjUCMcmDr
- [7] CONEBI. (2025, July 17). European Bicycle Industry remains strong in 2024, navigating market adjustments. https://www.conebi.eu/?p=7503
- [8] Modern Campground. (2026, June 22). Outdoor Recreation Participation Hits Record 183.2 Million Americans in 2025, OIA Report Finds. https://moderncampground.com/usa/outdoor-recreation-participation-hits-record-183-2-million-americans-in-2025-oia-report-finds/
This bibliography is provided for reader reference. The full report contains the complete reference list and detailed citations.
This Report Answers
- How big is the bicycle tourism market during 2026?
- What market size is projected by 2036?
- Which type holds notable share?
- Which booking channel holds notable share?
- Which countries have notable growth?
- Which companies are notable in the market?
Table of Content
- Key Takeaways
- Market Size and CAGR
- Top Growth Driver
- Fastest Growing Segment
- Leading Region
- Key Companies
- Emerging Opportunities
- Executive Summary
- Global Market Outlook
- Demand-side Trends
- Supply-side Trends
- Technology Roadmap Analysis
- Analysis and Recommendations
- Analyst Perspective (What is happening? Why now? What should investors know?)
- Key Questions Answered
- How large is the market?
- What is the CAGR?
- What are key trends?
- Which region dominates?
- Who are the leaders?
Read More...
- Market Overview
- Market Coverage / Taxonomy
- Market Definition / Scope / Limitations
- Research Methodology
- Chapter Orientation
- Analytical Lens and Working Hypotheses
- Market Structure, Signals, and Trend Drivers
- Benchmarking and Cross-market Comparability
- Market Sizing, Forecasting, and Opportunity Mapping
- Research Design and Evidence Framework
- Desk Research Programme (Secondary Evidence)
- Expert Input and Fieldwork (Primary Evidence)
- Tooling, Models, and Reference Databases
- Data Engineering and Model Build
- Quality Assurance and Audit Trail
- Market Background
- Market Dynamics (Drivers, Restraints, Opportunity, Trends)
- Scenario Forecast (Optimistic, Likely, Conservative)
- Impact Analysis
- AI Impact
- Sustainability Impact
- Regulatory Impact
- Technology Impact
- Consumer / Buyer Analysis
- Purchase Drivers
- Adoption Barriers
- Buyer Journey
- Opportunity Map Analysis
- Product Life Cycle Analysis
- Supply Chain Analysis
- Investment Feasibility Matrix
- Value Chain Analysis
- PESTLE and Porter's Analysis
- Regulatory Landscape
- Regional Parent Market Outlook
- Production and Consumption Statistics
- Import and Export Statistics
- Global Market Analysis and Forecast, 2021 to 2036
- Historical Market Size Value (USD Million) Analysis, 2021 to 2025
- Current and Future Market Size Value (USD Million) Projections, 2026 to 2036
- Y-o-Y Growth Trend Analysis
- Absolute $ Opportunity Analysis
- Global Market Pricing Analysis, 2021 to 2036
- Global Market Analysis and Forecast, By Type, 2021 to 2036
- Introduction / Key Findings
- Historical Market Size Value (USD Million) Analysis By Type, 2021 to 2025
- Current and Future Market Size Value (USD Million) Analysis and Forecast By Type, 2026 to 2036
- Leisure Cycling
- Cultural Cycling
- Sports & Adventure Cycling
- Eco Cycling
- Wellness Cycling
- Y-o-Y Growth Trend Analysis By Type, 2021 to 2025
- Absolute $ Opportunity Analysis By Type, 2026 to 2036
- Global Market Analysis and Forecast, By Tourist Type, 2021 to 2036
- Introduction / Key Findings
- Historical Market Size Value (USD Million) Analysis By Tourist Type, 2021 to 2025
- Current and Future Market Size Value (USD Million) Analysis and Forecast By Tourist Type, 2026 to 2036
- Domestic Tourists
- International Tourists
- Y-o-Y Growth Trend Analysis By Tourist Type, 2021 to 2025
- Absolute $ Opportunity Analysis By Tourist Type, 2026 to 2036
- Global Market Analysis and Forecast, By Booking Channel, 2021 to 2036
- Introduction / Key Findings
- Historical Market Size Value (USD Million) Analysis By Booking Channel, 2021 to 2025
- Current and Future Market Size Value (USD Million) Analysis and Forecast By Booking Channel, 2026 to 2036
- Online Platforms
- Direct Booking with Operators
- In-Person Travel Agencies
- Y-o-Y Growth Trend Analysis By Booking Channel, 2021 to 2025
- Absolute $ Opportunity Analysis By Booking Channel, 2026 to 2036
- Global Market Analysis and Forecast, By Region, 2021 to 2036
- Introduction
- Historical Market Size Value (USD Million) Analysis By Region, 2021 to 2025
- Current Market Size Value (USD Million) Analysis and Forecast By Region, 2026 to 2036
- North America
- Latin America
- Western Europe
- Eastern Europe
- East Asia
- South Asia and Pacific
- Middle East and Africa
- Market Attractiveness Analysis By Region
- North America Market Analysis and Forecast, By Country, 2021 to 2036
- Historical Market Size Value (USD Million) Trend Analysis By Market Taxonomy, 2021 to 2025
- Market Size Value (USD Million) Forecast By Market Taxonomy, 2026 to 2036
- By Country
- United States
- Canada
- By Type
- By Tourist Type
- By Booking Channel
- By Country
- Market Attractiveness Analysis
- By Country
- By Type
- By Tourist Type
- By Booking Channel
- Key Takeaways
- Latin America Market Analysis and Forecast, By Country
- Historical Market Size Value (USD Million) Trend Analysis By Market Taxonomy, 2021 to 2025
- Market Size Value (USD Million) Forecast By Market Taxonomy, 2026 to 2036
- By Country
- Brazil
- Mexico
- Argentina
- Chile
- By Type
- By Tourist Type
- By Booking Channel
- By Country
- Market Attractiveness Analysis
- By Country
- By Type
- By Tourist Type
- By Booking Channel
- Key Takeaways
- Western Europe Market Analysis and Forecast, By Country
- Historical Market Size Value (USD Million) Trend Analysis By Market Taxonomy, 2021 to 2025
- Market Size Value (USD Million) Forecast By Market Taxonomy, 2026 to 2036
- By Country
- Germany
- France
- United Kingdom
- Italy
- Spain
- Benelux
- Nordics
- By Type
- By Tourist Type
- By Booking Channel
- By Country
- Market Attractiveness Analysis
- By Country
- By Type
- By Tourist Type
- By Booking Channel
- Key Takeaways
- Eastern Europe Market Analysis and Forecast, By Country
- Historical Market Size Value (USD Million) Trend Analysis By Market Taxonomy, 2021 to 2025
- Market Size Value (USD Million) Forecast By Market Taxonomy, 2026 to 2036
- By Country
- Poland
- Czech Republic
- Romania
- Hungary
- By Type
- By Tourist Type
- By Booking Channel
- By Country
- Market Attractiveness Analysis
- By Country
- By Type
- By Tourist Type
- By Booking Channel
- Key Takeaways
- East Asia Market Analysis and Forecast, By Country
- Historical Market Size Value (USD Million) Trend Analysis By Market Taxonomy, 2021 to 2025
- Market Size Value (USD Million) Forecast By Market Taxonomy, 2026 to 2036
- By Country
- China
- Japan
- South Korea
- By Type
- By Tourist Type
- By Booking Channel
- By Country
- Market Attractiveness Analysis
- By Country
- By Type
- By Tourist Type
- By Booking Channel
- Key Takeaways
- South Asia and Pacific Market Analysis and Forecast, By Country
- Historical Market Size Value (USD Million) Trend Analysis By Market Taxonomy, 2021 to 2025
- Market Size Value (USD Million) Forecast By Market Taxonomy, 2026 to 2036
- By Country
- India
- ASEAN
- Australia and New Zealand
- By Type
- By Tourist Type
- By Booking Channel
- By Country
- Market Attractiveness Analysis
- By Country
- By Type
- By Tourist Type
- By Booking Channel
- Key Takeaways
- Middle East and Africa Market Analysis and Forecast, By Country
- Historical Market Size Value (USD Million) Trend Analysis By Market Taxonomy, 2021 to 2025
- Market Size Value (USD Million) Forecast By Market Taxonomy, 2026 to 2036
- By Country
- GCC Countries
- South Africa
- Türkiye
- Israel
- By Type
- By Tourist Type
- By Booking Channel
- By Country
- Market Attractiveness Analysis
- By Country
- By Type
- By Tourist Type
- By Booking Channel
- Key Takeaways
- Key Countries Market Analysis
- United States
- Pricing Analysis
- Market Share Analysis, 2025
- By Type
- By Tourist Type
- By Booking Channel
- Canada
- Pricing Analysis
- Market Share Analysis, 2025
- By Type
- By Tourist Type
- By Booking Channel
- Mexico
- Pricing Analysis
- Market Share Analysis, 2025
- By Type
- By Tourist Type
- By Booking Channel
- Brazil
- Pricing Analysis
- Market Share Analysis, 2025
- By Type
- By Tourist Type
- By Booking Channel
- Chile
- Pricing Analysis
- Market Share Analysis, 2025
- By Type
- By Tourist Type
- By Booking Channel
- Germany
- Pricing Analysis
- Market Share Analysis, 2025
- By Type
- By Tourist Type
- By Booking Channel
- United Kingdom
- Pricing Analysis
- Market Share Analysis, 2025
- By Type
- By Tourist Type
- By Booking Channel
- Italy
- Pricing Analysis
- Market Share Analysis, 2025
- By Type
- By Tourist Type
- By Booking Channel
- Spain
- Pricing Analysis
- Market Share Analysis, 2025
- By Type
- By Tourist Type
- By Booking Channel
- France
- Pricing Analysis
- Market Share Analysis, 2025
- By Type
- By Tourist Type
- By Booking Channel
- India
- Pricing Analysis
- Market Share Analysis, 2025
- By Type
- By Tourist Type
- By Booking Channel
- ASEAN
- Pricing Analysis
- Market Share Analysis, 2025
- By Type
- By Tourist Type
- By Booking Channel
- Australia and New Zealand
- Pricing Analysis
- Market Share Analysis, 2025
- By Type
- By Tourist Type
- By Booking Channel
- China
- Pricing Analysis
- Market Share Analysis, 2025
- By Type
- By Tourist Type
- By Booking Channel
- Japan
- Pricing Analysis
- Market Share Analysis, 2025
- By Type
- By Tourist Type
- By Booking Channel
- South Korea
- Pricing Analysis
- Market Share Analysis, 2025
- By Type
- By Tourist Type
- By Booking Channel
- Poland
- Pricing Analysis
- Market Share Analysis, 2025
- By Type
- By Tourist Type
- By Booking Channel
- Hungary
- Pricing Analysis
- Market Share Analysis, 2025
- By Type
- By Tourist Type
- By Booking Channel
- Türkiye
- Pricing Analysis
- Market Share Analysis, 2025
- By Type
- By Tourist Type
- By Booking Channel
- South Africa
- Pricing Analysis
- Market Share Analysis, 2025
- By Type
- By Tourist Type
- By Booking Channel
- United States
- Market Structure Analysis
- Competition Dashboard
- Competition Benchmarking
- Market Share Analysis of Top Players
- By Regional
- By Type
- By Tourist Type
- By Booking Channel
- Emerging Startups
- Innovation Benchmarking
- Competition Analysis
- Competition Deep Dive
- Backroads
- Overview
- Product Portfolio
- Profitability by Market Segments
- Sales Footprint
- Strategy Overview
- Marketing Strategy
- Product Strategy
- Channel Strategy
- Trek Travel
- Butterfield & Robinson
- BikeTours.com
- Strava
- Komoot
- Satoyama Experience
- PakaBike
- Rutas Chévere
- Ride with GPS
- WarmShowers
- Adventure Cycling Association
- Backroads
- Case Studies
- Success Stories
- Recent Developments
- Competition Deep Dive
- Assumptions & Acronyms Used
List of Tables
- Table 1: Global Market Value (USD Million) Forecast by Region, 2021 to 2036
- Table 2: Global Market Value (USD Million) Forecast by Type, 2021 to 2036
- Table 3: Global Market Value (USD Million) Forecast by Tourist Type, 2021 to 2036
- Table 4: Global Market Value (USD Million) Forecast by Booking Channel, 2021 to 2036
- Table 5: North America Market Value (USD Million) Forecast by Country, 2021 to 2036
- Table 6: North America Market Value (USD Million) Forecast by Type, 2021 to 2036
- Table 7: North America Market Value (USD Million) Forecast by Tourist Type, 2021 to 2036
- Table 8: North America Market Value (USD Million) Forecast by Booking Channel, 2021 to 2036
- Table 9: Latin America Market Value (USD Million) Forecast by Country, 2021 to 2036
- Table 10: Latin America Market Value (USD Million) Forecast by Type, 2021 to 2036
- Table 11: Latin America Market Value (USD Million) Forecast by Tourist Type, 2021 to 2036
- Table 12: Latin America Market Value (USD Million) Forecast by Booking Channel, 2021 to 2036
- Table 13: Western Europe Market Value (USD Million) Forecast by Country, 2021 to 2036
- Table 14: Western Europe Market Value (USD Million) Forecast by Type, 2021 to 2036
- Table 15: Western Europe Market Value (USD Million) Forecast by Tourist Type, 2021 to 2036
- Table 16: Western Europe Market Value (USD Million) Forecast by Booking Channel, 2021 to 2036
- Table 17: Eastern Europe Market Value (USD Million) Forecast by Country, 2021 to 2036
- Table 18: Eastern Europe Market Value (USD Million) Forecast by Type, 2021 to 2036
- Table 19: Eastern Europe Market Value (USD Million) Forecast by Tourist Type, 2021 to 2036
- Table 20: Eastern Europe Market Value (USD Million) Forecast by Booking Channel, 2021 to 2036
- Table 21: East Asia Market Value (USD Million) Forecast by Country, 2021 to 2036
- Table 22: East Asia Market Value (USD Million) Forecast by Type, 2021 to 2036
- Table 23: East Asia Market Value (USD Million) Forecast by Tourist Type, 2021 to 2036
- Table 24: East Asia Market Value (USD Million) Forecast by Booking Channel, 2021 to 2036
- Table 25: South Asia and Pacific Market Value (USD Million) Forecast by Country, 2021 to 2036
- Table 26: South Asia and Pacific Market Value (USD Million) Forecast by Type, 2021 to 2036
- Table 27: South Asia and Pacific Market Value (USD Million) Forecast by Tourist Type, 2021 to 2036
- Table 28: South Asia and Pacific Market Value (USD Million) Forecast by Booking Channel, 2021 to 2036
- Table 29: Middle East and Africa Market Value (USD Million) Forecast by Country, 2021 to 2036
- Table 30: Middle East and Africa Market Value (USD Million) Forecast by Type, 2021 to 2036
- Table 31: Middle East and Africa Market Value (USD Million) Forecast by Tourist Type, 2021 to 2036
- Table 32: Middle East and Africa Market Value (USD Million) Forecast by Booking Channel, 2021 to 2036
List of Figures
- Figure 1: Global Market Pricing Analysis
- Figure 2: Global Market Value (USD Million) Forecast 2021-2036
- Figure 3: Global Market Value Share and BPS Analysis by Type, 2026 and 2036
- Figure 4: Global Market Y-o-Y Growth Comparison by Type, 2026-2036
- Figure 5: Global Market Attractiveness Analysis by Type
- Figure 6: Global Market Value Share and BPS Analysis by Tourist Type, 2026 and 2036
- Figure 7: Global Market Y-o-Y Growth Comparison by Tourist Type, 2026-2036
- Figure 8: Global Market Attractiveness Analysis by Tourist Type
- Figure 9: Global Market Value Share and BPS Analysis by Booking Channel, 2026 and 2036
- Figure 10: Global Market Y-o-Y Growth Comparison by Booking Channel, 2026-2036
- Figure 11: Global Market Attractiveness Analysis by Booking Channel
- Figure 12: Global Market Value (USD Million) Share and BPS Analysis by Region, 2026 and 2036
- Figure 13: Global Market Y-o-Y Growth Comparison by Region, 2026-2036
- Figure 14: Global Market Attractiveness Analysis by Region
- Figure 15: North America Market Incremental Dollar Opportunity, 2026-2036
- Figure 16: Latin America Market Incremental Dollar Opportunity, 2026-2036
- Figure 17: Western Europe Market Incremental Dollar Opportunity, 2026-2036
- Figure 18: Eastern Europe Market Incremental Dollar Opportunity, 2026-2036
- Figure 19: East Asia Market Incremental Dollar Opportunity, 2026-2036
- Figure 20: South Asia and Pacific Market Incremental Dollar Opportunity, 2026-2036
- Figure 21: Middle East and Africa Market Incremental Dollar Opportunity, 2026-2036
- Figure 22: North America Market Value Share and BPS Analysis by Country, 2026 and 2036
- Figure 23: North America Market Value Share and BPS Analysis by Type, 2026 and 2036
- Figure 24: North America Market Y-o-Y Growth Comparison by Type, 2026-2036
- Figure 25: North America Market Attractiveness Analysis by Type
- Figure 26: North America Market Value Share and BPS Analysis by Tourist Type, 2026 and 2036
- Figure 27: North America Market Y-o-Y Growth Comparison by Tourist Type, 2026-2036
- Figure 28: North America Market Attractiveness Analysis by Tourist Type
- Figure 29: North America Market Value Share and BPS Analysis by Booking Channel, 2026 and 2036
- Figure 30: North America Market Y-o-Y Growth Comparison by Booking Channel, 2026-2036
- Figure 31: North America Market Attractiveness Analysis by Booking Channel
- Figure 32: Latin America Market Value Share and BPS Analysis by Country, 2026 and 2036
- Figure 33: Latin America Market Value Share and BPS Analysis by Type, 2026 and 2036
- Figure 34: Latin America Market Y-o-Y Growth Comparison by Type, 2026-2036
- Figure 35: Latin America Market Attractiveness Analysis by Type
- Figure 36: Latin America Market Value Share and BPS Analysis by Tourist Type, 2026 and 2036
- Figure 37: Latin America Market Y-o-Y Growth Comparison by Tourist Type, 2026-2036
- Figure 38: Latin America Market Attractiveness Analysis by Tourist Type
- Figure 39: Latin America Market Value Share and BPS Analysis by Booking Channel, 2026 and 2036
- Figure 40: Latin America Market Y-o-Y Growth Comparison by Booking Channel, 2026-2036
- Figure 41: Latin America Market Attractiveness Analysis by Booking Channel
- Figure 42: Western Europe Market Value Share and BPS Analysis by Country, 2026 and 2036
- Figure 43: Western Europe Market Value Share and BPS Analysis by Type, 2026 and 2036
- Figure 44: Western Europe Market Y-o-Y Growth Comparison by Type, 2026-2036
- Figure 45: Western Europe Market Attractiveness Analysis by Type
- Figure 46: Western Europe Market Value Share and BPS Analysis by Tourist Type, 2026 and 2036
- Figure 47: Western Europe Market Y-o-Y Growth Comparison by Tourist Type, 2026-2036
- Figure 48: Western Europe Market Attractiveness Analysis by Tourist Type
- Figure 49: Western Europe Market Value Share and BPS Analysis by Booking Channel, 2026 and 2036
- Figure 50: Western Europe Market Y-o-Y Growth Comparison by Booking Channel, 2026-2036
- Figure 51: Western Europe Market Attractiveness Analysis by Booking Channel
- Figure 52: Eastern Europe Market Value Share and BPS Analysis by Country, 2026 and 2036
- Figure 53: Eastern Europe Market Value Share and BPS Analysis by Type, 2026 and 2036
- Figure 54: Eastern Europe Market Y-o-Y Growth Comparison by Type, 2026-2036
- Figure 55: Eastern Europe Market Attractiveness Analysis by Type
- Figure 56: Eastern Europe Market Value Share and BPS Analysis by Tourist Type, 2026 and 2036
- Figure 57: Eastern Europe Market Y-o-Y Growth Comparison by Tourist Type, 2026-2036
- Figure 58: Eastern Europe Market Attractiveness Analysis by Tourist Type
- Figure 59: Eastern Europe Market Value Share and BPS Analysis by Booking Channel, 2026 and 2036
- Figure 60: Eastern Europe Market Y-o-Y Growth Comparison by Booking Channel, 2026-2036
- Figure 61: Eastern Europe Market Attractiveness Analysis by Booking Channel
- Figure 62: East Asia Market Value Share and BPS Analysis by Country, 2026 and 2036
- Figure 63: East Asia Market Value Share and BPS Analysis by Type, 2026 and 2036
- Figure 64: East Asia Market Y-o-Y Growth Comparison by Type, 2026-2036
- Figure 65: East Asia Market Attractiveness Analysis by Type
- Figure 66: East Asia Market Value Share and BPS Analysis by Tourist Type, 2026 and 2036
- Figure 67: East Asia Market Y-o-Y Growth Comparison by Tourist Type, 2026-2036
- Figure 68: East Asia Market Attractiveness Analysis by Tourist Type
- Figure 69: East Asia Market Value Share and BPS Analysis by Booking Channel, 2026 and 2036
- Figure 70: East Asia Market Y-o-Y Growth Comparison by Booking Channel, 2026-2036
- Figure 71: East Asia Market Attractiveness Analysis by Booking Channel
- Figure 72: South Asia and Pacific Market Value Share and BPS Analysis by Country, 2026 and 2036
- Figure 73: South Asia and Pacific Market Value Share and BPS Analysis by Type, 2026 and 2036
- Figure 74: South Asia and Pacific Market Y-o-Y Growth Comparison by Type, 2026-2036
- Figure 75: South Asia and Pacific Market Attractiveness Analysis by Type
- Figure 76: South Asia and Pacific Market Value Share and BPS Analysis by Tourist Type, 2026 and 2036
- Figure 77: South Asia and Pacific Market Y-o-Y Growth Comparison by Tourist Type, 2026-2036
- Figure 78: South Asia and Pacific Market Attractiveness Analysis by Tourist Type
- Figure 79: South Asia and Pacific Market Value Share and BPS Analysis by Booking Channel, 2026 and 2036
- Figure 80: South Asia and Pacific Market Y-o-Y Growth Comparison by Booking Channel, 2026-2036
- Figure 81: South Asia and Pacific Market Attractiveness Analysis by Booking Channel
- Figure 82: Middle East and Africa Market Value Share and BPS Analysis by Country, 2026 and 2036
- Figure 83: Middle East and Africa Market Value Share and BPS Analysis by Type, 2026 and 2036
- Figure 84: Middle East and Africa Market Y-o-Y Growth Comparison by Type, 2026-2036
- Figure 85: Middle East and Africa Market Attractiveness Analysis by Type
- Figure 86: Middle East and Africa Market Value Share and BPS Analysis by Tourist Type, 2026 and 2036
- Figure 87: Middle East and Africa Market Y-o-Y Growth Comparison by Tourist Type, 2026-2036
- Figure 88: Middle East and Africa Market Attractiveness Analysis by Tourist Type
- Figure 89: Middle East and Africa Market Value Share and BPS Analysis by Booking Channel, 2026 and 2036
- Figure 90: Middle East and Africa Market Y-o-Y Growth Comparison by Booking Channel, 2026-2036
- Figure 91: Middle East and Africa Market Attractiveness Analysis by Booking Channel
- Figure 92: Global Market - Tier Structure Analysis
- Figure 93: Global Market - Company Share Analysis
Frequently Asked Questions
How large is the bicycle tourism market expected in 2026?
FMI puts the market at USD 126.2 million in 2026, up from USD 117.8 million in 2025, as signed routes and e-bikes draw more travellers into cycling holidays.
What CAGR is projected for the bicycle tourism market through 2036?
Sales are projected to grow at a 7.1% CAGR and reach USD 251.8 million by 2036, since riders keep moving from self-organised trips to packaged tours.
Which type holds a notable market share in 2026?
Leisure cycling leads with 62% of 2026 sales, given that easy daily stages suit travellers with modest fitness.
Which booking channel holds a notable market share in 2026?
Online platforms lead with about 72% of sales, as riders compare routes, bikes and luggage options in one place.
Which country has a notable expansion outlook through 2036?
Italy leads the FMI country outlook at an 8.2% CAGR, supported by new cycleways through wine and lake regions. Spain is next at 7.8%.
Who are the key companies in the bicycle tourism market?
Trek Travel, Butterfield & Robinson, Backroads and BikeTours.com are leading tour operators, and Komoot, Strava and Ride with GPS lead route platforms, since route data now steers trip choice.
Preview the report firsthand - request a free sample
Get SampleGet the brochure for pricing and purchase details.
Get PDF
