Reports

- Global Locations -

Headquarters

Future Market Insights, Inc.

Christiana Corporate, 200
Continental Drive, Suite 401,
Newark, Delaware - 19713,
United States

T: +1-347-918-3531

Americas

Future Market Insights, Inc.

616 Corporate Way, Suite 2-9018,
Valley Cottage, NY 10989, United States

MEA

Future Market Insights

1602-6 Jumeirah Bay X2 Tower, Plot No: JLT-PH2-X2A,
Jumeirah Lakes Towers, Dubai,
United Arab Emirates

Europe

Future Market Insights

3rd Floor, 207 Regent Street,
W1B 3HH London
United Kingdom

T: + 44 (0) 20 8123 9659

Asia Pacific

Future Market Insights

IndiaLand Global Tech Park, Unit UG-1, Behind Grand HighStreet, Phase 1, Hinjawadi, MH, Pune – 411057, India

Analytical Study of Bicycle Component Aftermarket Landscape in Korea from 2024 to 2034

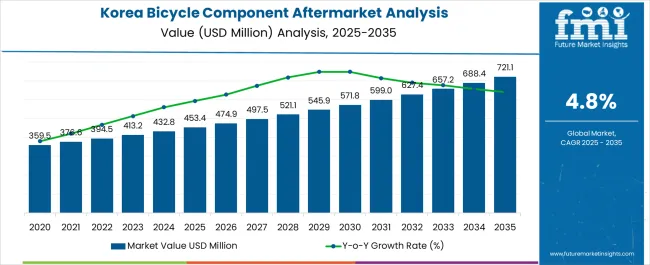
The bicycle component aftermarket in Korea is poised to expand at a CAGR of 5.0% from 2024 to 2034. The aftermarket in Korea is standing at the threshold of significant prospects, starting with a valuation of US$ 431.8 million in 2024.

Attributes Details
Size in 2024 US$ 431.8 million
Expected Size in 2034 US$ 703.3 million
Forecasted CAGR from 2024 to 2034 5.0%

Integration of smart technologies into bicycle components, such as GPS tracking, smart lighting, and electronic gear shifting systems, is expected be a growing trend. The scope for the bicycle component aftermarket in Korea is likely to translate into a valuation of US$ 703.3 million by 2034.

Don't pay for what you don't need

Customize your report by selecting specific countries or regions and save 30%!

Key Insights-Highlights to Understand Emerging and Fast Growing Opportunities

  • A cultural shift towards healthier and more active lifestyles may encourage people to adopt cycling as a recreational activity, driving the demand for high quality bicycle components.
  • Government backed or private bike sharing initiatives can introduce more people to cycling, potentially increasing the overall demand for bicycles and their components.
  • Growing concerns about environmental pollution and traffic congestion may lead individuals to choose cycling as a safer and more sustainable mode of transportation.
  • The hosting of cycling events and competitions can stimulate interest in the sport, attracting enthusiasts who may invest in upgrading their bicycles with advanced components.

Key Trends Influencing Demand for Bicycle Component Aftermarket in Korea

  • The growing interest in fitness and outdoor activities is expected to lead to an increased demand for bicycles and their components.
  • Government initiatives promoting a healthy lifestyle and environmental sustainability are anticipated to boost cycling as an alternative mode of transportation.
  • Advancements in bicycle technology, including lightweight materials, aerodynamics, and electronic components, are expected to attract consumers looking for high performance and modern features.
  • Government support for cycling infrastructure, such as bike lanes and parking facilities, can encourage more people to take up cycling, thereby driving the demand for bicycle components.
Nikhil Kaitwade
Nikhil Kaitwade

Principal Consultant

Talk to Analyst

Find your sweet spots for generating winning opportunities in this market.

Comparative View of Adjacent Bicycle Component Aftermarket in Key Regions

The provided table offers a comparative overview of bicycle component aftermarket and their respective adoption rates in three key sections including Korea, Western Europe, and Japan.

The growing awareness of health and wellness is expected to contribute to an increased interest in cycling as a form of exercise, driving the demand for high quality components.

Analysis of Bicycle Component Aftermarket in Korea:

Attributes Analysis of Bicycle Component Aftermarket in Korea
CAGR from 2024 to 2034 5.0%
Size in 2024 US$ 431.8 million
Key Trend The rise of e-commerce platforms makes it easier for consumers to access a wide range of bicycle components, contributing to the growth of aftermarket.
Key Challenge Inadequate or underdeveloped cycling infrastructure, including bike lanes and parking facilities, can discourage people from using bicycles, impacting the overall demand for bicycle components.

Demand for Bicycle Component in Western Europe:

Attributes Demand for Bicycle Component in Western Europe
CAGR from 2024 to 2034 6.2%
Size in 2024 US$ 4,902.8 million
Key Trend Supportive government policies, subsidies, and investments in cycling infrastructure, such as dedicated bike lanes and bike sharing programs, encourage more people to take up cycling and drive the demand for bicycle components.
Key Challenge The initial cost of purchasing high quality bicycles and components can be relatively high. Economic uncertainties or consumer budget constraints may hinder the willingness to invest in premium components.

Analysis of Bicycle Component Aftermarket in Japan:

Attributes Analysis of Bicycle Component Aftermarket in Japan
CAGR from 2024 to 2034 5.4%
Size in 2024 US$ 816.1 million
Key Trend Japan has a strong cultural tradition of cycling, with bicycles being a popular mode of transportation. The cultural acceptance is a significant factor driving the demand for bicycle components.
Key Challenge Japan has a well developed and efficient public transportation system, and there may be a preference for motorized options over cycling, especially for daily commuting.

Category-wise insights

Road Groupsets Segment to Fuel the Growth in Korea

Road cyclists place a strong emphasis on performance and efficiency. Upgrading to higher quality road groupsets can significantly improve an overall performance of a bike, including smoother gear shifting and enhanced power transfer.

Bicycle Component Aftermarket in Korea based on Component Road Groupsets
Share in % in 2024 57.9%

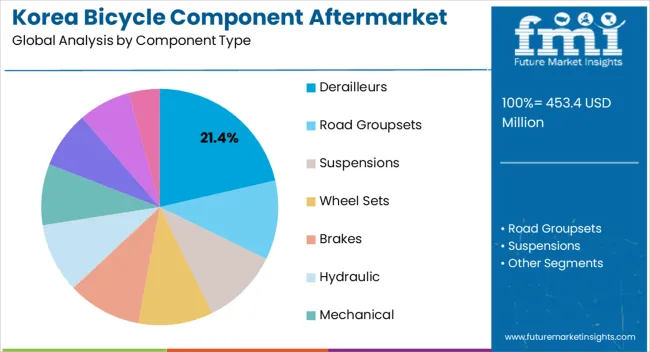
In terms of component, the road groupsets segment is expected to account for a share of 57.9% in 2024. The popularity of road cycling as a sport and recreational activity is a major factor driving the demand for road groupsets. Enthusiasts and amateur cyclists often prefer specialized components designed for road biking.

The interest in competitive cycling events and road races contributes to the demand for high performance components, including road groupsets, as participants seek to enhance their bikes for better performance.

Ongoing innovations in road bike technology, including lightweight materials, aerodynamics, and advanced gear systems, drive the demand for upgraded road groupsets among cyclists looking for cutting edge features.

Departmental Store Segment Splashes Reach High as Compared to Other Channels

Major departmental stores often carry products from well known and reputable brands. The presence of established brands enhances the visibility of bicycle components and instills confidence in consumers regarding product quality.

Bicycle Component Aftermarket in Korea based on Sales Channel Departmental Store
Share in % in 2024 34.2%

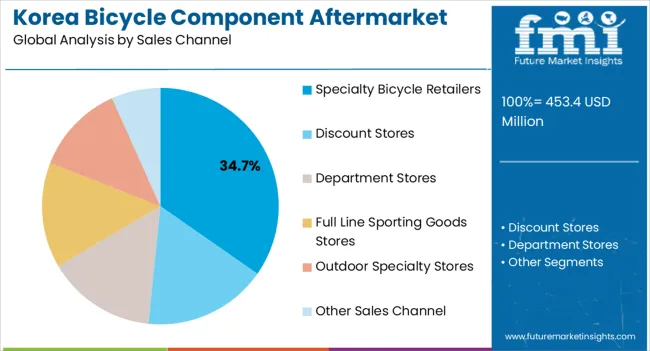
Based on sales channel, the departmental store segment is expected to account for a share of 34.2% in 2024. Departmental stores often offer a diverse range of products under one roof. The availability of a wide variety of bicycle components in a single location provides consumers with convenience and choice.

Departmental stores typically provide customer service and expert advice. Knowledgeable staff can assist customers in selecting the right bicycle components based on their needs, contributing to a positive shopping experience.

Consumers often prefer a one stop shopping experience where they can find everything they need for their bicycles in a single location. Departmental stores offering a comprehensive options of components meet this demand.

Get the data you need at a Fraction of the cost

Personalize your report by choosing insights you need
and save 40%!

Province-wise Insights

Infrastructure Development to Boost the Aftermarket in the South Gyeongsang

Supportive government policies and investments in cycling infrastructure, such as dedicated bike lanes and parking facilities, can encourage the use of bicycles, thereby boosting the demand for bicycle components.

Efforts to promote cycling as a part of a healthy and active lifestyle can increase the popularity of cycling, leading to higher demand for bicycles and their components. Increasing urbanization and efforts to address traffic congestion can lead to a rise in cycling for daily commuting. The trend can drive the demand for bicycles and associated components.

Health and Wellness Trends in North Jeolla to Enhance the Bicycle Component Aftermarket Landscape

The increasing emphasis on health and wellness can drive the demand for recreational activities such as cycling. Consumers looking for fitness related activities may invest in bicycles and their components. A growing interest in outdoor recreational activities can boost the aftermarket. The natural landscapes and scenic areas of North Jeolla are expected to attract individuals looking for outdoor adventures, including cycling.

Collaborating with or sponsoring local and regional cycling events, races, or competitions can enhance brand visibility and stimulate interest in cycling, driving the demand for components. The growth of e-commerce platforms can provide consumers in North Jeolla with convenient access to a wide range of bicycle components, expanding the aftermarket reach.

Educational Initiatives in Jeju to Accelerate the Ecosystem

Collaborating with or sponsoring local and regional cycling events, races, or competitions can enhance brand visibility and stimulate interest in cycling, driving the demand for components. Economic growth in the province, coupled with rising disposable income, can increase ability of consumers to invest in recreational activities like cycling, including the purchase of quality bicycle components.

Educational programs that promote the benefits of cycling, proper maintenance, and the importance of quality components can contribute to a more informed and discerning consumer base. Establishing partnerships with local bike shops can enhance distribution channels and provide consumers in Jeju with convenient access to a variety of bicycle components.
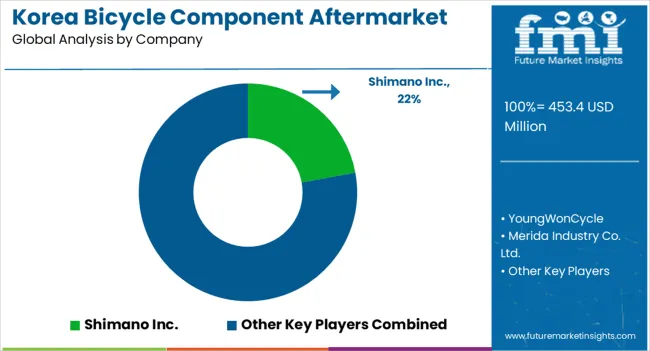
Competitive Landscape

The bicycle components aftermarket in Korea is characterized by a dynamic and competitive landscape driven by factors such as a strong cycling culture, increasing interest in recreational and competitive cycling, and government initiatives to promote sustainable transportation. Korea has a growing community of cycling enthusiasts, and this has contributed to the demand for high quality bicycle components.

Company Portfolio in Bicycle Component Aftermarket in Korea

  • Shimano is one of the leading players in the bicycle components aftermarket worldwide. In recent years, Shimano has introduced various advancements in their product range for South Korea.
  • SRAM is another major player in the bicycle components aftermarket in Korea. The company has been focusing on expanding their product portfolio.

Some of the Key Players with Bicycle Component Aftermarket in Korea

  • YoungWonCycle
  • Shimano Inc.
  • Merida Industry Co. Ltd.
  • Dorel Industries Inc.
  • Accell Group N.V.
  • Shimano Inc.
  • SRAM LLC
  • Hero Cycles Limited
  • Giant Manufacturing Co. Ltd.
  • Avon Cycles Ltd.

Scope of the Report

Attribute Details
Estimated Aftermarket Size in 2024 US$ 431.8 million
Projected Aftermarket Size in 2034 US$ 703.3 million
Anticipated CAGR from 2024 to 2034 5.0%
Historical Analysis of Demand for Bicycle Component Aftermarket in Korea 2019 to 2023
Demand Forecast for Bicycle Component Aftermarket in Korea 2024 to 2034
Report Coverage Aftermarket Size, Aftermarket Trends, Analysis of key factors influencing Bicycle Component Aftermarket adoption in Korea, Insights on Global Players and their Aftermarket Strategy in Korea, Ecosystem Analysis of Providers in Korea
Key Provinces Analyzed while Studying Opportunities in Bicycle Component Aftermarket in Korea
  • South Gyeongsang
  • North Jeolla
  • South Jeolla
  • Jeju
Key Companies Profiled
  • YoungWonCycle
  • Shimano Inc.
  • Merida Industry Co. Ltd.
  • Dorel Industries Inc.
  • Accell Group N.V.
  • Shimano Inc.
  • SRAM LLC
  • Hero Cycles Limited
  • Giant Manufacturing Co. Ltd.
  • Avon Cycles Ltd.

Key Segments

By Component Type:

  • Derailleurs
  • Road Groupsets
  • Suspensions
  • Wheel Sets
  • Brakes
    • Hydraulic
    • Mechanical
  • Caliper Type
  • Gears
  • Others (Bottom Brackets etc.)

By Sales Channel:

  • Specialty Bicycle Retailers
  • Discount Stores
  • Department Stores
  • Full Line Sporting Goods Stores
  • Outdoor Specialty Stores
  • Other Sales Channel

By Bicycle Type:

  • Mountain Bike
  • Hybrid/Cross
  • Road
  • Comfort
  • Youth
  • Cruiser
  • Recumbent/Tandem
  • Electric
  • Folding

By Province:

  • South Gyeongsang
  • North Jeolla
  • South Jeolla
  • Jeju

Frequently Asked Questions

What is the expected size of the Bicycle Component Aftermarket in Korea?

The bicycle component aftermarket in Korea is to be valued at US$ 431.8 million by 2024.

At what Rate is the Bicycle Component Aftermarket expected to rise in Korea?

The bicycle component aftermarket in Korea is anticipated to incline at a CAGR of 5.0% from 2024 to 2034.

What is the anticipated value of the Bicycle Component Aftermarket Landscape in Korea in 2034?

The bicycle component aftermarket in Korea is expected to reach US$ 703.3 million by 2034.

Which component category for Bicycles is an opportunistic Aftermarket in Korea?

The bicycle component aftermarket for road groupsets is opportunistic, comprising 57.9% of the total share in 2024.

Table of Content

1. Executive Summary

    1.1. Market Outlook

    1.2. Demand-side Trends

    1.3. Supply-side Trends

    1.4. Technology Roadmap Analysis

    1.5. Analysis and Recommendations

2. Market Overview

    2.1. Market Coverage / Taxonomy

    2.2. Market Definition / Scope / Limitations

3. Market Background

    3.1. Market Dynamics

        3.1.1. Drivers

        3.1.2. Restraints

        3.1.3. Opportunity

        3.1.4. Trends

    3.2. Scenario Forecast

        3.2.1. Demand in Optimistic Scenario

        3.2.2. Demand in Likely Scenario

        3.2.3. Demand in Conservative Scenario

    3.3. Opportunity Map Analysis

    3.4. Product Life Cycle Analysis

    3.5. Supply Chain Analysis

        3.5.1. Supply Side Participants and their Roles

            3.5.1.1. Producers

            3.5.1.2. Mid-Level Participants (Traders/ Agents/ Brokers)

            3.5.1.3. Wholesalers and Distributors

        3.5.2. Value Added and Value Created at Node in the Supply Chain

        3.5.3. List of Raw Material Suppliers

        3.5.4. List of Existing and Potential Buyer’s

    3.6. Investment Feasibility Matrix

    3.7. Value Chain Analysis

        3.7.1. Profit Margin Analysis

        3.7.2. Wholesalers and Distributors

        3.7.3. Retailers

    3.8. PESTLE and Porter’s Analysis

    3.9. Regulatory Landscape

        3.9.1. By Key Regions

    3.10. Regional Parent Market Outlook

    3.11. Production and Consumption Statistics

    3.12. Import and Export Statistics

4. Industry Analysis and Outlook 2019 to 2023 and Forecast, 2024 to 2034

    4.1. Historical Market Size Value (US$ Million) & Volume (Units) Analysis, 2019 to 2023

    4.2. Current and Future Market Size Value (US$ Million) & Volume (Units) Projections, 2024 to 2034

        4.2.1. Y-o-Y Growth Trend Analysis

        4.2.2. Absolute $ Opportunity Analysis

5. Industry Analysis and Outlook 2019 to 2023 and Forecast 2024 to 2034, By Component Type

    5.1. Introduction / Key Findings

    5.2. Historical Market Size Value (US$ Million) & Volume (Units) Analysis By Component Type, 2019 to 2023

    5.3. Current and Future Market Size Value (US$ Million) & Volume (Units) Analysis and Forecast By Component Type, 2024 to 2034

        5.3.1. Derailleurs

        5.3.2. Road Group sets

        5.3.3. Suspensions

        5.3.4. Wheel Sets

        5.3.5. Brakes

            5.3.5.1. Hydraulic

            5.3.5.2. Mechanical

        5.3.6. Calliper Type

        5.3.7. Gears

        5.3.8. Others (Bottom Brackets etc.)

    5.4. Y-o-Y Growth Trend Analysis By Component Type, 2019 to 2023

    5.5. Absolute $ Opportunity Analysis By Component Type, 2024 to 2034

6. Industry Analysis and Outlook 2019 to 2023 and Forecast 2024 to 2034, By Sales Channel

    6.1. Introduction / Key Findings

    6.2. Historical Market Size Value (US$ Million) & Volume (Units) Analysis By Sales Channel, 2019 to 2023

    6.3. Current and Future Market Size Value (US$ Million) & Volume (Units) Analysis and Forecast By Sales Channel, 2024 to 2034

        6.3.1. Specialty Bicycle Retailers

        6.3.2. Discount Stores

        6.3.3. Department Stores

        6.3.4. Full-line Sporting Goods Stores

        6.3.5. Outdoor Specialty Stores

        6.3.6. Other Sales Channel

    6.4. Y-o-Y Growth Trend Analysis By Sales Channel, 2019 to 2023

    6.5. Absolute $ Opportunity Analysis By Sales Channel, 2024 to 2034

7. Industry Analysis and Outlook 2019 to 2023 and Forecast 2024 to 2034, By Bicycle Type

    7.1. Introduction / Key Findings

    7.2. Historical Market Size Value (US$ Million) & Volume (Units) Analysis By Bicycle Type, 2019 to 2023

    7.3. Current and Future Market Size Value (US$ Million) & Volume (Units) Analysis and Forecast By Bicycle Type, 2024 to 2034

        7.3.1. Mountain Bike

        7.3.2. Hybrid/Cross

        7.3.3. Road

        7.3.4. Comfort

        7.3.5. Youth

        7.3.6. Cruiser

        7.3.7. Recumbent/Tandem

        7.3.8. Electric

        7.3.9. Folding

    7.4. Y-o-Y Growth Trend Analysis By Bicycle Type, 2019 to 2023

    7.5. Absolute $ Opportunity Analysis By Bicycle Type, 2024 to 2034

8. Industry Analysis and Outlook 2019 to 2023 and Forecast 2024 to 2034, By Region

    8.1. Introduction

    8.2. Historical Market Size Value (US$ Million) & Volume (Units) Analysis By Region, 2019 to 2023

    8.3. Current Market Size Value (US$ Million) & Volume (Units) Analysis and Forecast By Region, 2024 to 2034

        8.3.1. South Gyeongsang

        8.3.2. North Jeolla

        8.3.3. South Jeolla

        8.3.4. Jeju

        8.3.5. Rest of Korea

    8.4. Market Attractiveness Analysis By Region

9. South Gyeongsang Industry Analysis and Outlook 2019 to 2023 and Forecast 2024 to 2034

    9.1. Historical Market Size Value (US$ Million) & Volume (Units) Trend Analysis By Market Taxonomy, 2019 to 2023

    9.2. Market Size Value (US$ Million) & Volume (Units) Forecast By Market Taxonomy, 2024 to 2034

        9.2.1. By Component Type

        9.2.2. By Sales Channel

        9.2.3. By Bicycle Type

    9.3. Market Attractiveness Analysis

        9.3.1. By Component Type

        9.3.2. By Sales Channel

        9.3.3. By Bicycle Type

    9.4. Key Takeaways

10. North Jeolla Industry Analysis and Outlook 2019 to 2023 and Forecast 2024 to 2034

    10.1. Historical Market Size Value (US$ Million) & Volume (Units) Trend Analysis By Market Taxonomy, 2019 to 2023

    10.2. Market Size Value (US$ Million) & Volume (Units) Forecast By Market Taxonomy, 2024 to 2034

        10.2.1. By Component Type

        10.2.2. By Sales Channel

        10.2.3. By Bicycle Type

    10.3. Market Attractiveness Analysis

        10.3.1. By Component Type

        10.3.2. By Sales Channel

        10.3.3. By Bicycle Type

    10.4. Key Takeaways

11. South Jeolla Industry Analysis and Outlook 2019 to 2023 and Forecast 2024 to 2034

    11.1. Historical Market Size Value (US$ Million) & Volume (Units) Trend Analysis By Market Taxonomy, 2019 to 2023

    11.2. Market Size Value (US$ Million) & Volume (Units) Forecast By Market Taxonomy, 2024 to 2034

        11.2.1. By Component Type

        11.2.2. By Sales Channel

        11.2.3. By Bicycle Type

    11.3. Market Attractiveness Analysis

        11.3.1. By Component Type

        11.3.2. By Sales Channel

        11.3.3. By Bicycle Type

    11.4. Key Takeaways

12. Jeju Industry Analysis and Outlook 2019 to 2023 and Forecast 2024 to 2034

    12.1. Historical Market Size Value (US$ Million) & Volume (Units) Trend Analysis By Market Taxonomy, 2019 to 2023

    12.2. Market Size Value (US$ Million) & Volume (Units) Forecast By Market Taxonomy, 2024 to 2034

        12.2.1. By Component Type

        12.2.2. By Sales Channel

        12.2.3. By Bicycle Type

    12.3. Market Attractiveness Analysis

        12.3.1. By Component Type

        12.3.2. By Sales Channel

        12.3.3. By Bicycle Type

    12.4. Key Takeaways

13. Rest of Industry Analysis and Outlook 2019 to 2023 and Forecast 2024 to 2034

    13.1. Historical Market Size Value (US$ Million) & Volume (Units) Trend Analysis By Market Taxonomy, 2019 to 2023

    13.2. Market Size Value (US$ Million) & Volume (Units) Forecast By Market Taxonomy, 2024 to 2034

        13.2.1. By Component Type

        13.2.2. By Sales Channel

        13.2.3. By Bicycle Type

    13.3. Market Attractiveness Analysis

        13.3.1. By Component Type

        13.3.2. By Sales Channel

        13.3.3. By Bicycle Type

    13.4. Key Takeaways

14. Market Structure Analysis

    14.1. Competition Dashboard

    14.2. Competition Benchmarking

    14.3. Market Share Analysis of Top Players

        14.3.1. By Regional

        14.3.2. By Component Type

        14.3.3. By Sales Channel

        14.3.4. By Bicycle Type

15. Competition Analysis

    15.1. Competition Deep Dive

        15.1.1. YoungWonCycle

            15.1.1.1. Overview

            15.1.1.2. Product Portfolio

            15.1.1.3. Profitability by Market Segments

            15.1.1.4. Sales Footprint

            15.1.1.5. Strategy Overview

                15.1.1.5.1. Marketing Strategy

                15.1.1.5.2. Product Strategy

                15.1.1.5.3. Channel Strategy

        15.1.2. Shimano Inc.

            15.1.2.1. Overview

            15.1.2.2. Product Portfolio

            15.1.2.3. Profitability by Market Segments

            15.1.2.4. Sales Footprint

            15.1.2.5. Strategy Overview

                15.1.2.5.1. Marketing Strategy

                15.1.2.5.2. Product Strategy

                15.1.2.5.3. Channel Strategy

        15.1.3. Merida Industry Co. Ltd.

            15.1.3.1. Overview

            15.1.3.2. Product Portfolio

            15.1.3.3. Profitability by Market Segments

            15.1.3.4. Sales Footprint

            15.1.3.5. Strategy Overview

                15.1.3.5.1. Marketing Strategy

                15.1.3.5.2. Product Strategy

                15.1.3.5.3. Channel Strategy

        15.1.4. Dorel Industries Inc

            15.1.4.1. Overview

            15.1.4.2. Product Portfolio

            15.1.4.3. Profitability by Market Segments

            15.1.4.4. Sales Footprint

            15.1.4.5. Strategy Overview

                15.1.4.5.1. Marketing Strategy

                15.1.4.5.2. Product Strategy

                15.1.4.5.3. Channel Strategy

        15.1.5. Accell Group N.V.

            15.1.5.1. Overview

            15.1.5.2. Product Portfolio

            15.1.5.3. Profitability by Market Segments

            15.1.5.4. Sales Footprint

            15.1.5.5. Strategy Overview

                15.1.5.5.1. Marketing Strategy

                15.1.5.5.2. Product Strategy

                15.1.5.5.3. Channel Strategy

        15.1.6. Shimano Inc.

            15.1.6.1. Overview

            15.1.6.2. Product Portfolio

            15.1.6.3. Profitability by Market Segments

            15.1.6.4. Sales Footprint

            15.1.6.5. Strategy Overview

                15.1.6.5.1. Marketing Strategy

                15.1.6.5.2. Product Strategy

                15.1.6.5.3. Channel Strategy

        15.1.7. SRAM LLC

            15.1.7.1. Overview

            15.1.7.2. Product Portfolio

            15.1.7.3. Profitability by Market Segments

            15.1.7.4. Sales Footprint

            15.1.7.5. Strategy Overview

                15.1.7.5.1. Marketing Strategy

                15.1.7.5.2. Product Strategy

                15.1.7.5.3. Channel Strategy

        15.1.8. Hero Cycles Limited

            15.1.8.1. Overview

            15.1.8.2. Product Portfolio

            15.1.8.3. Profitability by Market Segments

            15.1.8.4. Sales Footprint

            15.1.8.5. Strategy Overview

                15.1.8.5.1. Marketing Strategy

                15.1.8.5.2. Product Strategy

                15.1.8.5.3. Channel Strategy

        15.1.9. Giant Manufacturing Co. Ltd.

            15.1.9.1. Overview

            15.1.9.2. Product Portfolio

            15.1.9.3. Profitability by Market Segments

            15.1.9.4. Sales Footprint

            15.1.9.5. Strategy Overview

                15.1.9.5.1. Marketing Strategy

                15.1.9.5.2. Product Strategy

                15.1.9.5.3. Channel Strategy

        15.1.10. Avon Cycles Ltd.

            15.1.10.1. Overview

            15.1.10.2. Product Portfolio

            15.1.10.3. Profitability by Market Segments

            15.1.10.4. Sales Footprint

            15.1.10.5. Strategy Overview

                15.1.10.5.1. Marketing Strategy

                15.1.10.5.2. Product Strategy

                15.1.10.5.3. Channel Strategy

16. Assumptions & Acronyms Used

17. Research Methodology

List of Tables

Table 1: Industry Analysis and Outlook Value (US$ Million) Forecast by Region, 2019 to 2034

Table 2: Industry Analysis and Outlook Volume (Units) Forecast by Region, 2019 to 2034

Table 3: Industry Analysis and Outlook Value (US$ Million) Forecast by Component Type, 2019 to 2034

Table 4: Industry Analysis and Outlook Volume (Units) Forecast by Component Type, 2019 to 2034

Table 5: Industry Analysis and Outlook Value (US$ Million) Forecast by Sales Channel, 2019 to 2034

Table 6: Industry Analysis and Outlook Volume (Units) Forecast by Sales Channel, 2019 to 2034

Table 7: Industry Analysis and Outlook Value (US$ Million) Forecast by Bicycle Type, 2019 to 2034

Table 8: Industry Analysis and Outlook Volume (Units) Forecast by Bicycle Type, 2019 to 2034

Table 9: South Gyeongsang Industry Analysis and Outlook Value (US$ Million) Forecast by Component Type, 2019 to 2034

Table 10: South Gyeongsang Industry Analysis and Outlook Volume (Units) Forecast by Component Type, 2019 to 2034

Table 11: South Gyeongsang Industry Analysis and Outlook Value (US$ Million) Forecast by Sales Channel, 2019 to 2034

Table 12: South Gyeongsang Industry Analysis and Outlook Volume (Units) Forecast by Sales Channel, 2019 to 2034

Table 13: South Gyeongsang Industry Analysis and Outlook Value (US$ Million) Forecast by Bicycle Type, 2019 to 2034

Table 14: South Gyeongsang Industry Analysis and Outlook Volume (Units) Forecast by Bicycle Type, 2019 to 2034

Table 15: North Jeolla Industry Analysis and Outlook Value (US$ Million) Forecast by Component Type, 2019 to 2034

Table 16: North Jeolla Industry Analysis and Outlook Volume (Units) Forecast by Component Type, 2019 to 2034

Table 17: North Jeolla Industry Analysis and Outlook Value (US$ Million) Forecast by Sales Channel, 2019 to 2034

Table 18: North Jeolla Industry Analysis and Outlook Volume (Units) Forecast by Sales Channel, 2019 to 2034

Table 19: North Jeolla Industry Analysis and Outlook Value (US$ Million) Forecast by Bicycle Type, 2019 to 2034

Table 20: North Jeolla Industry Analysis and Outlook Volume (Units) Forecast by Bicycle Type, 2019 to 2034

Table 21: South Jeolla Industry Analysis and Outlook Value (US$ Million) Forecast by Component Type, 2019 to 2034

Table 22: South Jeolla Industry Analysis and Outlook Volume (Units) Forecast by Component Type, 2019 to 2034

Table 23: South Jeolla Industry Analysis and Outlook Value (US$ Million) Forecast by Sales Channel, 2019 to 2034

Table 24: South Jeolla Industry Analysis and Outlook Volume (Units) Forecast by Sales Channel, 2019 to 2034

Table 25: South Jeolla Industry Analysis and Outlook Value (US$ Million) Forecast by Bicycle Type, 2019 to 2034

Table 26: South Jeolla Industry Analysis and Outlook Volume (Units) Forecast by Bicycle Type, 2019 to 2034

Table 27: Jeju Industry Analysis and Outlook Value (US$ Million) Forecast by Component Type, 2019 to 2034

Table 28: Jeju Industry Analysis and Outlook Volume (Units) Forecast by Component Type, 2019 to 2034

Table 29: Jeju Industry Analysis and Outlook Value (US$ Million) Forecast by Sales Channel, 2019 to 2034

Table 30: Jeju Industry Analysis and Outlook Volume (Units) Forecast by Sales Channel, 2019 to 2034

Table 31: Jeju Industry Analysis and Outlook Value (US$ Million) Forecast by Bicycle Type, 2019 to 2034

Table 32: Jeju Industry Analysis and Outlook Volume (Units) Forecast by Bicycle Type, 2019 to 2034

Table 33: Rest of Industry Analysis and Outlook Value (US$ Million) Forecast by Component Type, 2019 to 2034

Table 34: Rest of Industry Analysis and Outlook Volume (Units) Forecast by Component Type, 2019 to 2034

Table 35: Rest of Industry Analysis and Outlook Value (US$ Million) Forecast by Sales Channel, 2019 to 2034

Table 36: Rest of Industry Analysis and Outlook Volume (Units) Forecast by Sales Channel, 2019 to 2034

Table 37: Rest of Industry Analysis and Outlook Value (US$ Million) Forecast by Bicycle Type, 2019 to 2034

Table 38: Rest of Industry Analysis and Outlook Volume (Units) Forecast by Bicycle Type, 2019 to 2034

List of Charts

Figure 1: Industry Analysis and Outlook Value (US$ Million) by Component Type, 2024 to 2034

Figure 2: Industry Analysis and Outlook Value (US$ Million) by Sales Channel, 2024 to 2034

Figure 3: Industry Analysis and Outlook Value (US$ Million) by Bicycle Type, 2024 to 2034

Figure 4: Industry Analysis and Outlook Value (US$ Million) by Region, 2024 to 2034

Figure 5: Industry Analysis and Outlook Value (US$ Million) Analysis by Region, 2019 to 2034

Figure 6: Industry Analysis and Outlook Volume (Units) Analysis by Region, 2019 to 2034

Figure 7: Industry Analysis and Outlook Value Share (%) and BPS Analysis by Region, 2024 to 2034

Figure 8: Industry Analysis and Outlook Y-o-Y Growth (%) Projections by Region, 2024 to 2034

Figure 9: Industry Analysis and Outlook Value (US$ Million) Analysis by Component Type, 2019 to 2034

Figure 10: Industry Analysis and Outlook Volume (Units) Analysis by Component Type, 2019 to 2034

Figure 11: Industry Analysis and Outlook Value Share (%) and BPS Analysis by Component Type, 2024 to 2034

Figure 12: Industry Analysis and Outlook Y-o-Y Growth (%) Projections by Component Type, 2024 to 2034

Figure 13: Industry Analysis and Outlook Value (US$ Million) Analysis by Sales Channel, 2019 to 2034

Figure 14: Industry Analysis and Outlook Volume (Units) Analysis by Sales Channel, 2019 to 2034

Figure 15: Industry Analysis and Outlook Value Share (%) and BPS Analysis by Sales Channel, 2024 to 2034

Figure 16: Industry Analysis and Outlook Y-o-Y Growth (%) Projections by Sales Channel, 2024 to 2034

Figure 17: Industry Analysis and Outlook Value (US$ Million) Analysis by Bicycle Type, 2019 to 2034

Figure 18: Industry Analysis and Outlook Volume (Units) Analysis by Bicycle Type, 2019 to 2034

Figure 19: Industry Analysis and Outlook Value Share (%) and BPS Analysis by Bicycle Type, 2024 to 2034

Figure 20: Industry Analysis and Outlook Y-o-Y Growth (%) Projections by Bicycle Type, 2024 to 2034

Figure 21: Industry Analysis and Outlook Attractiveness by Component Type, 2024 to 2034

Figure 22: Industry Analysis and Outlook Attractiveness by Sales Channel, 2024 to 2034

Figure 23: Industry Analysis and Outlook Attractiveness by Bicycle Type, 2024 to 2034

Figure 24: Industry Analysis and Outlook Attractiveness by Region, 2024 to 2034

Figure 25: South Gyeongsang Industry Analysis and Outlook Value (US$ Million) by Component Type, 2024 to 2034

Figure 26: South Gyeongsang Industry Analysis and Outlook Value (US$ Million) by Sales Channel, 2024 to 2034

Figure 27: South Gyeongsang Industry Analysis and Outlook Value (US$ Million) by Bicycle Type, 2024 to 2034

Figure 28: South Gyeongsang Industry Analysis and Outlook Value (US$ Million) Analysis by Component Type, 2019 to 2034

Figure 29: South Gyeongsang Industry Analysis and Outlook Volume (Units) Analysis by Component Type, 2019 to 2034

Figure 30: South Gyeongsang Industry Analysis and Outlook Value Share (%) and BPS Analysis by Component Type, 2024 to 2034

Figure 31: South Gyeongsang Industry Analysis and Outlook Y-o-Y Growth (%) Projections by Component Type, 2024 to 2034

Figure 32: South Gyeongsang Industry Analysis and Outlook Value (US$ Million) Analysis by Sales Channel, 2019 to 2034

Figure 33: South Gyeongsang Industry Analysis and Outlook Volume (Units) Analysis by Sales Channel, 2019 to 2034

Figure 34: South Gyeongsang Industry Analysis and Outlook Value Share (%) and BPS Analysis by Sales Channel, 2024 to 2034

Figure 35: South Gyeongsang Industry Analysis and Outlook Y-o-Y Growth (%) Projections by Sales Channel, 2024 to 2034

Figure 36: South Gyeongsang Industry Analysis and Outlook Value (US$ Million) Analysis by Bicycle Type, 2019 to 2034

Figure 37: South Gyeongsang Industry Analysis and Outlook Volume (Units) Analysis by Bicycle Type, 2019 to 2034

Figure 38: South Gyeongsang Industry Analysis and Outlook Value Share (%) and BPS Analysis by Bicycle Type, 2024 to 2034

Figure 39: South Gyeongsang Industry Analysis and Outlook Y-o-Y Growth (%) Projections by Bicycle Type, 2024 to 2034

Figure 40: South Gyeongsang Industry Analysis and Outlook Attractiveness by Component Type, 2024 to 2034

Figure 41: South Gyeongsang Industry Analysis and Outlook Attractiveness by Sales Channel, 2024 to 2034

Figure 42: South Gyeongsang Industry Analysis and Outlook Attractiveness by Bicycle Type, 2024 to 2034

Figure 43: North Jeolla Industry Analysis and Outlook Value (US$ Million) by Component Type, 2024 to 2034

Figure 44: North Jeolla Industry Analysis and Outlook Value (US$ Million) by Sales Channel, 2024 to 2034

Figure 45: North Jeolla Industry Analysis and Outlook Value (US$ Million) by Bicycle Type, 2024 to 2034

Figure 46: North Jeolla Industry Analysis and Outlook Value (US$ Million) Analysis by Component Type, 2019 to 2034

Figure 47: North Jeolla Industry Analysis and Outlook Volume (Units) Analysis by Component Type, 2019 to 2034

Figure 48: North Jeolla Industry Analysis and Outlook Value Share (%) and BPS Analysis by Component Type, 2024 to 2034

Figure 49: North Jeolla Industry Analysis and Outlook Y-o-Y Growth (%) Projections by Component Type, 2024 to 2034

Figure 50: North Jeolla Industry Analysis and Outlook Value (US$ Million) Analysis by Sales Channel, 2019 to 2034

Figure 51: North Jeolla Industry Analysis and Outlook Volume (Units) Analysis by Sales Channel, 2019 to 2034

Figure 52: North Jeolla Industry Analysis and Outlook Value Share (%) and BPS Analysis by Sales Channel, 2024 to 2034

Figure 53: North Jeolla Industry Analysis and Outlook Y-o-Y Growth (%) Projections by Sales Channel, 2024 to 2034

Figure 54: North Jeolla Industry Analysis and Outlook Value (US$ Million) Analysis by Bicycle Type, 2019 to 2034

Figure 55: North Jeolla Industry Analysis and Outlook Volume (Units) Analysis by Bicycle Type, 2019 to 2034

Figure 56: North Jeolla Industry Analysis and Outlook Value Share (%) and BPS Analysis by Bicycle Type, 2024 to 2034

Figure 57: North Jeolla Industry Analysis and Outlook Y-o-Y Growth (%) Projections by Bicycle Type, 2024 to 2034

Figure 58: North Jeolla Industry Analysis and Outlook Attractiveness by Component Type, 2024 to 2034

Figure 59: North Jeolla Industry Analysis and Outlook Attractiveness by Sales Channel, 2024 to 2034

Figure 60: North Jeolla Industry Analysis and Outlook Attractiveness by Bicycle Type, 2024 to 2034

Figure 61: South Jeolla Industry Analysis and Outlook Value (US$ Million) by Component Type, 2024 to 2034

Figure 62: South Jeolla Industry Analysis and Outlook Value (US$ Million) by Sales Channel, 2024 to 2034

Figure 63: South Jeolla Industry Analysis and Outlook Value (US$ Million) by Bicycle Type, 2024 to 2034

Figure 64: South Jeolla Industry Analysis and Outlook Value (US$ Million) Analysis by Component Type, 2019 to 2034

Figure 65: South Jeolla Industry Analysis and Outlook Volume (Units) Analysis by Component Type, 2019 to 2034

Figure 66: South Jeolla Industry Analysis and Outlook Value Share (%) and BPS Analysis by Component Type, 2024 to 2034

Figure 67: South Jeolla Industry Analysis and Outlook Y-o-Y Growth (%) Projections by Component Type, 2024 to 2034

Figure 68: South Jeolla Industry Analysis and Outlook Value (US$ Million) Analysis by Sales Channel, 2019 to 2034

Figure 69: South Jeolla Industry Analysis and Outlook Volume (Units) Analysis by Sales Channel, 2019 to 2034

Figure 70: South Jeolla Industry Analysis and Outlook Value Share (%) and BPS Analysis by Sales Channel, 2024 to 2034

Figure 71: South Jeolla Industry Analysis and Outlook Y-o-Y Growth (%) Projections by Sales Channel, 2024 to 2034

Figure 72: South Jeolla Industry Analysis and Outlook Value (US$ Million) Analysis by Bicycle Type, 2019 to 2034

Figure 73: South Jeolla Industry Analysis and Outlook Volume (Units) Analysis by Bicycle Type, 2019 to 2034

Figure 74: South Jeolla Industry Analysis and Outlook Value Share (%) and BPS Analysis by Bicycle Type, 2024 to 2034

Figure 75: South Jeolla Industry Analysis and Outlook Y-o-Y Growth (%) Projections by Bicycle Type, 2024 to 2034

Figure 76: South Jeolla Industry Analysis and Outlook Attractiveness by Component Type, 2024 to 2034

Figure 77: South Jeolla Industry Analysis and Outlook Attractiveness by Sales Channel, 2024 to 2034

Figure 78: South Jeolla Industry Analysis and Outlook Attractiveness by Bicycle Type, 2024 to 2034

Figure 79: Jeju Industry Analysis and Outlook Value (US$ Million) by Component Type, 2024 to 2034

Figure 80: Jeju Industry Analysis and Outlook Value (US$ Million) by Sales Channel, 2024 to 2034

Figure 81: Jeju Industry Analysis and Outlook Value (US$ Million) by Bicycle Type, 2024 to 2034

Figure 82: Jeju Industry Analysis and Outlook Value (US$ Million) Analysis by Component Type, 2019 to 2034

Figure 83: Jeju Industry Analysis and Outlook Volume (Units) Analysis by Component Type, 2019 to 2034

Figure 84: Jeju Industry Analysis and Outlook Value Share (%) and BPS Analysis by Component Type, 2024 to 2034

Figure 85: Jeju Industry Analysis and Outlook Y-o-Y Growth (%) Projections by Component Type, 2024 to 2034

Figure 86: Jeju Industry Analysis and Outlook Value (US$ Million) Analysis by Sales Channel, 2019 to 2034

Figure 87: Jeju Industry Analysis and Outlook Volume (Units) Analysis by Sales Channel, 2019 to 2034

Figure 88: Jeju Industry Analysis and Outlook Value Share (%) and BPS Analysis by Sales Channel, 2024 to 2034

Figure 89: Jeju Industry Analysis and Outlook Y-o-Y Growth (%) Projections by Sales Channel, 2024 to 2034

Figure 90: Jeju Industry Analysis and Outlook Value (US$ Million) Analysis by Bicycle Type, 2019 to 2034

Figure 91: Jeju Industry Analysis and Outlook Volume (Units) Analysis by Bicycle Type, 2019 to 2034

Figure 92: Jeju Industry Analysis and Outlook Value Share (%) and BPS Analysis by Bicycle Type, 2024 to 2034

Figure 93: Jeju Industry Analysis and Outlook Y-o-Y Growth (%) Projections by Bicycle Type, 2024 to 2034

Figure 94: Jeju Industry Analysis and Outlook Attractiveness by Component Type, 2024 to 2034

Figure 95: Jeju Industry Analysis and Outlook Attractiveness by Sales Channel, 2024 to 2034

Figure 96: Jeju Industry Analysis and Outlook Attractiveness by Bicycle Type, 2024 to 2034

Figure 97: Rest of Industry Analysis and Outlook Value (US$ Million) by Component Type, 2024 to 2034

Figure 98: Rest of Industry Analysis and Outlook Value (US$ Million) by Sales Channel, 2024 to 2034

Figure 99: Rest of Industry Analysis and Outlook Value (US$ Million) by Bicycle Type, 2024 to 2034

Figure 100: Rest of Industry Analysis and Outlook Value (US$ Million) Analysis by Component Type, 2019 to 2034

Figure 101: Rest of Industry Analysis and Outlook Volume (Units) Analysis by Component Type, 2019 to 2034

Figure 102: Rest of Industry Analysis and Outlook Value Share (%) and BPS Analysis by Component Type, 2024 to 2034

Figure 103: Rest of Industry Analysis and Outlook Y-o-Y Growth (%) Projections by Component Type, 2024 to 2034

Figure 104: Rest of Industry Analysis and Outlook Value (US$ Million) Analysis by Sales Channel, 2019 to 2034

Figure 105: Rest of Industry Analysis and Outlook Volume (Units) Analysis by Sales Channel, 2019 to 2034

Figure 106: Rest of Industry Analysis and Outlook Value Share (%) and BPS Analysis by Sales Channel, 2024 to 2034

Figure 107: Rest of Industry Analysis and Outlook Y-o-Y Growth (%) Projections by Sales Channel, 2024 to 2034

Figure 108: Rest of Industry Analysis and Outlook Value (US$ Million) Analysis by Bicycle Type, 2019 to 2034

Figure 109: Rest of Industry Analysis and Outlook Volume (Units) Analysis by Bicycle Type, 2019 to 2034

Figure 110: Rest of Industry Analysis and Outlook Value Share (%) and BPS Analysis by Bicycle Type, 2024 to 2034

Figure 111: Rest of Industry Analysis and Outlook Y-o-Y Growth (%) Projections by Bicycle Type, 2024 to 2034

Figure 112: Rest of Industry Analysis and Outlook Attractiveness by Component Type, 2024 to 2034

Figure 113: Rest of Industry Analysis and Outlook Attractiveness by Sales Channel, 2024 to 2034

Figure 114: Rest of Industry Analysis and Outlook Attractiveness by Bicycle Type, 2024 to 2034

Recommendations

Automotive

Bicycle Components Aftermarket

Published : July 2023

Explore Automotive Insights

View Reports

Bicycle Component Aftermarket Analysis in Korea