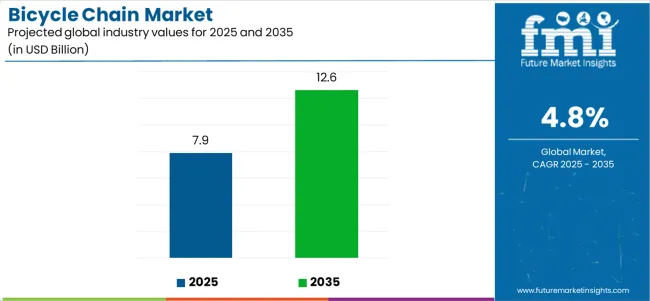
The global bicycle chain market is anticipated to grow from USD 7.9 billion in 2025 to USD 12.6 billion by 2035, advancing at a CAGR of 4.8%. The bicycle chain industry stands at the threshold of a decade-long expansion trajectory that promises to reshape cycling component manufacturing and drivetrain technology. As per Future Market Insights, valued as an ESOMAR-accredited research organization, the market's journey represents substantial growth, demonstrating the accelerating adoption of advanced multi-speed chains, premium materials, and e-bike compatible components across bicycle manufacturers, aftermarket distributors, and cycling enthusiasts worldwide.
The first half of the decade (2025-2030) will witness the market climbing from USD 7.9 billion to approximately USD 10.0 billion, adding USD 2.1 billion in value, which constitutes 43.8% of the total forecast growth period. This phase will be characterized by the rapid adoption of 12-speed and 11-speed chains, driven by increasing demand for performance cycling components and e-bike proliferation worldwide. Advanced materials, including nickel-plated alloys and carbon steel variants, will become standard expectations rather than premium options.
The latter half (2030-2035) will witness steady growth from USD 10.0 billion to USD 12.6 billion, representing an addition of USD 2.7 billion or 56.2% of the decade's expansion. This period will be defined by mass market penetration of high-speed drivetrain systems, integration with smart bicycle technologies, and seamless compatibility with electric bicycle powertrains. The market trajectory signals fundamental shifts in how cyclists and manufacturers approach component selection and performance optimization, with participants positioned to benefit from steady demand across multiple application segments.
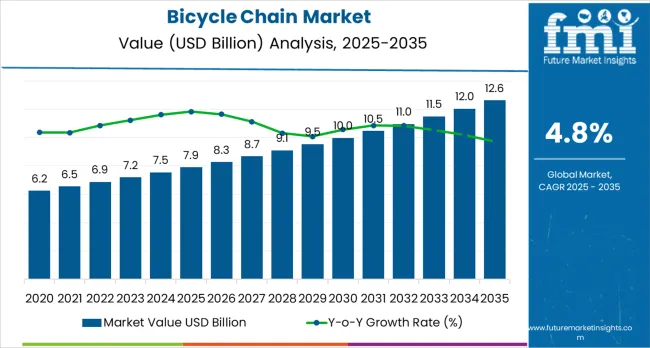
The market demonstrates distinct growth phases with varying market characteristics and competitive dynamics. Between 2025 and 2030, the market progresses through its performance cycling adoption phase, expanding from USD 7.9 billion to USD 10.0 billion with steady annual increments averaging 4.8% growth. This period showcases the transition from traditional single-speed and basic multi-speed chains to advanced 11-speed and 12-speed platforms with enhanced shifting performance and durability characteristics becoming mainstream features.
The 2025-2030 phase adds USD 2.1 billion to market value, representing 43.8% of total decade expansion. Market maturation factors include standardization of high-speed drivetrain protocols, declining manufacturing costs for precision chains, and increasing cyclist awareness of component quality benefits, reaching 92-95% efficiency in power transmission applications. Competitive landscape evolution during this period features established component manufacturers like SHIMANO and SRAM expanding their premium chain portfolios while new entrants focus on specialized materials and e-bike compatible designs.
From 2030 to 2035, market dynamics shift toward e-bike integration and smart component deployment, with growth accelerating from USD 10.0 billion to USD 12.6 billion, adding USD 2.7 billion or 56.2% of total expansion. This phase transition logic centers on comprehensive drivetrain ecosystems, integration with electric motor systems, and deployment across diverse cycling specialties, becoming standard rather than specialized applications. The competitive environment matures with focus shifting from basic chain functionality to comprehensive cycling performance ecosystems and integration with IoT-enabled bicycle platforms and predictive maintenance systems.
At-a-Glance Metrics
| Metric | Value |
|---|---|
| USD Market Value (2025) | USD 7.9 billion |
| USD Market Forecast (2035) | USD 12.6 billion |
| Growth Rate | 4.8% CAGR |
| Leading Chain Type | 12-speed Chains |
| Primary Application | City Bicycle |
The market demonstrates strong fundamentals with 12-speed Chains capturing a dominant share through advanced shifting features and performance optimization capabilities. City Bicycle applications drive primary demand, supported by increasing urbanization trends and cycling infrastructure investment globally. Geographic expansion remains concentrated in developed markets with established cycling cultures, while emerging economies show accelerating adoption rates driven by e-bike penetration and rising middle-class spending on premium bicycle components.
Market expansion rests on three fundamental shifts driving adoption across the cycling and transportation sectors. E-bike proliferation creates compelling demand for robust, high-performance chains that can withstand increased torque from electric motors while providing smooth power transmission, enabling manufacturers to deliver superior riding experiences and extended component lifespan. Performance cycling evolution accelerates as cycling enthusiasts worldwide seek advanced multi-speed drivetrains that complement modern bicycle designs, enabling precise gear changes and weight optimization applications that align with competitive cycling standards and recreational riding requirements. 3. Urban mobility transformation drives adoption from city commuters and bike-sharing operators requiring durable chain solutions that minimize maintenance intervals while maintaining consistent performance during daily transportation and shared mobility operations.
Growth faces headwinds from price sensitivity challenges that vary across markets regarding the adoption of premium chain systems and component upgrade protocols, which may limit market penetration in price-conscious regions. Technical compatibility issues also persist regarding legacy bicycle standards and non-standardized drivetrain formats that may reduce chain performance with older derailleurs or cassette systems, limiting upgrade pathways for budget-conscious cyclists.
The bicycle chain market represents a transformative growth opportunity, expanding from USD 7.9 billion in 2025 to USD 12.6 billion by 2035 at a 4.8% CAGR. As cycling industries worldwide prioritize performance optimization, durability enhancement, and e-bike integration, advanced chain systems have evolved from basic components to mission-critical drivetrain elements, enabling superior power transmission, reduced maintenance requirements, and supporting cycling excellence across road, mountain, urban, and electric bicycle applications.
The convergence of e-bike adoption mandates, increasing performance cycling participation, material technology maturation, and eco-friendly requirements creates unprecedented adoption momentum. Advanced chain designs offering superior durability, seamless shifting performance, and e-bike compatibility will capture premium market positioning, while geographic expansion into emerging cycling markets and scalable manufacturing will drive volume leadership.
Primary Classification: The market segments by chain type into 1-speed, 9-speed, 10-speed, 11-speed, and 12-speed categories, representing the evolution from basic single-speed designs to advanced multi-speed systems for comprehensive cycling performance coverage.
Material Segmentation: Material type classification divides the market into Carbon Steel, Alloy Steel, and Nickel Plated variants, reflecting distinct requirements for strength, weight optimization, corrosion resistance, and durability across different cycling applications.
Application Breakdown: Bicycle type segmentation covers Kids Bicycles, City Bicycles, Mountain Bikes, Racing Bikes, E-Bikes, and Others, demonstrating diverse requirements for recreational cycling, competitive racing, urban commuting, and electric-assisted mobility applications.
Width Classification: Width type segments include 1/8', 3/16', and 3/32'specifications, addressing compatibility requirements for different drivetrain configurations, from single-speed urban bikes to narrow racing chains optimized for multi-speed cassettes.
Channel Structure: Sales channel division between OEM (Original Equipment Manufacturer) and Aftermarket segments reflects the dual nature of chain distribution through bicycle manufacturers for new bike builds and replacement/upgrade markets through retail channels.
Regional Classification: Geographic distribution covers Europe, Asia Pacific, North America, Latin America, and Middle East &Africa, with developed markets leading adoption while emerging economies show accelerating growth patterns driven by cycling infrastructure development and e-bike penetration.
The segmentation structure reveals technology progression from traditional single-speed chains toward integrated multi-speed platforms with enhanced materials and performance capabilities, while application diversity spans from children's bicycles to professional racing components requiring precise power transmission and minimal friction losses.
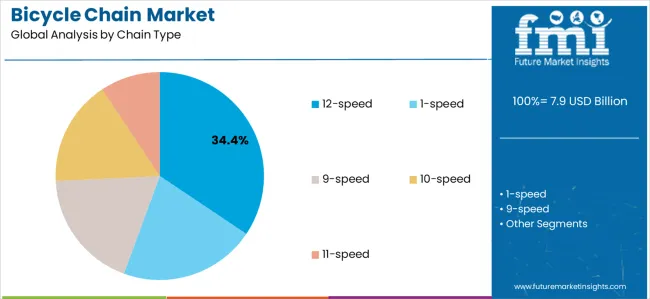
Market Position: 12-speed chains command the leading position in the market with approximately 34.4% market share through advanced shifting performance, including smooth gear transitions, optimized plate spacing, and compatibility with modern narrow-wide cassette designs that enable cyclists to deploy cutting-edge drivetrains across road racing, gravel cycling, and mountain biking applications without significant compatibility concerns.
Value Drivers: The segment benefits from professional cyclist preference and technology trickle-down effects where innovations developed for competitive cycling become accessible to enthusiast riders. The 12-speed architecture enables wider gear ranges with smaller steps between ratios, providing optimal cadence maintenance across varied terrain while reducing overall drivetrain weight compared to older triple-chainring configurations.
Competitive Advantages: 12-speed systems differentiate through established compatibility with leading groupset manufacturers including SHIMANO Dura-Ace/XTR, SRAM RED/XX1 Eagle, and Campagnolo Super Record platforms. Manufacturing precision requirements create barriers to entry, favoring established players with advanced production capabilities and quality control systems capable of maintaining the tight tolerances necessary for reliable 12-speed performance.
Key market characteristics:
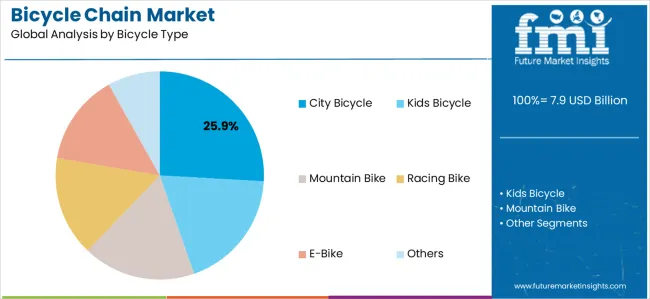
Market Context: City Bicycle applications dominate the market with approximately 25.9% market share due to widespread urbanization trends, expanding cycling infrastructure investment, and increasing adoption of bicycles for daily commuting and recreational activities that prioritize reliability, low maintenance, and all-weather performance over weight optimization or racing-specific features.
Appeal Factors: Urban cyclists prioritize chain durability, corrosion resistance, and compatibility with protective chaincase systems that enable worry-free commuting across varied weather conditions. The segment benefits from substantial municipal investment in cycling infrastructure and bike-sharing programs that prioritizes component longevity and reduced maintenance intervals to minimize operational costs and maximize system availability.
Growth Drivers: City planning initiatives incorporating protected bike lanes, bike-sharing expansion programs, and workplace cycling incentives drive steady demand for reliable urban cycling components. Simultaneously, environmental consciousness and traffic congestion concerns position cycling as a practical alternative to automobile commuting, particularly for trips under 10km where bicycles offer competitive door-to-door travel times in congested urban environments.
Market Challenges: Competition from budget-oriented chains and price sensitivity among casual cyclists may pressure margins, while the shift toward e-bikes within urban contexts requires chain manufacturers to adapt product specifications for higher torque loads and extended service intervals.
Application dynamics include:
Growth Accelerators: E-bike electrification drives primary adoption as electric bicycle sales surge globally, with Germany alone recording 1.5 million e-bike sales in 2024 and China maintaining position as the world's largest e-bike market with over 300 million units in circulation. E-bikes demand reinforced chains capable of handling 70-90Nm torque from mid-drive motors compared to 40-50Nm from human power alone, creating premium pricing opportunities for manufacturers developing specialized e-bike chain solutions with enhanced plate thickness, tensile strength ratings exceeding 1,100kg, and corrosion-resistant coatings extending service life in diverse weather conditions. Performance cycling evolution accelerates market expansion as competitive cycling participation increases worldwide, with UCI-sanctioned events growing 15% annually and recreational gran fondo participation expanding across North America, Europe, and Asia. Enthusiast cyclists prioritize weight optimization, shifting precision, and component longevity, driving demand for premium 11-speed and 12-speed chains featuring hollow construction, titanium nitride coatings, and optimized friction characteristics delivering measurable efficiency gains of 2-5 watts compared to standard chains. Urbanization trends create steady demand for reliable commuter chains as global urban populations expand from 4.4 billion in 2025 toward projected 5.2 billion by 2035, with cities worldwide investing in cycling infrastructure to address traffic congestion, air quality concerns, and climate change mitigation objectives. Amsterdam's 880km cycling network, Copenhagen's comprehensive bike lane system, and Paris's €250 million cycling infrastructure investment exemplify policy support translating to steady component demand.
Growth Inhibitors: Price sensitivity varies significantly across markets, with emerging economy consumers balancing component quality against affordability constraints, limiting penetration of premium 12-speed chains priced at USD 60-120 compared to entry-level options available for USD 8-15. Market fragmentation across incompatible drivetrain standards creates complexity for manufacturers and retailers, with SHIMANO's Hyperglide+, SRAM's Flattop, and Campagnolo's Ultra-Link representing proprietary chain designs requiring specific compatibility, limiting consumer flexibility and creating inventory challenges for retailers managing multiple SKUs. Technical performance limitations persist regarding chain wear characteristics, with typical replacement intervals of 2,000-5,000km depending on riding conditions, maintenance practices, and component quality creating recurring costs that may discourage casual cyclists from component upgrades. Environmental concerns regarding manufacturing processes and material sourcing pressure margins as sustainability-conscious consumers and corporate procurement policies prioritize chains manufactured with recycled materials, reduced water consumption, and carbon-neutral production facilities, requiring capital investment in cleaner manufacturing technologies. Competition from alternative drivetrain systems including belt drives (Gates Carbon Drive) and shaft drive configurations threaten long-term chain demand in specific urban cycling segments where low maintenance and cleanliness advantages outweigh slight efficiency penalties and higher initial costs.
Market Evolution Patterns: Adoption accelerates in performance cycling and e-bike sectors where component quality justifies premium pricing, with geographic concentration in Western Europe (particularly Germany, Netherlands, Belgium) transitioning toward mainstream adoption in China, India, and Southeast Asian markets driven by rising disposable incomes and government support for cycling infrastructure. Technology development focuses on enhanced durability through advanced coating technologies including Diamond-Like Carbon (DLC) and ceramic treatments reducing friction coefficients while extending service life, improved corrosion resistance for all-weather reliability, and smart chain prototypes with embedded wear sensors providing maintenance alerts through smartphone connectivity. Material innovations prioritize lightweight alloys maintaining strength characteristics while reducing rotating mass, with titanium construction penetrating ultra-premium segments for competitive cycling applications prioritizing every gram of weight savings. The market could face disruption if alternative technologies achieve cost parity with traditional chain drives while offering superior maintenance characteristics, or if material constraints (nickel supply, steel pricing volatility) significantly impact manufacturing economics and retail pricing structures.
The market demonstrates varied regional dynamics with Growth Leaders including Turkey (5.9% CAGR) and Russia (4.5% CAGR) driving expansion through cycling infrastructure development and rising middle-class spending on recreational equipment. Steady Performers encompass Mexico (4.3% CAGR), China (3.8% CAGR), and Germany (3.5% CAGR), benefiting from established cycling markets and e-bike adoption acceleration. Mature Markets feature the United States (~3.3% CAGR) and India (~3.2% CAGR), where cycling participation growth and component upgrade cycles support consistent market expansion.
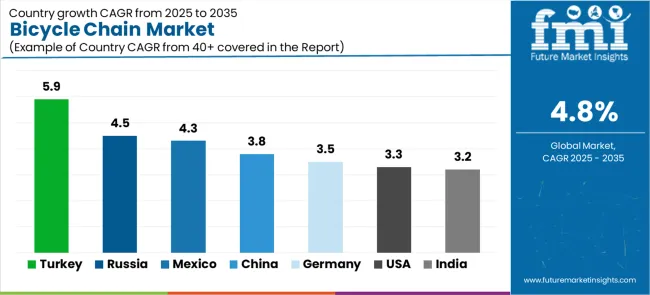
| Country | CAGR (2025-2035) |
|---|---|
| Turkey | 5.9% |
| Russia | 4.5% |
| Mexico | 4.3% |
| China | 3.8% |
| Germany | 3.5% |
| United States | 3.3% |
| India | 3.2% |
Regional synthesis reveals emerging markets leading growth through infrastructure investment and cycling adoption, while mature European markets maintain steady expansion supported by e-bike proliferation and component replacement cycles. Asian markets show divergent patterns with China's massive installed base driving volume growth while premium segment development creates value opportunities.
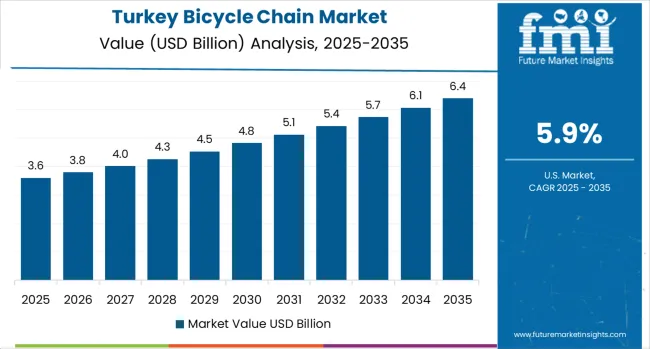
Turkey establishes high-growth positioning through expanding urban cycling infrastructure and rising disposable incomes among middle-class consumers seeking recreational and commuting alternatives to automobile transportation. The country's 5.9% CAGR through 2035 reflects government initiatives promoting eco-friendly transportation and tourism-oriented cycling route development, particularly along coastal regions and historic Silk Road corridors attracting international cycling tourism. Growth concentrates in major metropolitan areas including Istanbul, Ankara, and Izmir, where municipal investments in protected bike lanes and bike-sharing programs create constant demand for reliable, maintenance-friendly chain components suitable for diverse riding conditions.
Turkish cyclists demonstrate increasing preference for mid-range multi-speed bicycles equipped with 8-speed to 10-speed drivetrains, balancing performance capabilities with affordability considerations important in price-sensitive markets. Local bicycle assembly operations source chains primarily through international suppliers including SHIMANO and KMC, with distribution networks expanding through specialized bicycle retailers and general sporting goods stores reaching consumers across urban and regional markets.
Strategic Market Indicators:
Russia demonstrates robust market development with a 4.5% CAGR through 2035, driven by expanding urban cycling cultures in Moscow, Saint Petersburg, and regional population centers where traffic congestion and environmental awareness create favorable conditions for bicycle adoption. The market benefits from growing middle-class recreational spending and government support for active lifestyle initiatives promoting cycling as accessible fitness activity across diverse age groups and fitness levels.
Russian consumers prioritize chain reliability in harsh winter conditions, driving demand for corrosion-resistant coatings and sealed bearing systems protecting against road salt contamination and sub-zero temperatures common across much of the country during extended winter seasons. Market expansion follows patterns established in sporting goods retail, where specialized bicycle shops compete with online marketplaces offering broader selection and competitive pricing, particularly for replacement chains and performance upgrade components.
Market Intelligence Brief:
Mexico's market expansion benefits from diverse cycling demand including urban commuting in Mexico City, Guadalajara, and Monterrey, recreational cycling along coastal regions, and growing mountain biking communities in highland areas surrounding major population centers. The country maintains a 4.3% CAGR through 2035, driven by urbanization trends, traffic congestion challenges in megacities, and government infrastructure investments supporting cycling as sustainable transportation alternative complementing public transit systems.
Mexican cyclists demonstrate strong value orientation, with mid-range chains from established manufacturers capturing majority market share through bicycle shop networks and mass-market retailers. Growing e-bike adoption among affluent urban consumers creates opportunities for premium chain solutions, while traditional single-speed bicycles remain prevalent in lower-income communities and rural areas, requiring basic chain designs focusing affordability and local availability of replacement parts.
Strategic Market Considerations:
China establishes dominant market position through massive installed bicycle base exceeding 500 million units and position as global center for bicycle and component manufacturing, serving both domestic consumption and international export markets. The country's 3.8% CAGR through 2035 reflects mature market characteristics balanced by continued e-bike adoption and rising consumer preferences for premium components as disposable incomes increase across tier-1 and tier-2 cities including Beijing, Shanghai, Shenzhen, and Chengdu.
Chinese manufacturers including KMC International and TAYA CHAIN maintain global leadership in chain production, leveraging economies of scale and vertically integrated manufacturing capabilities serving OEM relationships with bicycle brands worldwide while capturing significant domestic market share through competitive pricing and comprehensive distribution networks reaching specialized bicycle retailers, mass-market department stores, and e-commerce platforms.
Performance Metrics:
Germany's advanced cycling market demonstrates sophisticated chain deployment with documented performance benefits in competitive cycling, e-bike applications, and urban commuting scenarios through integration with high-quality drivetrains and comprehensive bicycle infrastructure. The country leverages engineering expertise in precision manufacturing and transportation technology to maintain a 3.5% CAGR through 2035, with cycling centers including Munich, Berlin, Hamburg, and Freiburg showcasing premium chain installations integrated with electronic shifting systems and comprehensive bicycle computer platforms optimizing drivetrain performance and maintenance scheduling.
German cyclists prioritize component quality and longevity, creating strong demand for premium chains from SHIMANO, SRAM, and Campagnolo that justify higher pricing through measurable durability advantages and compatibility with high-end groupsets standard on German-manufactured bicycles from brands including Cube, Canyon, Focus, and Haibike. The market benefits from Europe's most developed e-bike segment with 1.5 million annual sales and over 8 million e-bikes in operation, requiring specialized chains engineered for increased torque loads and extended service intervals demanded by electric-assisted cycling applications.
Market Intelligence Brief:
The USA market prioritizes diverse cycling applications including road racing, mountain biking, urban commuting, and recreational cycling, supporting broad demand across chain types from basic single-speed to advanced 12-speed systems. The country demonstrates approximately 3.3% CAGR through 2035, driven by cycling participation growth, e-bike adoption acceleration in states including California, Colorado, and Oregon, and increasing urban cycling infrastructure investment in cities such as Portland, Minneapolis, and New York supporting bicycle commuting and recreational riding.
American cyclists demonstrate strong brand loyalty toward SHIMANO and SRAM, which collectively capture an estimated 75% of USA market share through extensive dealer networks and OEM relationships with domestic bicycle brands including Trek, Specialized, Cannondale, and Giant USA. Distribution channels emphasize independent bicycle dealers providing professional installation and maintenance services, supplemented by growing online retailers serving price-conscious consumers and experienced cyclists comfortable with self-installation and drivetrain maintenance procedures.
Performance Metrics:
India's market development reflects expanding middle-class cycling participation and government infrastructure initiatives promoting cycling as eco-friendly urban transportation across major metropolitan areas including Delhi, Mumbai, Bangalore, and Pune. The country demonstrates approximately 3.2% CAGR through 2035, supported by rising disposable incomes, traffic congestion challenges, and fitness awareness trends driving recreational cycling adoption among urban professionals and families seeking active lifestyle activities.
Indian consumers demonstrate strong price sensitivity, with majority market share captured by basic single-speed and 6-speed to 7-speed chains suitable for entry-level bicycles and urban commuting applications. Premium segment remains limited but shows growth potential as affluent consumers adopt high-end road bikes and mountain bikes equipped with advanced drivetrains, while e-bike adoption accelerates in major cities creating opportunities for specialized chain products addressing electric bicycle requirements and Indian riding conditions.
Market Intelligence Brief:
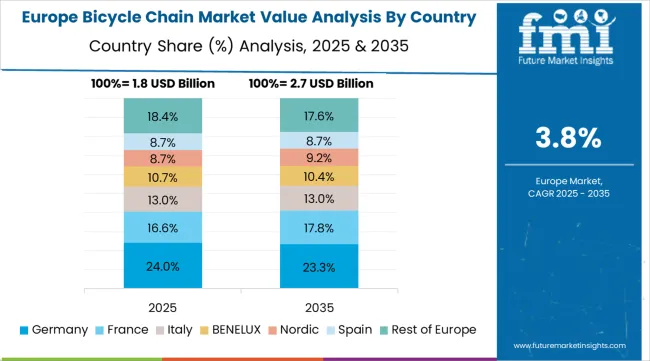
The Bicycle Chain market in Europe is projected to grow from USD 2.8 billion in 2025 to USD 4.2 billion by 2035, registering a CAGR of 4.2% over the forecast period. Germany is expected to maintain its leadership position with a 38.5% market share in 2025, rising to 39.2% by 2035, supported by its dominant e-bike market with 1.5 million annual sales, advanced cycling infrastructure, and strong consumer preference for premium components from brands including SHIMANO, SRAM, and Rohloff.
The Netherlands follows with a 22.8% share in 2025, projected to reach 23.1% by 2035, driven by exceptional cycling modal share exceeding 27% of all trips nationally and comprehensive urban cycling networks in Amsterdam, Rotterdam, and Utrecht requiring reliable, low-maintenance chains for commuter and cargo bicycles. France holds an 18.4% share in 2025, expected to increase to 18.9% by 2035 through expanding cycling infrastructure investment including Paris's €250 million cycling plan, Tour de France-inspired recreational cycling participation, and growing e-bike adoption across urban centers.
The United Kingdom commands a 12.6% share in 2025, rising to 12.9% by 2035, driven by government Cycle to Work schemes, expanding protected cycling infrastructure in London and regional cities, and strong road cycling and mountain biking communities supporting premium chain demand. Italy accounts for 5.2% in 2025, increasing to 5.4% by 2035, supported by heritage cycling culture, domestic component manufacturing including Campagnolo chains, and strong recreational cycling participation. Spain holds 2.5% in 2025, reaching 2.7% by 2035, driven by coastal tourism cycling, urban bike-sharing programs, and growing mountain biking in Pyrenees and Sierra Nevada regions.
The Rest of Europe region, including Nordic countries (Denmark, Sweden, Norway, Finland), Eastern Europe (Poland, Czech Republic), BENELUX nations (Belgium, Luxembourg), and other markets, is anticipated to hold 0.0% in 2025, declining to -1.2% by 2035, attributed to mixed growth patterns with strong expansion in cycling-friendly Nordic markets balanced by slower adoption in Eastern European countries with developing cycling infrastructure and lower average component spending per capita.
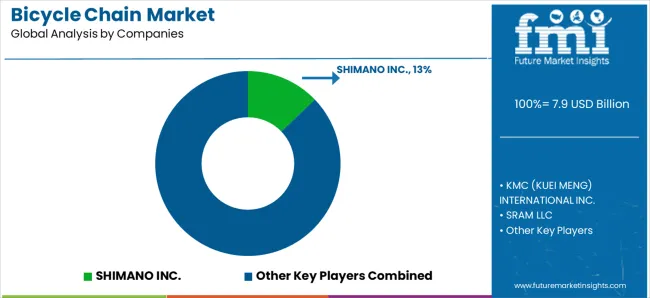
The market operates with moderate concentration, featuring approximately 12-15 meaningful participants, where leading companies control roughly 65-72% of the global market share through established bicycle manufacturer relationships and comprehensive drivetrain component portfolios. Competition prioritizes technological innovation, manufacturing precision, and OEM partnerships rather than price-based rivalry, with premium segments demonstrating strong brand loyalty and performance differentiation.
Market Leaders encompass SHIMANO INC., KMC (KUEI MENG) INTERNATIONAL INC., SRAM LLC, Izumi Chain Mfg Co. Ltd., and TAYA CHAIN CO., Ltd., which maintain competitive advantages through extensive research and development capabilities, global manufacturing networks, and comprehensive OEM relationships with major bicycle brands including Trek, Specialized, Giant, Merida, and Scott. These Tier-1 companies collectively control 30-40% of global market share and leverage decades of drivetrain expertise and ongoing technology investments to develop advanced chains with optimized plate profiles, coating technologies, and compatibility with electronic shifting systems.
SHIMANO dominates through vertically integrated component ecosystem spanning derailleurs, cassettes, chainrings, and chains engineered for optimal compatibility, capturing an estimated 45-50% share of premium multi-speed chain segments through Dura-Ace, Ultegra, XT, and XTR product lines. KMC International maintains strong position as leading independent chain manufacturer serving both OEM and aftermarket channels with comprehensive product range spanning entry-level to premium applications, while developing innovative designs including X-series chains with extended service life and enhanced shifting performance.
Technology Challengers include Connex, Wippermann, and YBN, which compete through specialized chain focus and innovative manufacturing processes appealing to performance-oriented cyclists seeking alternatives to major brand offerings. These companies differentiate through rapid technology adoption, direct-to-consumer marketing focusing durability testing and performance metrics, and niche positioning in premium aftermarket segments where brand loyalty is less entrenched than OEM markets.
Regional Specialists feature companies like D.I.D (Japan), Regina (Italy), and Sedis (France), which focus on specific geographic markets and specialized applications including motorcycle-derived technology adapted for bicycle use, vintage bicycle restoration, and specialized industrial chain applications. Market dynamics favor participants that combine precision manufacturing with advanced materials engineering and OEM partnerships securing volume sales through bicycle manufacturer specifications.
| Item | Value |
|---|---|
| Quantitative Units | USD 7.9 billion (2025) |
| Chain Type | 1-speed, 9-speed, 10-speed, 11-speed, 12-speed |
| Material Type | Carbon Steel, Alloy Steel, Nickel Plated |
| Bicycle Type | Kids Bicycle, City Bicycle, Mountain Bike, Racing Bike, E-Bike, Others |
| Width Type | 1/8', 3/16', 3/32' |
| Sales Channel | OEM, Aftermarket |
| Regions Covered | Europe, Asia Pacific, North America, Latin America, Middle East &Africa |
| Countries Covered | Germany, China, United States, India, Netherlands, France, United Kingdom, Italy, Turkey, Russia, Mexico, Japan, and 20+ additional countries |
| Key Companies Profiled | SHIMANO INC., KMC International, SRAM LLC, Izumi Chain, TAYA CHAIN, Connex, Wippermann, YBN Chain, D.I.D, Regina Chain, Sedis, Campagnolo |
| Additional Attributes | Dollar sales by chain type, material type, bicycle type, width specifications, and sales channel categories;regional adoption trends across Europe, Asia Pacific, and North America;competitive landscape with component manufacturers and specialized chain producers;cyclist preferences for shifting performance, durability, and compatibility;integration with electronic shifting systems and e-bike powertrains;innovations in coating technologies and material engineering;development of advanced solutions with enhanced efficiency and extended service intervals |
The global bicycle chain market is estimated to be valued at USD 7.9 billion in 2025.
The market size for the bicycle chain market is projected to reach USD 12.6 billion by 2035.
The bicycle chain market is expected to grow at a 4.8% CAGR between 2025 and 2035.
The key product types in bicycle chain market are 12-speed, 1-speed, 9-speed, 10-speed and 11-speed.
In terms of bicycle type, city bicycle segment to command 25.9% share in the bicycle chain market in 2025.


Full Research Suite comprises of:
Market outlook & trends analysis
Interviews & case studies
Strategic recommendations
Vendor profiles & capabilities analysis
5-year forecasts
8 regions and 60+ country-level data splits
Market segment data splits
12 months of continuous data updates
DELIVERED AS:
PDF EXCEL ONLINE
Bicycle Chain Tensioner Market Size and Share Forecast Outlook 2025 to 2035
Bicycle Chain Device Market Size and Share Forecast Outlook 2025 to 2035
Bicycle Tire Market Size and Share Forecast Outlook 2025 to 2035
Bicycle Components Aftermarket Size and Share Forecast Outlook 2025 to 2035
Bicycle Crankset Market Size and Share Forecast Outlook 2025 to 2035
Bicycle Drivetrain Cassette Market Size and Share Forecast Outlook 2025 to 2035
Bicycle Frames Market Analysis - Size, Share, and Forecast Outlook 2025 to 2035
Bicycle Saddle Market Size and Share Forecast Outlook 2025 to 2035
Bicycle Electronic Drivetrain Market Size and Share Forecast Outlook 2025 to 2035
Bicycle Gear Shifter Market Size and Share Forecast Outlook 2025 to 2035
Bicycle Brake Lever Market Size and Share Forecast Outlook 2025 to 2035
Bicycle Bottom Bracket Market Size and Share Forecast Outlook 2025 to 2035
Bicycle Front Hub Market Size and Share Forecast Outlook 2025 to 2035
Bicycle Rim Market Size and Share Forecast Outlook 2025 to 2035
Bicycle Disc Brake Rotor Market Size and Share Forecast Outlook 2025 to 2035
Bicycle Trip Market Size and Share Forecast Outlook 2025 to 2035
Bicycle Mechanical Disc Brake Market Size and Share Forecast Outlook 2025 to 2035
Bicycle Light Market Growth - Trends & Forecast 2025 to 2035
Bicycle Market Analysis - Size, Share, and Forecast Outlook 2025 to 2035
Bicycle Bags and Backpacks Market - Trends, Growth & Forecast 2025 to 2035

Thank you!
You will receive an email from our Business Development Manager. Please be sure to check your SPAM/JUNK folder too.
Chat With
MaRIA