Korea Automotive Performance Tuning and Engine Remapping Service Industry Size and Share Forecast Outlook 2025 to 2035

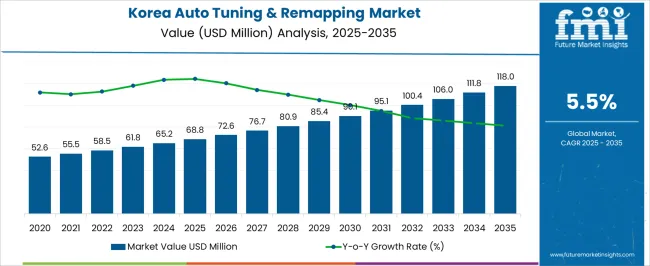
The Korea Automotive Performance Tuning and Engine Remapping Service Industry is estimated to be valued at USD 68.8 million in 2025 and is projected to reach USD 118.0 million by 2035, registering a compound annual growth rate (CAGR) of 5.5% over the forecast period.
Quick Stats for Korea Automotive Performance Tuning and Engine Remapping Service Industry

  • Korea Automotive Performance Tuning and Engine Remapping Service Industry Industry Value (2025): USD 68.8 million
  • Korea Automotive Performance Tuning and Engine Remapping Service Industry Forecast Value (2035): USD 118.0 million
  • Korea Automotive Performance Tuning and Engine Remapping Service Industry Forecast CAGR: 5.5%
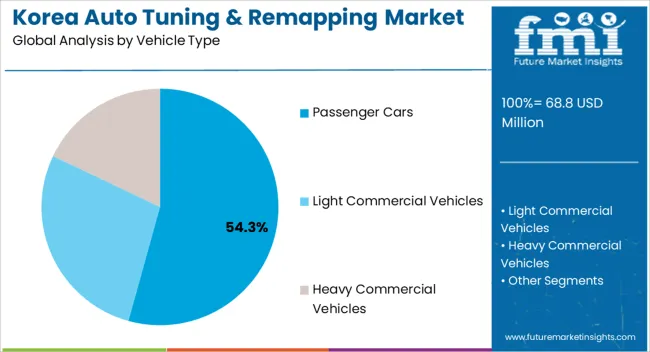
  • Leading Segment in Korea Automotive Performance Tuning and Engine Remapping Service Industry in 2025: Passenger Cars (54.3%)
  • Key Growth Region in Korea Automotive Performance Tuning and Engine Remapping Service Industry: North America, Asia-Pacific, Europe
  • Top Key Players in Korea Automotive Performance Tuning and Engine Remapping Service Industry: Remus Korea, Korea International Circuit, KT Racing, Carshop Nunu, TS Autohaus

Korea Auto Tuning & Remapping Market Market Value Analysis

Metric Value
Korea Automotive Performance Tuning and Engine Remapping Service Industry Estimated Value in (2025 E) USD 68.8 million
Korea Automotive Performance Tuning and Engine Remapping Service Industry Forecast Value in (2035 F) USD 118.0 million
Forecast CAGR (2025 to 2035) 5.5%

Rationale for Segmental Growth in the Korea Automotive Performance Tuning and Engine Remapping Service Industry

The Korea automotive performance tuning and engine remapping service industry is expanding steadily. Rising consumer preference for enhanced driving experience, growing awareness of engine efficiency, and increased availability of advanced tuning technologies are shaping demand. Current dynamics are defined by rising disposable incomes, evolving automotive lifestyles, and wider access to specialized service providers.

Fuel efficiency optimization and performance customization are being prioritized by both individual consumers and fleet owners. Regulatory frameworks related to emission standards are influencing tuning practices, with compliant solutions being adopted to ensure performance without compromising sustainability. The future outlook is driven by expanding adoption of electronic control unit remapping, integration of AI and data-driven diagnostics, and technological innovations that provide precise tuning options.

Growth rationale is centered on the dual drivers of improved performance and fuel economy, alongside consumer inclination toward personalized automotive solutions Strategic collaborations between service providers and aftermarket players are expected to strengthen market positioning and extend industry growth in Korea.
Segmental Analysis

Insights into the Vehicle Type Segment

Korea Auto Tuning & Remapping Market Analysis By Vehicle Type

Passenger cars, holding 54.30% of the vehicle type category, represent the leading segment due to widespread ownership and strong consumer inclination toward performance enhancement in personal vehicles. Market share has been reinforced by demand for improved acceleration, torque, and overall driving dynamics, which are increasingly sought after by enthusiasts and everyday users.

Service adoption has been boosted by rising affordability of tuning packages, enhanced availability of skilled technicians, and integration of diagnostic software for precise remapping. Urbanization and higher car density in Korea have further driven service demand, particularly in metropolitan areas.

Continued focus on premium and mid-range passenger vehicles is expected to sustain adoption, while evolving consumer expectations for customization and advanced driving experiences will reinforce the segment’s market leadership.
Insights into the Fuel Type Segment

Korea Auto Tuning & Remapping Market Analysis By Fuel Type

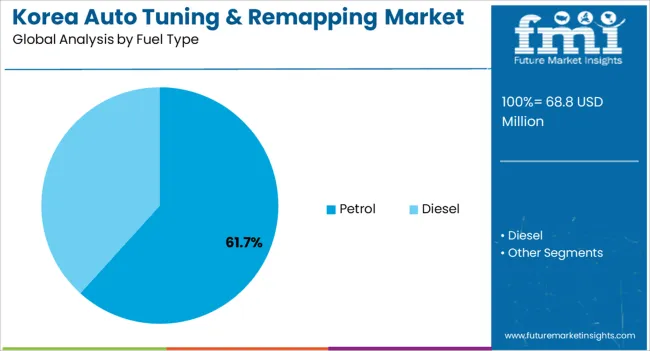
The petrol segment, accounting for 61.70% of the fuel type category, dominates due to the high penetration of petrol-powered vehicles in Korea’s automotive landscape. Demand has been influenced by ease of tuning petrol engines compared to diesel, as well as their responsiveness to remapping for performance improvements.

Adoption is further supported by a younger consumer demographic that prioritizes speed and agility, aligning with the tuning benefits petrol engines deliver. Availability of high-octane fuels and advanced aftermarket solutions has reinforced the segment’s growth.

Technological advancements in engine control units have enabled more precise remapping, optimizing both efficiency and performance This segment is expected to maintain leadership, with continued demand from both mainstream and premium petrol vehicle owners.
Insights into the Tuning Stage Segment

Korea Auto Tuning & Remapping Market Analysis By Tuning Stage

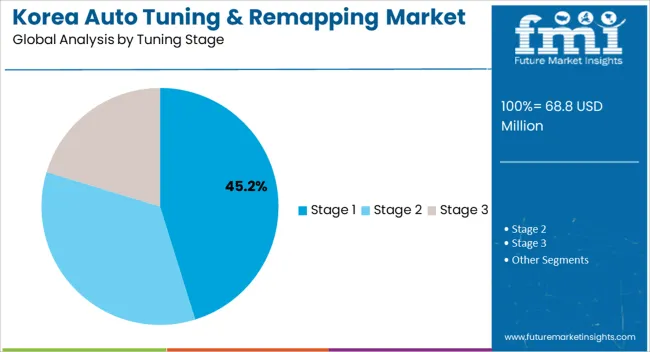
The Stage 1 tuning segment, representing 45.20% of the tuning stage category, has been leading due to its accessibility, affordability, and minimal modification requirements. It has gained strong traction among consumers seeking noticeable performance improvements without extensive hardware changes.

Service providers have emphasized Stage 1 packages as an entry point for customers, offering reliable enhancements in horsepower and torque within safe engine limits. Demand stability has been supported by shorter service times, lower costs, and compliance with regulatory guidelines.

Market growth is being reinforced by digital tuning tools that improve accuracy and consistency, ensuring wider acceptance among vehicle owners Continued consumer interest in incremental performance upgrades, combined with rising awareness of safe remapping practices, is expected to sustain the segment’s prominence within the Korean market.

Key Trends Influencing Demand for Automotive Performance Tuning and Engine Remapping Service in Korea

  • Demand rises for eco tuning service focusing on improving fuel efficiency and reducing emissions, aligning with eco-friendly automotive trends.
  • Increasing interest in personalized vehicle aesthetics drives the need for cosmetic tuning modifications and unique vehicle stylings.
  • Owners seek tuning service to revitalize older vehicles, enhance performance, and modernize features to extend their lifespan.
  • Growing preference for aftermarket parts and accessories fosters demand for tuning service tailored to accommodate these upgrades seamlessly.
  • Tuning service cater to urban drivers seeking improved city driving experiences, focusing on maneuverability, comfort, and convenience modifications.

Category-wise insights

Dominance of Passenger Cars in Korea Tuning Landscape

Passenger cars reign supreme in Korea automotive performance tuning and engine remapping service due to numerous compelling factors. Their sheer industry dominance, at 73.7% in 2025, stems from a convergence of practicality, popularity, and customization potential.

Vehicle Passenger Cars
Industry Share 73.7%

These cars, widely owned across diverse demographics, offer a broad spectrum for modification and tuning. Their widespread usage in urban and suburban settings fuels the demand for enhanced performance, driving the industry growth. The Korea automotive landscape predominantly comprises passenger cars, fostering a robust ecosystem for specialized service, thus consolidating their dominant stance within its tuning and remapping sector.

Petrol Dominance in Korea Automotive Performance Tuning Landscape

Petrol asserts its supremacy in Korea automotive performance tuning and engine remapping service industry with a commanding 52.3% share in 2025 due to multifaceted advantages. Petrol engines, renowned for their adaptability and responsiveness to modifications, allure automotive enthusiasts seeking enhanced performance.

Fuel Petrol
Industry Share 52.3%

The availability of a wide array of tuning options and aftermarket parts tailored for petrol powered vehicles further solidifies its dominance. The prevalent infrastructure supporting petrol stations and a cultural preference for petrol fueled cars fortify its industry dominance, creating a conducive environment for specialized service, thus perpetuating its leading position within its tuning and remapping landscape.

Region-wise Insights

Tailored Precision in South Jeolla Automotive Performance Enhancement Landscape

In South Jeolla automotive performance tuning and engine remapping service, recent trends signify a shift towards eco tuning solutions, aligning with environmental concerns. Enthusiasts seek tuning service focusing on improved fuel efficiency and reduced emissions without compromising performance.

There is a notable surge in demand for advanced engine remapping techniques tailored for electric vehicles. Its growing EV industry has prompted specialized tuning service to enhance EV performance and range.

Tuning for luxury and imported vehicles gains momentum, catering to discerning clientele seeking personalized modifications and performance enhancements. An emerging trend also revolves around integrating aftermarket parts and accessories, allowing enthusiasts to customize their vehicles extensively. This amalgamation of eco consciousness, EV tuning, personalized luxury modifications, and aftermarket part integration shapes the evolving landscape of automotive performance tuning and engine remapping service in South Jeolla.

Pioneering Precision and Power in North Jeolla Automotive Enhancement Landscape

Numerous emerging opportunities beckon forward thinking businesses in the North Jeolla automotive performance tuning and engine remapping service industry. A prominent avenue lies in catering to the growing demand for electric vehicle tuning expertise. With the escalating adoption of EVs, there is a burgeoning need for specialized tuning service that optimize electric motor efficiency, battery management, and overall performance.

Capitalizing on eco tuning service represents another promising opportunity. An increasing emphasis on environmentally friendly solutions presents an industry opening for tuners who can offer modifications that enhance fuel efficiency and reduce emissions without compromising power.

Targeting fleet management companies and commercial vehicle operators is an unexplored frontier. Providing tuning and remapping service tailored to enhance the performance and efficiency of these fleets can be a lucrative avenue. These opportunities highlight the potential for innovative solutions in EV tuning, eco friendly modifications, and specialized service for commercial vehicle segments in the thriving automotive performance tuning and engine remapping service industry in North Jeolla.
Competitive Landscape

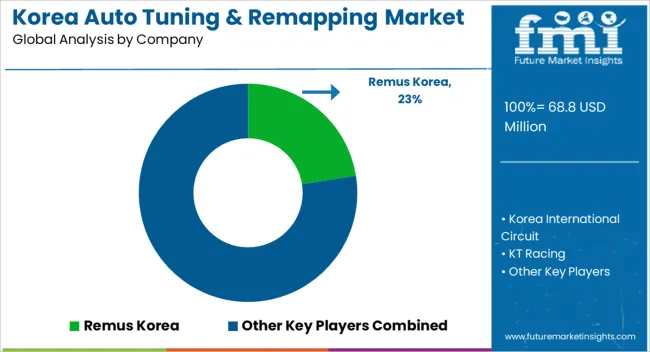
Korea Auto Tuning & Remapping Market Analysis By Company

The Korea automotive performance tuning and engine remapping service industry exemplifies a fusion of precision engineering and innovative technology. Boasting a dynamic landscape, it caters to diverse customer demands, from enhancing vehicle performance and aesthetics to addressing eco friendly solutions.

With a focus on meticulous modifications, advanced remapping techniques, and a burgeoning industry for electric vehicle tuning, its industry mirrors a commitment to delivering innovative solutions while navigating evolving regulations and customer preferences. Its continual evolution promises an exciting future, embracing advancements and meeting the evolving demands of automotive enthusiasts and commercial users.

Product Portfolio

  • Korea International Circuit offers state of the art racing facilities and events. Known for hosting premier motorsport competitions, the circuit provides world class racing experiences, attracting enthusiasts and professionals alike with its innovative infrastructure and thrilling racing events.
  • Remus Korea stands as a leading provider of high performance exhaust systems. Renowned for precision engineering and superior quality, their exhaust solutions offer enhanced vehicle dynamics, sound optimization, and improved performance, catering to automotive enthusiasts seeking top tier upgrades.
  • KT Racing specializes in aftermarket automotive parts and tuning solutions. Their portfolio includes performance enhancements, ECU remapping, and tailored modifications, and delivering optimized vehicle performance and customization options for discerning automotive enthusiasts in Korea.

Some of the Important Players in Korea Dealing with Automotive Performance Tuning and Engine Remapping Service

  • Korea International Circuit
  • Remus Korea
  • KT Racing
  • Carshop Nunu
  • TS Autohaus

Scope of the Report

Attribute Details
Estimated Industry Size in 2025 USD 68.8 million
Projected Industry Size in 2035 USD 118.0 million
Attributed CAGR between 2025 and 2035 5.5% CAGR
Historical Analysis of Demand for Automotive Performance Tuning and Engine Remapping Service in Korea Regions 2020 to 2025
Forecast Period 2025 to 2035
Report Coverage Industry size, industry trends, analysis of key factors influencing Automotive Performance Tuning and Engine Remapping Service in Korea, insights on global players and their industry strategy in Korea, ecosystem analysis of local and regional Korea providers.
Key Regions within Korea Analyzed while Studying Opportunities for Automotive Performance Tuning and Engine Remapping Service in Korea South Gyeongsang, North Jeolla, South Jeolla, Jeju
Key Companies Profiled Korea International Circuit; Remus Korea; KT Racing; Carshop Nunu; TS Autohaus

Key Segments

By Vehicle Type:

  • Passenger Cars
  • Light Commercial Vehicles
  • Heavy Commercial Vehicles

By Fuel Type:

  • Petrol
  • Diesel

By Tuning Stage:

  • Stage 1
  • Stage 2
  • Stage 3

By Tuning Method:

  • OBD Ports
  • Bench Tuning

By Application:

  • Racing
  • Fuel Economizing
  • Performance Tuning

By Region:

  • South Gyeongsang
  • North Jeolla
  • South Jeolla
  • Jeju

Frequently Asked Questions

How big is the Korea automotive performance tuning and engine remapping service industry in 2025?

The global Korea automotive performance tuning and engine remapping service industry is estimated to be valued at USD 68.8 million in 2025.

What will be the size of Korea automotive performance tuning and engine remapping service industry in 2035?

The market size for the Korea automotive performance tuning and engine remapping service industry is projected to reach USD 118.0 million by 2035.

How much will be the Korea automotive performance tuning and engine remapping service industry growth between 2025 and 2035?

The Korea automotive performance tuning and engine remapping service industry is expected to grow at a 5.5% CAGR between 2025 and 2035.

What are the key product types in the Korea automotive performance tuning and engine remapping service industry?

The key product types in Korea automotive performance tuning and engine remapping service industry are passenger cars, light commercial vehicles and heavy commercial vehicles.

Which fuel type segment to contribute significant share in the Korea automotive performance tuning and engine remapping service industry in 2025?

In terms of fuel type, petrol segment to command 61.7% share in the Korea automotive performance tuning and engine remapping service industry in 2025.

Table of Content

  1. Executive Summary
    • Global Market Outlook
    • Demand-side Trends
    • Supply-side Trends
    • Technology Roadmap Analysis
    • Analysis and Recommendations
  2. Market Overview
    • Market Coverage / Taxonomy
    • Market Definition / Scope / Limitations
  3. Market Background
    • Market Dynamics
      • Drivers
      • Restraints
      • Opportunity
      • Trends
    • Scenario Forecast
      • Demand in Optimistic Scenario
      • Demand in Likely Scenario
      • Demand in Conservative Scenario
    • Opportunity Map Analysis
    • Product Life Cycle Analysis
    • Supply Chain Analysis
    • Investment Feasibility Matrix
    • Value Chain Analysis
    • PESTLE and Porter’s Analysis
    • Regulatory Landscape
    • Regional Parent Market Outlook
    • Production and Consumption Statistics
    • Import and Export Statistics
  4. Global Analysis 2020 to 2024 and Forecast, 2025 to 2035
    • Historical Market Size Value (USD Million) Analysis, 2020 to 2024
    • Current and Future Market Size Value (USD Million) Projections, 2025 to 2035
      • Y-o-Y Growth Trend Analysis
      • Absolute $ Opportunity Analysis
  5. Global Pricing Analysis 2020 to 2024 and Forecast 2025 to 2035
  6. Global Analysis 2020 to 2024 and Forecast 2025 to 2035, By Vehicle Type
    • Introduction / Key Findings
    • Historical Market Size Value (USD Million) Analysis By Vehicle Type , 2020 to 2024
    • Current and Future Market Size Value (USD Million) Analysis and Forecast By Vehicle Type , 2025 to 2035
      • Passenger Cars
      • Light Commercial Vehicles
      • Heavy Commercial Vehicles
    • Y-o-Y Growth Trend Analysis By Vehicle Type , 2020 to 2024
    • Absolute $ Opportunity Analysis By Vehicle Type , 2025 to 2035
  7. Global Analysis 2020 to 2024 and Forecast 2025 to 2035, By Fuel Type
    • Introduction / Key Findings
    • Historical Market Size Value (USD Million) Analysis By Fuel Type, 2020 to 2024
    • Current and Future Market Size Value (USD Million) Analysis and Forecast By Fuel Type, 2025 to 2035
      • Petrol
      • Diesel
    • Y-o-Y Growth Trend Analysis By Fuel Type, 2020 to 2024
    • Absolute $ Opportunity Analysis By Fuel Type, 2025 to 2035
  8. Global Analysis 2020 to 2024 and Forecast 2025 to 2035, By Tuning Stage
    • Introduction / Key Findings
    • Historical Market Size Value (USD Million) Analysis By Tuning Stage, 2020 to 2024
    • Current and Future Market Size Value (USD Million) Analysis and Forecast By Tuning Stage, 2025 to 2035
      • Stage 1
      • Stage 2
      • Stage 3
    • Y-o-Y Growth Trend Analysis By Tuning Stage, 2020 to 2024
    • Absolute $ Opportunity Analysis By Tuning Stage, 2025 to 2035
  9. Global Analysis 2020 to 2024 and Forecast 2025 to 2035, By Tuning Method
    • Introduction / Key Findings
    • Historical Market Size Value (USD Million) Analysis By Tuning Method, 2020 to 2024
    • Current and Future Market Size Value (USD Million) Analysis and Forecast By Tuning Method, 2025 to 2035
      • OBD Ports
      • Bench Tuning
    • Y-o-Y Growth Trend Analysis By Tuning Method, 2020 to 2024
    • Absolute $ Opportunity Analysis By Tuning Method, 2025 to 2035
  10. Global Analysis 2020 to 2024 and Forecast 2025 to 2035, By Application
    • Introduction / Key Findings
    • Historical Market Size Value (USD Million) Analysis By Application, 2020 to 2024
    • Current and Future Market Size Value (USD Million) Analysis and Forecast By Application, 2025 to 2035
      • Performance Tuning
      • Racing
      • Fuel Economizing
    • Y-o-Y Growth Trend Analysis By Application, 2020 to 2024
    • Absolute $ Opportunity Analysis By Application, 2025 to 2035
  11. Global Analysis 2020 to 2024 and Forecast 2025 to 2035, By Region
    • Introduction
    • Historical Market Size Value (USD Million) Analysis By Region, 2020 to 2024
    • Current Market Size Value (USD Million) Analysis and Forecast By Region, 2025 to 2035
      • North America
      • Latin America
      • Western Europe
      • Eastern Europe
      • East Asia
      • South Asia and Pacific
      • Middle East & Africa
    • Market Attractiveness Analysis By Region
  12. North America Analysis 2020 to 2024 and Forecast 2025 to 2035, By Country
    • Historical Market Size Value (USD Million) Trend Analysis By Market Taxonomy, 2020 to 2024
    • Market Size Value (USD Million) Forecast By Market Taxonomy, 2025 to 2035
      • By Country
        • USA
        • Canada
        • Mexico
      • By Vehicle Type
      • By Fuel Type
      • By Tuning Stage
      • By Tuning Method
      • By Application
    • Market Attractiveness Analysis
      • By Country
      • By Vehicle Type
      • By Fuel Type
      • By Tuning Stage
      • By Tuning Method
      • By Application
    • Key Takeaways
  13. Latin America Analysis 2020 to 2024 and Forecast 2025 to 2035, By Country
    • Historical Market Size Value (USD Million) Trend Analysis By Market Taxonomy, 2020 to 2024
    • Market Size Value (USD Million) Forecast By Market Taxonomy, 2025 to 2035
      • By Country
        • Brazil
        • Chile
        • Rest of Latin America
      • By Vehicle Type
      • By Fuel Type
      • By Tuning Stage
      • By Tuning Method
      • By Application
    • Market Attractiveness Analysis
      • By Country
      • By Vehicle Type
      • By Fuel Type
      • By Tuning Stage
      • By Tuning Method
      • By Application
    • Key Takeaways
  14. Western Europe Analysis 2020 to 2024 and Forecast 2025 to 2035, By Country
    • Historical Market Size Value (USD Million) Trend Analysis By Market Taxonomy, 2020 to 2024
    • Market Size Value (USD Million) Forecast By Market Taxonomy, 2025 to 2035
      • By Country
        • Germany
        • UK
        • Italy
        • Spain
        • France
        • Nordic
        • BENELUX
        • Rest of Western Europe
      • By Vehicle Type
      • By Fuel Type
      • By Tuning Stage
      • By Tuning Method
      • By Application
    • Market Attractiveness Analysis
      • By Country
      • By Vehicle Type
      • By Fuel Type
      • By Tuning Stage
      • By Tuning Method
      • By Application
    • Key Takeaways
  15. Eastern Europe Analysis 2020 to 2024 and Forecast 2025 to 2035, By Country
    • Historical Market Size Value (USD Million) Trend Analysis By Market Taxonomy, 2020 to 2024
    • Market Size Value (USD Million) Forecast By Market Taxonomy, 2025 to 2035
      • By Country
        • Russia
        • Poland
        • Hungary
        • Balkan & Baltic
        • Rest of Eastern Europe
      • By Vehicle Type
      • By Fuel Type
      • By Tuning Stage
      • By Tuning Method
      • By Application
    • Market Attractiveness Analysis
      • By Country
      • By Vehicle Type
      • By Fuel Type
      • By Tuning Stage
      • By Tuning Method
      • By Application
    • Key Takeaways
  16. East Asia Analysis 2020 to 2024 and Forecast 2025 to 2035, By Country
    • Historical Market Size Value (USD Million) Trend Analysis By Market Taxonomy, 2020 to 2024
    • Market Size Value (USD Million) Forecast By Market Taxonomy, 2025 to 2035
      • By Country
        • China
        • Japan
        • South Korea
      • By Vehicle Type
      • By Fuel Type
      • By Tuning Stage
      • By Tuning Method
      • By Application
    • Market Attractiveness Analysis
      • By Country
      • By Vehicle Type
      • By Fuel Type
      • By Tuning Stage
      • By Tuning Method
      • By Application
    • Key Takeaways
  17. South Asia and Pacific Analysis 2020 to 2024 and Forecast 2025 to 2035, By Country
    • Historical Market Size Value (USD Million) Trend Analysis By Market Taxonomy, 2020 to 2024
    • Market Size Value (USD Million) Forecast By Market Taxonomy, 2025 to 2035
      • By Country
        • India
        • ASEAN
        • Australia & New Zealand
        • Rest of South Asia and Pacific
      • By Vehicle Type
      • By Fuel Type
      • By Tuning Stage
      • By Tuning Method
      • By Application
    • Market Attractiveness Analysis
      • By Country
      • By Vehicle Type
      • By Fuel Type
      • By Tuning Stage
      • By Tuning Method
      • By Application
    • Key Takeaways
  18. Middle East & Africa Analysis 2020 to 2024 and Forecast 2025 to 2035, By Country
    • Historical Market Size Value (USD Million) Trend Analysis By Market Taxonomy, 2020 to 2024
    • Market Size Value (USD Million) Forecast By Market Taxonomy, 2025 to 2035
      • By Country
        • Kingdom of Saudi Arabia
        • Other GCC Countries
        • Turkiye
        • South Africa
        • Other African Union
        • Rest of Middle East & Africa
      • By Vehicle Type
      • By Fuel Type
      • By Tuning Stage
      • By Tuning Method
      • By Application
    • Market Attractiveness Analysis
      • By Country
      • By Vehicle Type
      • By Fuel Type
      • By Tuning Stage
      • By Tuning Method
      • By Application
    • Key Takeaways
  19. Key Countries Analysis
    • USA
      • Pricing Analysis
      • Market Share Analysis, 2024
        • By Vehicle Type
        • By Fuel Type
        • By Tuning Stage
        • By Tuning Method
        • By Application
    • Canada
      • Pricing Analysis
      • Market Share Analysis, 2024
        • By Vehicle Type
        • By Fuel Type
        • By Tuning Stage
        • By Tuning Method
        • By Application
    • Mexico
      • Pricing Analysis
      • Market Share Analysis, 2024
        • By Vehicle Type
        • By Fuel Type
        • By Tuning Stage
        • By Tuning Method
        • By Application
    • Brazil
      • Pricing Analysis
      • Market Share Analysis, 2024
        • By Vehicle Type
        • By Fuel Type
        • By Tuning Stage
        • By Tuning Method
        • By Application
    • Chile
      • Pricing Analysis
      • Market Share Analysis, 2024
        • By Vehicle Type
        • By Fuel Type
        • By Tuning Stage
        • By Tuning Method
        • By Application
    • Germany
      • Pricing Analysis
      • Market Share Analysis, 2024
        • By Vehicle Type
        • By Fuel Type
        • By Tuning Stage
        • By Tuning Method
        • By Application
    • UK
      • Pricing Analysis
      • Market Share Analysis, 2024
        • By Vehicle Type
        • By Fuel Type
        • By Tuning Stage
        • By Tuning Method
        • By Application
    • Italy
      • Pricing Analysis
      • Market Share Analysis, 2024
        • By Vehicle Type
        • By Fuel Type
        • By Tuning Stage
        • By Tuning Method
        • By Application
    • Spain
      • Pricing Analysis
      • Market Share Analysis, 2024
        • By Vehicle Type
        • By Fuel Type
        • By Tuning Stage
        • By Tuning Method
        • By Application
    • France
      • Pricing Analysis
      • Market Share Analysis, 2024
        • By Vehicle Type
        • By Fuel Type
        • By Tuning Stage
        • By Tuning Method
        • By Application
    • India
      • Pricing Analysis
      • Market Share Analysis, 2024
        • By Vehicle Type
        • By Fuel Type
        • By Tuning Stage
        • By Tuning Method
        • By Application
    • ASEAN
      • Pricing Analysis
      • Market Share Analysis, 2024
        • By Vehicle Type
        • By Fuel Type
        • By Tuning Stage
        • By Tuning Method
        • By Application
    • Australia & New Zealand
      • Pricing Analysis
      • Market Share Analysis, 2024
        • By Vehicle Type
        • By Fuel Type
        • By Tuning Stage
        • By Tuning Method
        • By Application
    • China
      • Pricing Analysis
      • Market Share Analysis, 2024
        • By Vehicle Type
        • By Fuel Type
        • By Tuning Stage
        • By Tuning Method
        • By Application
    • Japan
      • Pricing Analysis
      • Market Share Analysis, 2024
        • By Vehicle Type
        • By Fuel Type
        • By Tuning Stage
        • By Tuning Method
        • By Application
    • South Korea
      • Pricing Analysis
      • Market Share Analysis, 2024
        • By Vehicle Type
        • By Fuel Type
        • By Tuning Stage
        • By Tuning Method
        • By Application
    • Russia
      • Pricing Analysis
      • Market Share Analysis, 2024
        • By Vehicle Type
        • By Fuel Type
        • By Tuning Stage
        • By Tuning Method
        • By Application
    • Poland
      • Pricing Analysis
      • Market Share Analysis, 2024
        • By Vehicle Type
        • By Fuel Type
        • By Tuning Stage
        • By Tuning Method
        • By Application
    • Hungary
      • Pricing Analysis
      • Market Share Analysis, 2024
        • By Vehicle Type
        • By Fuel Type
        • By Tuning Stage
        • By Tuning Method
        • By Application
    • Kingdom of Saudi Arabia
      • Pricing Analysis
      • Market Share Analysis, 2024
        • By Vehicle Type
        • By Fuel Type
        • By Tuning Stage
        • By Tuning Method
        • By Application
    • Turkiye
      • Pricing Analysis
      • Market Share Analysis, 2024
        • By Vehicle Type
        • By Fuel Type
        • By Tuning Stage
        • By Tuning Method
        • By Application
    • South Africa
      • Pricing Analysis
      • Market Share Analysis, 2024
        • By Vehicle Type
        • By Fuel Type
        • By Tuning Stage
        • By Tuning Method
        • By Application
  20. Market Structure Analysis
    • Competition Dashboard
    • Competition Benchmarking
    • Market Share Analysis of Top Players
      • By Regional
      • By Vehicle Type
      • By Fuel Type
      • By Tuning Stage
      • By Tuning Method
      • By Application
  21. Competition Analysis
    • Competition Deep Dive
      • Remus Korea
        • Overview
        • Product Portfolio
        • Profitability by Market Segments (Product/Age /Sales Channel/Region)
        • Sales Footprint
        • Strategy Overview
          • Marketing Strategy
          • Product Strategy
          • Channel Strategy
      • Korea International Circuit
      • KT Racing
      • Carshop Nunu
      • TS Autohaus
  22. Assumptions & Acronyms Used
  23. Research Methodology

List of Tables

  • Table 1: Global Value (USD Million) Forecast by Region, 2020-2035
  • Table 2: Global Value (USD Million) Forecast by Vehicle Type , 2020-2035
  • Table 3: Global Value (USD Million) Forecast by Fuel Type, 2020-2035
  • Table 4: Global Value (USD Million) Forecast by Tuning Stage, 2020-2035
  • Table 5: Global Value (USD Million) Forecast by Tuning Method, 2020-2035
  • Table 6: Global Value (USD Million) Forecast by Application, 2020-2035
  • Table 7: North America Value (USD Million) Forecast by Country, 2020-2035
  • Table 8: North America Value (USD Million) Forecast by Vehicle Type , 2020-2035
  • Table 9: North America Value (USD Million) Forecast by Fuel Type, 2020-2035
  • Table 10: North America Value (USD Million) Forecast by Tuning Stage, 2020-2035
  • Table 11: North America Value (USD Million) Forecast by Tuning Method, 2020-2035
  • Table 12: North America Value (USD Million) Forecast by Application, 2020-2035
  • Table 13: Latin America Value (USD Million) Forecast by Country, 2020-2035
  • Table 14: Latin America Value (USD Million) Forecast by Vehicle Type , 2020-2035
  • Table 15: Latin America Value (USD Million) Forecast by Fuel Type, 2020-2035
  • Table 16: Latin America Value (USD Million) Forecast by Tuning Stage, 2020-2035
  • Table 17: Latin America Value (USD Million) Forecast by Tuning Method, 2020-2035
  • Table 18: Latin America Value (USD Million) Forecast by Application, 2020-2035
  • Table 19: Western Europe Value (USD Million) Forecast by Country, 2020-2035
  • Table 20: Western Europe Value (USD Million) Forecast by Vehicle Type , 2020-2035
  • Table 21: Western Europe Value (USD Million) Forecast by Fuel Type, 2020-2035
  • Table 22: Western Europe Value (USD Million) Forecast by Tuning Stage, 2020-2035
  • Table 23: Western Europe Value (USD Million) Forecast by Tuning Method, 2020-2035
  • Table 24: Western Europe Value (USD Million) Forecast by Application, 2020-2035
  • Table 25: Eastern Europe Value (USD Million) Forecast by Country, 2020-2035
  • Table 26: Eastern Europe Value (USD Million) Forecast by Vehicle Type , 2020-2035
  • Table 27: Eastern Europe Value (USD Million) Forecast by Fuel Type, 2020-2035
  • Table 28: Eastern Europe Value (USD Million) Forecast by Tuning Stage, 2020-2035
  • Table 29: Eastern Europe Value (USD Million) Forecast by Tuning Method, 2020-2035
  • Table 30: Eastern Europe Value (USD Million) Forecast by Application, 2020-2035
  • Table 31: East Asia Value (USD Million) Forecast by Country, 2020-2035
  • Table 32: East Asia Value (USD Million) Forecast by Vehicle Type , 2020-2035
  • Table 33: East Asia Value (USD Million) Forecast by Fuel Type, 2020-2035
  • Table 34: East Asia Value (USD Million) Forecast by Tuning Stage, 2020-2035
  • Table 35: East Asia Value (USD Million) Forecast by Tuning Method, 2020-2035
  • Table 36: East Asia Value (USD Million) Forecast by Application, 2020-2035
  • Table 37: South Asia and Pacific Value (USD Million) Forecast by Country, 2020-2035
  • Table 38: South Asia and Pacific Value (USD Million) Forecast by Vehicle Type , 2020-2035
  • Table 39: South Asia and Pacific Value (USD Million) Forecast by Fuel Type, 2020-2035
  • Table 40: South Asia and Pacific Value (USD Million) Forecast by Tuning Stage, 2020-2035
  • Table 41: South Asia and Pacific Value (USD Million) Forecast by Tuning Method, 2020-2035
  • Table 42: South Asia and Pacific Value (USD Million) Forecast by Application, 2020-2035
  • Table 43: Middle East & Africa Value (USD Million) Forecast by Country, 2020-2035
  • Table 44: Middle East & Africa Value (USD Million) Forecast by Vehicle Type , 2020-2035
  • Table 45: Middle East & Africa Value (USD Million) Forecast by Fuel Type, 2020-2035
  • Table 46: Middle East & Africa Value (USD Million) Forecast by Tuning Stage, 2020-2035
  • Table 47: Middle East & Africa Value (USD Million) Forecast by Tuning Method, 2020-2035
  • Table 48: Middle East & Africa Value (USD Million) Forecast by Application, 2020-2035

List of Figures

  • Figure 1: Global Pricing Analysis
  • Figure 2: Global Value (USD Million) Forecast 2020-2035
  • Figure 3: Global Value Share and BPS Analysis by Vehicle Type , 2025 and 2035
  • Figure 4: Global Y-o-Y Growth Comparison by Vehicle Type , 2025-2035
  • Figure 5: Global Attractiveness Analysis by Vehicle Type
  • Figure 6: Global Value Share and BPS Analysis by Fuel Type, 2025 and 2035
  • Figure 7: Global Y-o-Y Growth Comparison by Fuel Type, 2025-2035
  • Figure 8: Global Attractiveness Analysis by Fuel Type
  • Figure 9: Global Value Share and BPS Analysis by Tuning Stage, 2025 and 2035
  • Figure 10: Global Y-o-Y Growth Comparison by Tuning Stage, 2025-2035
  • Figure 11: Global Attractiveness Analysis by Tuning Stage
  • Figure 12: Global Value Share and BPS Analysis by Tuning Method, 2025 and 2035
  • Figure 13: Global Y-o-Y Growth Comparison by Tuning Method, 2025-2035
  • Figure 14: Global Attractiveness Analysis by Tuning Method
  • Figure 15: Global Value Share and BPS Analysis by Application, 2025 and 2035
  • Figure 16: Global Y-o-Y Growth Comparison by Application, 2025-2035
  • Figure 17: Global Attractiveness Analysis by Application
  • Figure 18: Global Value (USD Million) Share and BPS Analysis by Region, 2025 and 2035
  • Figure 19: Global Y-o-Y Growth Comparison by Region, 2025-2035
  • Figure 20: Global Attractiveness Analysis by Region
  • Figure 21: North America Incremental Dollar Opportunity, 2025-2035
  • Figure 22: Latin America Incremental Dollar Opportunity, 2025-2035
  • Figure 23: Western Europe Incremental Dollar Opportunity, 2025-2035
  • Figure 24: Eastern Europe Incremental Dollar Opportunity, 2025-2035
  • Figure 25: East Asia Incremental Dollar Opportunity, 2025-2035
  • Figure 26: South Asia and Pacific Incremental Dollar Opportunity, 2025-2035
  • Figure 27: Middle East & Africa Incremental Dollar Opportunity, 2025-2035
  • Figure 28: North America Value Share and BPS Analysis by Country, 2025 and 2035
  • Figure 29: North America Value Share and BPS Analysis by Vehicle Type , 2025 and 2035
  • Figure 30: North America Y-o-Y Growth Comparison by Vehicle Type , 2025-2035
  • Figure 31: North America Attractiveness Analysis by Vehicle Type
  • Figure 32: North America Value Share and BPS Analysis by Fuel Type, 2025 and 2035
  • Figure 33: North America Y-o-Y Growth Comparison by Fuel Type, 2025-2035
  • Figure 34: North America Attractiveness Analysis by Fuel Type
  • Figure 35: North America Value Share and BPS Analysis by Tuning Stage, 2025 and 2035
  • Figure 36: North America Y-o-Y Growth Comparison by Tuning Stage, 2025-2035
  • Figure 37: North America Attractiveness Analysis by Tuning Stage
  • Figure 38: North America Value Share and BPS Analysis by Tuning Method, 2025 and 2035
  • Figure 39: North America Y-o-Y Growth Comparison by Tuning Method, 2025-2035
  • Figure 40: North America Attractiveness Analysis by Tuning Method
  • Figure 41: North America Value Share and BPS Analysis by Application, 2025 and 2035
  • Figure 42: North America Y-o-Y Growth Comparison by Application, 2025-2035
  • Figure 43: North America Attractiveness Analysis by Application
  • Figure 44: Latin America Value Share and BPS Analysis by Country, 2025 and 2035
  • Figure 45: Latin America Value Share and BPS Analysis by Vehicle Type , 2025 and 2035
  • Figure 46: Latin America Y-o-Y Growth Comparison by Vehicle Type , 2025-2035
  • Figure 47: Latin America Attractiveness Analysis by Vehicle Type
  • Figure 48: Latin America Value Share and BPS Analysis by Fuel Type, 2025 and 2035
  • Figure 49: Latin America Y-o-Y Growth Comparison by Fuel Type, 2025-2035
  • Figure 50: Latin America Attractiveness Analysis by Fuel Type
  • Figure 51: Latin America Value Share and BPS Analysis by Tuning Stage, 2025 and 2035
  • Figure 52: Latin America Y-o-Y Growth Comparison by Tuning Stage, 2025-2035
  • Figure 53: Latin America Attractiveness Analysis by Tuning Stage
  • Figure 54: Latin America Value Share and BPS Analysis by Tuning Method, 2025 and 2035
  • Figure 55: Latin America Y-o-Y Growth Comparison by Tuning Method, 2025-2035
  • Figure 56: Latin America Attractiveness Analysis by Tuning Method
  • Figure 57: Latin America Value Share and BPS Analysis by Application, 2025 and 2035
  • Figure 58: Latin America Y-o-Y Growth Comparison by Application, 2025-2035
  • Figure 59: Latin America Attractiveness Analysis by Application
  • Figure 60: Western Europe Value Share and BPS Analysis by Country, 2025 and 2035
  • Figure 61: Western Europe Value Share and BPS Analysis by Vehicle Type , 2025 and 2035
  • Figure 62: Western Europe Y-o-Y Growth Comparison by Vehicle Type , 2025-2035
  • Figure 63: Western Europe Attractiveness Analysis by Vehicle Type
  • Figure 64: Western Europe Value Share and BPS Analysis by Fuel Type, 2025 and 2035
  • Figure 65: Western Europe Y-o-Y Growth Comparison by Fuel Type, 2025-2035
  • Figure 66: Western Europe Attractiveness Analysis by Fuel Type
  • Figure 67: Western Europe Value Share and BPS Analysis by Tuning Stage, 2025 and 2035
  • Figure 68: Western Europe Y-o-Y Growth Comparison by Tuning Stage, 2025-2035
  • Figure 69: Western Europe Attractiveness Analysis by Tuning Stage
  • Figure 70: Western Europe Value Share and BPS Analysis by Tuning Method, 2025 and 2035
  • Figure 71: Western Europe Y-o-Y Growth Comparison by Tuning Method, 2025-2035
  • Figure 72: Western Europe Attractiveness Analysis by Tuning Method
  • Figure 73: Western Europe Value Share and BPS Analysis by Application, 2025 and 2035
  • Figure 74: Western Europe Y-o-Y Growth Comparison by Application, 2025-2035
  • Figure 75: Western Europe Attractiveness Analysis by Application
  • Figure 76: Eastern Europe Value Share and BPS Analysis by Country, 2025 and 2035
  • Figure 77: Eastern Europe Value Share and BPS Analysis by Vehicle Type , 2025 and 2035
  • Figure 78: Eastern Europe Y-o-Y Growth Comparison by Vehicle Type , 2025-2035
  • Figure 79: Eastern Europe Attractiveness Analysis by Vehicle Type
  • Figure 80: Eastern Europe Value Share and BPS Analysis by Fuel Type, 2025 and 2035
  • Figure 81: Eastern Europe Y-o-Y Growth Comparison by Fuel Type, 2025-2035
  • Figure 82: Eastern Europe Attractiveness Analysis by Fuel Type
  • Figure 83: Eastern Europe Value Share and BPS Analysis by Tuning Stage, 2025 and 2035
  • Figure 84: Eastern Europe Y-o-Y Growth Comparison by Tuning Stage, 2025-2035
  • Figure 85: Eastern Europe Attractiveness Analysis by Tuning Stage
  • Figure 86: Eastern Europe Value Share and BPS Analysis by Tuning Method, 2025 and 2035
  • Figure 87: Eastern Europe Y-o-Y Growth Comparison by Tuning Method, 2025-2035
  • Figure 88: Eastern Europe Attractiveness Analysis by Tuning Method
  • Figure 89: Eastern Europe Value Share and BPS Analysis by Application, 2025 and 2035
  • Figure 90: Eastern Europe Y-o-Y Growth Comparison by Application, 2025-2035
  • Figure 91: Eastern Europe Attractiveness Analysis by Application
  • Figure 92: East Asia Value Share and BPS Analysis by Country, 2025 and 2035
  • Figure 93: East Asia Value Share and BPS Analysis by Vehicle Type , 2025 and 2035
  • Figure 94: East Asia Y-o-Y Growth Comparison by Vehicle Type , 2025-2035
  • Figure 95: East Asia Attractiveness Analysis by Vehicle Type
  • Figure 96: East Asia Value Share and BPS Analysis by Fuel Type, 2025 and 2035
  • Figure 97: East Asia Y-o-Y Growth Comparison by Fuel Type, 2025-2035
  • Figure 98: East Asia Attractiveness Analysis by Fuel Type
  • Figure 99: East Asia Value Share and BPS Analysis by Tuning Stage, 2025 and 2035
  • Figure 100: East Asia Y-o-Y Growth Comparison by Tuning Stage, 2025-2035
  • Figure 101: East Asia Attractiveness Analysis by Tuning Stage
  • Figure 102: East Asia Value Share and BPS Analysis by Tuning Method, 2025 and 2035
  • Figure 103: East Asia Y-o-Y Growth Comparison by Tuning Method, 2025-2035
  • Figure 104: East Asia Attractiveness Analysis by Tuning Method
  • Figure 105: East Asia Value Share and BPS Analysis by Application, 2025 and 2035
  • Figure 106: East Asia Y-o-Y Growth Comparison by Application, 2025-2035
  • Figure 107: East Asia Attractiveness Analysis by Application
  • Figure 108: South Asia and Pacific Value Share and BPS Analysis by Country, 2025 and 2035
  • Figure 109: South Asia and Pacific Value Share and BPS Analysis by Vehicle Type , 2025 and 2035
  • Figure 110: South Asia and Pacific Y-o-Y Growth Comparison by Vehicle Type , 2025-2035
  • Figure 111: South Asia and Pacific Attractiveness Analysis by Vehicle Type
  • Figure 112: South Asia and Pacific Value Share and BPS Analysis by Fuel Type, 2025 and 2035
  • Figure 113: South Asia and Pacific Y-o-Y Growth Comparison by Fuel Type, 2025-2035
  • Figure 114: South Asia and Pacific Attractiveness Analysis by Fuel Type
  • Figure 115: South Asia and Pacific Value Share and BPS Analysis by Tuning Stage, 2025 and 2035
  • Figure 116: South Asia and Pacific Y-o-Y Growth Comparison by Tuning Stage, 2025-2035
  • Figure 117: South Asia and Pacific Attractiveness Analysis by Tuning Stage
  • Figure 118: South Asia and Pacific Value Share and BPS Analysis by Tuning Method, 2025 and 2035
  • Figure 119: South Asia and Pacific Y-o-Y Growth Comparison by Tuning Method, 2025-2035
  • Figure 120: South Asia and Pacific Attractiveness Analysis by Tuning Method
  • Figure 121: South Asia and Pacific Value Share and BPS Analysis by Application, 2025 and 2035
  • Figure 122: South Asia and Pacific Y-o-Y Growth Comparison by Application, 2025-2035
  • Figure 123: South Asia and Pacific Attractiveness Analysis by Application
  • Figure 124: Middle East & Africa Value Share and BPS Analysis by Country, 2025 and 2035
  • Figure 125: Middle East & Africa Value Share and BPS Analysis by Vehicle Type , 2025 and 2035
  • Figure 126: Middle East & Africa Y-o-Y Growth Comparison by Vehicle Type , 2025-2035
  • Figure 127: Middle East & Africa Attractiveness Analysis by Vehicle Type
  • Figure 128: Middle East & Africa Value Share and BPS Analysis by Fuel Type, 2025 and 2035
  • Figure 129: Middle East & Africa Y-o-Y Growth Comparison by Fuel Type, 2025-2035
  • Figure 130: Middle East & Africa Attractiveness Analysis by Fuel Type
  • Figure 131: Middle East & Africa Value Share and BPS Analysis by Tuning Stage, 2025 and 2035
  • Figure 132: Middle East & Africa Y-o-Y Growth Comparison by Tuning Stage, 2025-2035
  • Figure 133: Middle East & Africa Attractiveness Analysis by Tuning Stage
  • Figure 134: Middle East & Africa Value Share and BPS Analysis by Tuning Method, 2025 and 2035
  • Figure 135: Middle East & Africa Y-o-Y Growth Comparison by Tuning Method, 2025-2035
  • Figure 136: Middle East & Africa Attractiveness Analysis by Tuning Method
  • Figure 137: Middle East & Africa Value Share and BPS Analysis by Application, 2025 and 2035
  • Figure 138: Middle East & Africa Y-o-Y Growth Comparison by Application, 2025-2035
  • Figure 139: Middle East & Africa Attractiveness Analysis by Application
  • Figure 140: Global - Tier Structure Analysis
  • Figure 141: Global - Company Share Analysis
Dashboard
Dashboard
Dashboard
Dashboard
Dashboard
Dashboard

Full Research Suite comprises of:

Market outlook & trends analysis

Market outlook & trends analysis

Interviews & case studies

Interviews & case studies

Strategic recommendations

Strategic recommendations

Vendor profiles & capabilities analysis

Vendor profiles & capabilities analysis

5-year forecasts

5-year forecasts

8 regions and 60+ country-level data splits

8 regions and 60+ country-level data splits

Market segment data splits

Market segment data splits

12 months of continuous data updates

12 months of continuous data updates

DELIVERED AS:

PDF EXCEL ONLINE

Full Research Suite


$5000

$7500

$10000

Buy Report Now
Similar Industry Reports

Similar Industry Reports

Korea Smart Home Security Camera Market

Korea Smart Home Security Camera Market Size and Share Forecast Outlook 2025 to 2035

Korea Bicycle Component Aftermarket Analysis

Korea Bicycle Component Aftermarket Analysis Size and Share Forecast Outlook 2025 to 2035

Korea Non-Dairy Creamer Market

The Korea Non-Dairy Creamer Market in Korea is segmented by form, nature, flavor, type, base, end-use, packaging, distribution channel, and province through 2025 to 2035.

Korea Calcium Supplement Market

Korea Calcium Supplement Market is segmented by form,end-use, application and province through 2025 to 2035.

Korea Women’s Intimate Care Market

Korea Women’s Intimate Care Market Analysis - Size, Share & Trends 2025 to 2035

Korea Conference Room Solution Market

Korea Conference Room Solution Market Growth – Trends & Forecast 2025 to 2035

Korea Visitor Management System Market

Korea Visitor Management System Market Growth – Trends & Forecast 2025 to 2035

Korea fiber optic gyroscope market

Korea fiber optic gyroscope market Growth – Trends & Forecast 2025 to 2035

Korea Event Management Software Market

Korea Event Management Software Market Insights – Demand & Growth Forecast 2025 to 2035

Korea Submarine Cable Market

Korea Submarine Cable Market Insights – Demand & Forecast 2025 to 2035

Korea Last-mile Delivery Software Market

Last-mile Delivery Software Market in Korea – Trends & Forecast through 2035

Korea HVDC Transmission System Market

Korea HVDC Transmission System Market Trends & Forecast 2025 to 2035

Korea Base Station Antenna Market

Korea Base Station Antenna Market Growth – Trends & Forecast 2025 to 2035

Korea Smart Space Market

Smart Space Market Analysis in Korea-Demand & Growth 2025 to 2035

Korea I2C Bus Market

Korea I2C Bus Market Trends & Forecast 2025 to 2035

Korea On-shelf Availability Solution Market

Korea On-shelf Availability Solution Market – Demand & Forecast 2025 to 2035

Korea Customized Premix Market

Korea Customized Premix Market Analysis – Size, Share & Trends 2025 to 2035 

Korea Texturized Vegetable Protein Market

Korea Texturized Vegetable Protein Market Analysis – Size, Share & Trends 2025 to 2035 

Korea Avocado Oil Market

Korea Avocado Oil Market Analysis - Size, Share & Trends 2025 to 2035

Korea Wall Décor Market

Korea Wall Décor Market Analysis – Size, Share & Trends 2025 to 2035

Future Market Insights

Korea Automotive Performance Tuning and Engine Remapping Service Industry

Chat With MaRIA

Chat With

MaRIA

Hi There, I am MaRIA, Your Market Research Intelligence Assistant. How may I help you?