Reports

- Global Locations -

Headquarters

Future Market Insights, Inc.

Christiana Corporate, 200
Continental Drive, Suite 401,
Newark, Delaware - 19713,
United States

T: +1-845-579-5705

Americas

Future Market Insights, Inc.

616 Corporate Way, Suite 2-9018,
Valley Cottage, NY 10989, United States

T: +1-347-918-3531

MEA

Future Market Insights

1602-6 Jumeirah Bay X2 Tower, Plot No: JLT-PH2-X2A,
Jumeirah Lakes Towers, Dubai,
United Arab Emirates

Europe

Future Market Insights

3rd Floor, 207 Regent Street,
W1B 3HH London
United Kingdom

T: + 44 (0) 20 8123 9659
D: +44 (0) 20 3287 4268

Asia Pacific

Future Market Insights

IndiaLand Global Tech Park, Unit UG-1, Behind Grand HighStreet, Phase 1, Hinjawadi, MH, Pune – 411057, India

Analytical Study of Smart Home Security Camera in Western Europe from 2024 to 2034

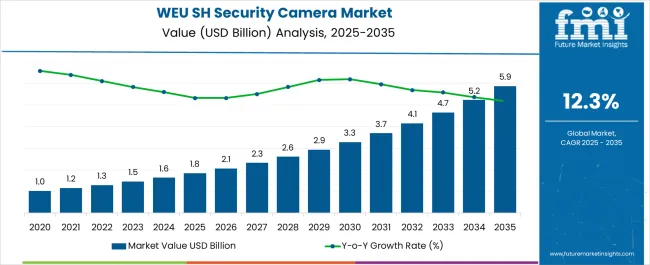
In 2024, the demand for smart home security camera in Western Europe is anticipated to reach a valuation of US$ 1,627.9 million. The industry in Western Europe is likely to register a significant CAGR of 12.9% through 2034. The increasing demand for home security and the rising incidence of uncertainty are driving the adoption of smart home security camera in Western Europe.

The growing trends of wireless camera, designed to be installed flexibly and efficiently integrated with mobile devices to keep users aware of incidents or events, are capturing consumers' desires. The smart home security camera industry in Western Europe is estimated to achieve a valuation of US$ 3,904.9 million by 2034.

Attributes Details
Industry Size of Western Europe in 2024 US$ 1,627.9 million
Expected Industry Size of Western Europe by 2034 US$ 3,904.9 million
Forecasted CAGR between 2024 to 2034 12.9%

Don't pay for what you don't need

Customize your report by selecting specific countries or regions and save 30%!

Adoption Analysis of Smart Home Security Camera in Western Europe

  • The rising privacy concerns are fueling consumers' desire to expand the smart home security industry in Western Europe. The government has imposed strict regulations to design improved and advanced smart cameras with sustainable material uses, aiming to maintain a safe environment.
  • Key companies are developing customized, flexible, and reliable cameras to capture 360-degree images and high-definition videos during the night. They are offering budget-friendly and eco-friendly cameras tailored to consumers' requirements in Western Europe. Consumers are increasingly adopting smart home security camera to monitor people's time of visit and record videos in the region.
  • Key manufacturers are launching new products and adopting various tactics to gain consumers' attention, thereby boosting the adoption of smart home security camera in the region. The growing electronics industry is providing a vast quantity and quality of products with night visuals, gaining significant popularity in their adoption in the area.

Key Trends Influencing the Demand for Smart Home Security Camera in Western Europe

  • Consumers' increasing awareness toward home safety and security is surging the demand for smart home security camera in Western Europe. These cameras monitor, capture incidents, and protect property, attracting consumers' attention.
  • Homeowners are adopting smart home security camera to integrate with real-time monitoring systems. They connect these cameras to other devices and mobiles to check every picture and event in their houses.
  • Consumers are increasing the demand for seamless and smart devices with voice assistance to enhance their work at a broader level.
  • Ongoing technologies are developing battery-powered cameras for flexibility and ease of installation at home, surging in the Western European industry. The popularity of DIY installation is also trending among consumers in Western Europe.
  • Manufacturers offer these smart home security camera with subscriptions for additional services, including expert monitoring and video history.
  • The increasing concerns toward environmental corrosion are surging the adoption of sustainability for energy-efficient and eco-friendly smart home security camera.
Sudip Saha
Sudip Saha

Principal Consultant

Talk to Analyst

Find your sweet spots for generating winning opportunities in this market.

Comparative View of Adjacent Western Europe Smart Home Security Camera Industry

The section offers a comprehensive adoption analysis of smart home security camera in Western Europe with Japan and Korea, highlighting key attributes, trends, and opportunities in the industry.

Smart Home Security Camera Adoption in Western Europe:

Attributes Western Europe Smart Home Security Camera Industry
Forecast CAGR between 2024 to 2034 12.9%
Industry Size in 2024 US$ 1,627.9 million
Key Trends Increasing demand for high-quality, flexible and advanced security camera
Key Opportunities Growing electronic sector, vast investment, and government regulations on sustainability

Smart Home Security Camera Sales Outlook in Japan:

Attributes Japan Smart Home Security Camera Industry
Forecast CAGR between 2024 to 2034 15.4%
Industry Size in 2024 US$ 554.5 million
Key Trends Rising demand for watch keeping, security and capture 24/7 audio and video
Key Opportunities Growing economies, urbanization, advanced technologies and key players

Trend Analysis of Smart Home Security Camera in Korea:

Attributes Korea Smart Home Security Camera Industry
Forecast CAGR between 2024 to 2034 17.2%
Industry Size in 2024 US$ 259.7 million
Key Trends Increasing consumers demand for home safety and security
Key Opportunities Government regulations, vast investment and innovations

Category-wise insights

Segment Industry Share in 2024
Wired Smart Camera 72.80%
Physical Stores 71.70%

Wired Smart Camera Maintains its Dominance with a Share of 72.80%

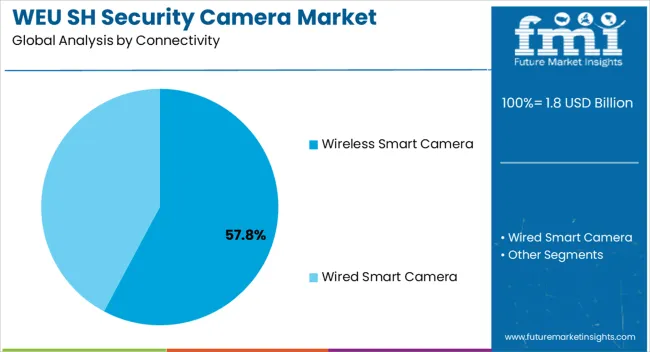
Based on connectivity, the wired smart camera segment is likely to dominate by securing a share of 72.80% in 2024. The increased consumer demand for flexibility and reliability is driving the adoption of wired smart cameras for constant network and power. These cameras enhance security with continuous monitoring systems and stable connectivity.

Wired smart cameras are widely accepted in buildings, houses, flats, and bungalows to secure every movement, and footage in low light is fueling the Western European industry. These cameras are cost-effective and easy to set up at home with minimal maintenance compared to other cameras in the region.

Physical Stores are Highly Sought-after in Western Europe

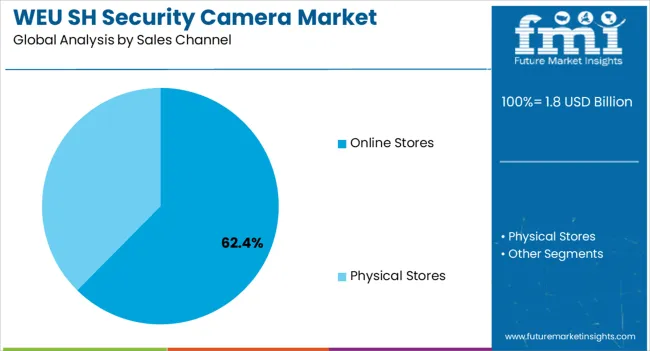
Based on sales channels, the physical stores segment is estimated to lead by securing a share of 71.70% in 2024. Consumers prefer to visit physical stores to buy products, check the quality, and receive warranty cards to build trust. They can purchase their products without delay and avoid delivery times. On the other hand, consumers have the option to return products due to dissatisfaction with the rising Western European industry.

Get the data you need at a Fraction of the cost

Personalize your report by choosing insights you need
and save 40%!

Top 3 Countries in the Western Europe Smart Home Security Camera Industry

Countries Forecast CAGR through 2034
United Kingdom 8.60%
Germany 8.90%
France 7.70%

Consumer Awareness of Security Drives the United Kingdom Industry

The United Kingdom is estimated to secure a CAGR of 8.60% in the Western European industry during the forecast period. Manufacturers have integrated the Internet of Things, automation, and remote monitoring technologies into smart home security camera to expand the United Kingdom industry. Key players, including Nest, Ring, and Arlo, are significantly increasing the demand for smart home security camera to fuel the country’s revenue.

Focus on Privacy Protection Boost the Industry Expansion in Germany

Germany is estimated to secure a CAGR of 8.90% in Western Europe during the forecast period. Growing safety and security concerns among homeowners are increasing the demand for smart home security camera in Germany. These companies enhance quality, data, and security with innovative designs to fuel the German industry.

Rising Uncertain Events Upsurge France’s Revenue

France is anticipated to capture a CAGR of 7.70% in Western Europe during the forecast period. Increasing innovative designs and advanced technologies are surging the demand for seamless smart home security camera in France. A few brands, such as Betatmo and Somfy, are popularly offering advanced products to capture revenue in the country.
Competitive Landscape

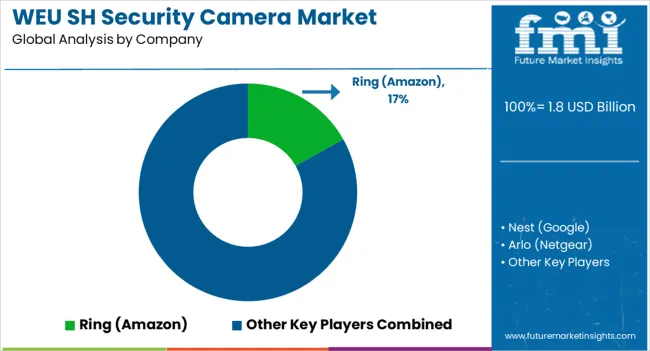
Leading players in Western Europe are heavily investing in research and development activities to offer standardized and unique products to meet end users' desires. These players offer a variety of improved and flexible products with eco-friendly practices to reduce waste. A few marketing methodologies, including mergers, collaborations, and agreements, are bringing vast industry growth.

Recent Developments in the Smart Home Security Camera in Western Europe

  • In 2021, Arlo Technologies Inc. announced its partnership with Calix to offer cost-effective subscriptions for home security camera to expand their portfolio.
  • In 2021, Vivint Smart Home Inc. announced its partnership with Freedom Forever to develop home security camera.

Scope of the Report

Attributes Details
Estimated Industry Size in 2024 US$ 1,627.9 million
Projected Industry Valuation by 2034 US$ 3,904.9 million
Value-based CAGR 2024 to 2034 12.9%
Historical Analysis of Smart Home Security Camera in Western Europe 2019 to 2023
Demand Forecast for Smart Home Security Camera in Western Europe 2024 to 2034
Report Coverage Industry Size, Industry Trends, Analysis of key factors influencing Smart Home Security Camera in Western Europe Insights on Global Players and their Industry Strategy in Western Europe, Ecosystem Analysis of Local and Regional Western Europe Providers
Key Countries Analyzed While Studying Opportunities in Smart Home Security Camera in Western Europe
  • United Kingdom
  • Germany
  • France
  • BENELUX
  • Sweden
  • Norway
  • Denmark
  • Italy
  • Spain
Key Companies Profiled
  • Nest (Google)
  • Ring (Amazon)
  • Arlo (Netgear)
  • Netatmo
  • Hikvision
  • Eufy (Anker)
  • Blink (Amazon)
  • D-Link
  • Swann
  • Somfy
  • TP-Link
  • Logitech
  • Hive (Centrica)
  • Xiaomi
  • Yale (Assa Abloy)

Key Segments

By Connectivity:

  • Wired Smart Camera
  • Wireless Smart Camera

By Sales Channel:

  • Physical Stores
  • Online Stores

By Country:

  • United Kingdom
  • Germany
  • France
  • BENELUX
  • Sweden
  • Norway
  • Denmark
  • Italy
  • Spain

Frequently Asked Questions

What is the Industry Size for Smart Home Security Camera in Western Europe?

The smart home security camera industry in Western Europe is likely to reach US$ 1,627.9 million in 2024.

What is the Future Outlook of Smart Home Security Camera in Western Europe?

The adoption of smart home security camera in Western Europe is likely to surpass US$ 3,904.9 million by 2034.

What is the Anticipated Growth Rate of Smart Home Security Camera in Western Europe?

The demand for smart home security camera in Western Europe is likely to rise at a CAGR of 12.9% from 2024 to 2034.

How are Industry Players in Western Europe Smart Home Security Camera?

Companies of all sizes are enhance customer interactions, gather feedback, and improve overall customer satisfaction.

Which Country in Western Europe is Set to Demonstrate the Maximum Demand for Smart Home Security Camera in 2024?

The United Kingdom is likely to witness rapid rise in demand for smart home security camera in Western Europe demand.

Table of Content

1. Executive Summary

    1.1. Market Outlook

    1.2. Demand-side Trends

    1.3. Supply-side Trends

    1.4. Technology Roadmap Analysis

    1.5. Analysis and Recommendations

2. Market Overview

    2.1. Market Coverage / Taxonomy

    2.2. Market Definition / Scope / Limitations

3. Market Background

    3.1. Market Dynamics

        3.1.1. Drivers

        3.1.2. Restraints

        3.1.3. Opportunity

        3.1.4. Trends

    3.2. Scenario Forecast

        3.2.1. Demand in Optimistic Scenario

        3.2.2. Demand in Likely Scenario

        3.2.3. Demand in Conservative Scenario

    3.3. Opportunity Map Analysis

    3.4. Product Life Cycle Analysis

    3.5. Supply Chain Analysis

        3.5.1. Supply Side Participants and their Roles

            3.5.1.1. Producers

            3.5.1.2. Mid-Level Participants (Traders/ Agents/ Brokers)

            3.5.1.3. Wholesalers and Distributors

        3.5.2. Value Added and Value Created at Node in the Supply Chain

        3.5.3. List of Raw Material Suppliers

        3.5.4. List of Existing and Potential Buyer’s

    3.6. Investment Feasibility Matrix

    3.7. Value Chain Analysis

        3.7.1. Profit Margin Analysis

        3.7.2. Wholesalers and Distributors

        3.7.3. Retailers

    3.8. PESTLE and Porter’s Analysis

    3.9. Regulatory Landscape

        3.9.1. By Key Regions

        3.9.2. By Key Countries

    3.10. Regional Parent Market Outlook

    3.11. Production and Consumption Statistics

    3.12. Import and Export Statistics

4. Industry Analysis and Outlook 2018 to 2022 and Forecast, 2023 to 2033

    4.1. Historical Market Size Value (US$ Million) & Volume (Units) Analysis, 2018 to 2022

    4.2. Current and Future Market Size Value (US$ Million) & Volume (Units) Projections, 2023 to 2033

        4.2.1. Y-o-Y Growth Trend Analysis

        4.2.2. Absolute $ Opportunity Analysis

5. Industry Analysis and Outlook 2018 to 2022 and Forecast 2023 to 2033, By Camera Type

    5.1. Introduction / Key Findings

    5.2. Historical Market Size Value (US$ Million) & Volume (Units) Analysis By Camera Type, 2018 to 2022

    5.3. Current and Future Market Size Value (US$ Million) & Volume (Units) Analysis and Forecast By Camera Type, 2023 to 2033

        5.3.1. Smart Video Doorbell Camera

        5.3.2. Smart Indoor Camera

        5.3.3. Smart Outdoor Camera

    5.4. Y-o-Y Growth Trend Analysis By Camera Type, 2018 to 2022

    5.5. Absolute $ Opportunity Analysis By Camera Type, 2023 to 2033

6. Industry Analysis and Outlook 2018 to 2022 and Forecast 2023 to 2033, By Connectivity

    6.1. Introduction / Key Findings

    6.2. Historical Market Size Value (US$ Million) & Volume (Units) Analysis By Connectivity, 2018 to 2022

    6.3. Current and Future Market Size Value (US$ Million) & Volume (Units) Analysis and Forecast By Connectivity, 2023 to 2033

        6.3.1. Wired Smart Camera

        6.3.2. Wireless Smart Camera

    6.4. Y-o-Y Growth Trend Analysis By Connectivity, 2018 to 2022

    6.5. Absolute $ Opportunity Analysis By Connectivity, 2023 to 2033

7. Industry Analysis and Outlook 2018 to 2022 and Forecast 2023 to 2033, By Sales Channel

    7.1. Introduction / Key Findings

    7.2. Historical Market Size Value (US$ Million) & Volume (Units) Analysis By Sales Channel, 2018 to 2022

    7.3. Current and Future Market Size Value (US$ Million) & Volume (Units) Analysis and Forecast By Sales Channel, 2023 to 2033

        7.3.1. ecommerce/Online

        7.3.2. Physical Stores/Offline

    7.4. Y-o-Y Growth Trend Analysis By Sales Channel, 2018 to 2022

    7.5. Absolute $ Opportunity Analysis By Sales Channel, 2023 to 2033

8. Industry Analysis and Outlook 2018 to 2022 and Forecast 2023 to 2033, By Country

    8.1. Introduction

    8.2. Historical Market Size Value (US$ Million) & Volume (Units) Analysis By Country, 2018 to 2022

    8.3. Current Market Size Value (US$ Million) & Volume (Units) Analysis and Forecast By Country, 2023 to 2033

        8.3.1. UK

        8.3.2. Germany

        8.3.3. Italy

        8.3.4. France

        8.3.5. Spain

        8.3.6. Rest of Western Europe

    8.4. Market Attractiveness Analysis By Country

9. UK Industry Analysis and Outlook 2018 to 2022 and Forecast 2023 to 2033, By Region

    9.1. Historical Market Size Value (US$ Million) & Volume (Units) Trend Analysis By Market Taxonomy, 2018 to 2022

    9.2. Market Size Value (US$ Million) & Volume (Units) Forecast By Market Taxonomy, 2023 to 2033

        9.2.1. By Region

            9.2.1.1. England

            9.2.1.2. Scotland

            9.2.1.3. Wales

            9.2.1.4. Northern Ireland

        9.2.2. By Camera Type

        9.2.3. By Connectivity

        9.2.4. By Sales Channel

    9.3. Market Attractiveness Analysis

        9.3.1. By Region

        9.3.2. By Camera Type

        9.3.3. By Connectivity

        9.3.4. By Sales Channel

    9.4. Key Takeaways

10. Germany Industry Analysis and Outlook 2018 to 2022 and Forecast 2023 to 2033, By Region

    10.1. Historical Market Size Value (US$ Million) & Volume (Units) Trend Analysis By Market Taxonomy, 2018 to 2022

    10.2. Market Size Value (US$ Million) & Volume (Units) Forecast By Market Taxonomy, 2023 to 2033

        10.2.1. By Region

            10.2.1.1. North-east (Germany)

            10.2.1.2. North-west (Germany)

            10.2.1.3. Central (Germany)

            10.2.1.4. South (Germany)

            10.2.1.5. Other(Germany)

        10.2.2. By Camera Type

        10.2.3. By Connectivity

        10.2.4. By Sales Channel

    10.3. Market Attractiveness Analysis

        10.3.1. By Region

        10.3.2. By Camera Type

        10.3.3. By Connectivity

        10.3.4. By Sales Channel

    10.4. Key Takeaways

11. Italy Industry Analysis and Outlook 2018 to 2022 and Forecast 2023 to 2033, By Region

    11.1. Historical Market Size Value (US$ Million) & Volume (Units) Trend Analysis By Market Taxonomy, 2018 to 2022

    11.2. Market Size Value (US$ Million) & Volume (Units) Forecast By Market Taxonomy, 2023 to 2033

        11.2.1. By Region

            11.2.1.1. North (Italy)

            11.2.1.2. Central (Italy)

            11.2.1.3. South (Italy)

            11.2.1.4. Islands (Italy)

        11.2.2. By Camera Type

        11.2.3. By Connectivity

        11.2.4. By Sales Channel

    11.3. Market Attractiveness Analysis

        11.3.1. By Region

        11.3.2. By Camera Type

        11.3.3. By Connectivity

        11.3.4. By Sales Channel

    11.4. Key Takeaways

12. France Industry Analysis and Outlook 2018 to 2022 and Forecast 2023 to 2033, By Region

    12.1. Historical Market Size Value (US$ Million) & Volume (Units) Trend Analysis By Market Taxonomy, 2018 to 2022

    12.2. Market Size Value (US$ Million) & Volume (Units) Forecast By Market Taxonomy, 2023 to 2033

        12.2.1. By Region

            12.2.1.1. Northern (France)

            12.2.1.2. Central (France)

            12.2.1.3. Southern (France)

            12.2.1.4. Eastern (France)

        12.2.2. By Camera Type

        12.2.3. By Connectivity

        12.2.4. By Sales Channel

    12.3. Market Attractiveness Analysis

        12.3.1. By Region

        12.3.2. By Camera Type

        12.3.3. By Connectivity

        12.3.4. By Sales Channel

    12.4. Key Takeaways

13. Spain Industry Analysis and Outlook 2018 to 2022 and Forecast 2023 to 2033, By Region

    13.1. Historical Market Size Value (US$ Million) & Volume (Units) Trend Analysis By Market Taxonomy, 2018 to 2022

    13.2. Market Size Value (US$ Million) & Volume (Units) Forecast By Market Taxonomy, 2023 to 2033

        13.2.1. By Region

            13.2.1.1. Basque Country

            13.2.1.2. Andalusia

            13.2.1.3. Extremadura

            13.2.1.4. Catalonia

            13.2.1.5. Valencia

            13.2.1.6. Rest of Spain

        13.2.2. By Camera Type

        13.2.3. By Connectivity

        13.2.4. By Sales Channel

    13.3. Market Attractiveness Analysis

        13.3.1. By Region

        13.3.2. By Camera Type

        13.3.3. By Connectivity

        13.3.4. By Sales Channel

    13.4. Key Takeaways

14. Rest of Industry Analysis and Outlook 2018 to 2022 and Forecast 2023 to 2033

    14.1. Historical Market Size Value (US$ Million) & Volume (Units) Trend Analysis By Market Taxonomy, 2018 to 2022

    14.2. Market Size Value (US$ Million) & Volume (Units) Forecast By Market Taxonomy, 2023 to 2033

        14.2.1. By Camera Type

        14.2.2. By Connectivity

        14.2.3. By Sales Channel

    14.3. Market Attractiveness Analysis

        14.3.1. By Camera Type

        14.3.2. By Connectivity

        14.3.3. By Sales Channel

    14.4. Key Takeaways

15. Market Structure Analysis

    15.1. Competition Dashboard

    15.2. Competition Benchmarking

    15.3. Market Share Analysis of Top Players

        15.3.1. By Regional

        15.3.2. By Camera Type

        15.3.3. By Connectivity

        15.3.4. By Sales Channel

16. Competition Analysis

    16.1. Competition Deep Dive

        16.1.1. Vivint Smart Home Inc.

            16.1.1.1. Overview

            16.1.1.2. Product Portfolio

            16.1.1.3. Profitability by Market Segments

            16.1.1.4. Sales Footprint

            16.1.1.5. Strategy Overview

                16.1.1.5.1. Marketing Strategy

                16.1.1.5.2. Product Strategy

                16.1.1.5.3. Channel Strategy

        16.1.2. ADT LLC

            16.1.2.1. Overview

            16.1.2.2. Product Portfolio

            16.1.2.3. Profitability by Market Segments

            16.1.2.4. Sales Footprint

            16.1.2.5. Strategy Overview

                16.1.2.5.1. Marketing Strategy

                16.1.2.5.2. Product Strategy

                16.1.2.5.3. Channel Strategy

        16.1.3. Simplisafe Inc.

            16.1.3.1. Overview

            16.1.3.2. Product Portfolio

            16.1.3.3. Profitability by Market Segments

            16.1.3.4. Sales Footprint

            16.1.3.5. Strategy Overview

                16.1.3.5.1. Marketing Strategy

                16.1.3.5.2. Product Strategy

                16.1.3.5.3. Channel Strategy

        16.1.4. Brinks Home Security

            16.1.4.1. Overview

            16.1.4.2. Product Portfolio

            16.1.4.3. Profitability by Market Segments

            16.1.4.4. Sales Footprint

            16.1.4.5. Strategy Overview

                16.1.4.5.1. Marketing Strategy

                16.1.4.5.2. Product Strategy

                16.1.4.5.3. Channel Strategy

        16.1.5. Skylinkhome

            16.1.5.1. Overview

            16.1.5.2. Product Portfolio

            16.1.5.3. Profitability by Market Segments

            16.1.5.4. Sales Footprint

            16.1.5.5. Strategy Overview

                16.1.5.5.1. Marketing Strategy

                16.1.5.5.2. Product Strategy

                16.1.5.5.3. Channel Strategy

        16.1.6. Samsung Electronics Co. Ltd.

            16.1.6.1. Overview

            16.1.6.2. Product Portfolio

            16.1.6.3. Profitability by Market Segments

            16.1.6.4. Sales Footprint

            16.1.6.5. Strategy Overview

                16.1.6.5.1. Marketing Strategy

                16.1.6.5.2. Product Strategy

                16.1.6.5.3. Channel Strategy

        16.1.7. Frontpoint Security Solutions LLC

            16.1.7.1. Overview

            16.1.7.2. Product Portfolio

            16.1.7.3. Profitability by Market Segments

            16.1.7.4. Sales Footprint

            16.1.7.5. Strategy Overview

                16.1.7.5.1. Marketing Strategy

                16.1.7.5.2. Product Strategy

                16.1.7.5.3. Channel Strategy

        16.1.8. Arlo Technologies Inc.

            16.1.8.1. Overview

            16.1.8.2. Product Portfolio

            16.1.8.3. Profitability by Market Segments

            16.1.8.4. Sales Footprint

            16.1.8.5. Strategy Overview

                16.1.8.5.1. Marketing Strategy

                16.1.8.5.2. Product Strategy

                16.1.8.5.3. Channel Strategy

        16.1.9. Wyze Labs Inc.

            16.1.9.1. Overview

            16.1.9.2. Product Portfolio

            16.1.9.3. Profitability by Market Segments

            16.1.9.4. Sales Footprint

            16.1.9.5. Strategy Overview

                16.1.9.5.1. Marketing Strategy

                16.1.9.5.2. Product Strategy

                16.1.9.5.3. Channel Strategy

        16.1.10. Blink

            16.1.10.1. Overview

            16.1.10.2. Product Portfolio

            16.1.10.3. Profitability by Market Segments

            16.1.10.4. Sales Footprint

            16.1.10.5. Strategy Overview

                16.1.10.5.1. Marketing Strategy

                16.1.10.5.2. Product Strategy

                16.1.10.5.3. Channel Strategy

        16.1.11. Ring LLC

            16.1.11.1. Overview

            16.1.11.2. Product Portfolio

            16.1.11.3. Profitability by Market Segments

            16.1.11.4. Sales Footprint

            16.1.11.5. Strategy Overview

                16.1.11.5.1. Marketing Strategy

                16.1.11.5.2. Product Strategy

                16.1.11.5.3. Channel Strategy

17. Assumptions & Acronyms Used

18. Research Methodology

List of Tables

Table 1: Industry Analysis and Outlook Value (US$ Million) Forecast by Country, 2018 to 2033

Table 2: Industry Analysis and Outlook Volume (Units) Forecast by Country, 2018 to 2033

Table 3: Industry Analysis and Outlook Value (US$ Million) Forecast by Camera Type, 2018 to 2033

Table 4: Industry Analysis and Outlook Volume (Units) Forecast by Camera Type, 2018 to 2033

Table 5: Industry Analysis and Outlook Value (US$ Million) Forecast by Connectivity, 2018 to 2033

Table 6: Industry Analysis and Outlook Volume (Units) Forecast by Connectivity, 2018 to 2033

Table 7: Industry Analysis and Outlook Value (US$ Million) Forecast by Sales Channel, 2018 to 2033

Table 8: Industry Analysis and Outlook Volume (Units) Forecast by Sales Channel, 2018 to 2033

Table 9: UK Industry Analysis and Outlook Value (US$ Million) Forecast By Region, 2018 to 2033

Table 10: UK Industry Analysis and Outlook Volume (Units) Forecast By Region, 2018 to 2033

Table 11: UK Industry Analysis and Outlook Value (US$ Million) Forecast by Camera Type, 2018 to 2033

Table 12: UK Industry Analysis and Outlook Volume (Units) Forecast by Camera Type, 2018 to 2033

Table 13: UK Industry Analysis and Outlook Value (US$ Million) Forecast by Connectivity, 2018 to 2033

Table 14: UK Industry Analysis and Outlook Volume (Units) Forecast by Connectivity, 2018 to 2033

Table 15: UK Industry Analysis and Outlook Value (US$ Million) Forecast by Sales Channel, 2018 to 2033

Table 16: UK Industry Analysis and Outlook Volume (Units) Forecast by Sales Channel, 2018 to 2033

Table 17: Germany Industry Analysis and Outlook Value (US$ Million) Forecast By Region, 2018 to 2033

Table 18: Germany Industry Analysis and Outlook Volume (Units) Forecast By Region, 2018 to 2033

Table 19: Germany Industry Analysis and Outlook Value (US$ Million) Forecast by Camera Type, 2018 to 2033

Table 20: Germany Industry Analysis and Outlook Volume (Units) Forecast by Camera Type, 2018 to 2033

Table 21: Germany Industry Analysis and Outlook Value (US$ Million) Forecast by Connectivity, 2018 to 2033

Table 22: Germany Industry Analysis and Outlook Volume (Units) Forecast by Connectivity, 2018 to 2033

Table 23: Germany Industry Analysis and Outlook Value (US$ Million) Forecast by Sales Channel, 2018 to 2033

Table 24: Germany Industry Analysis and Outlook Volume (Units) Forecast by Sales Channel, 2018 to 2033

Table 25: Italy Industry Analysis and Outlook Value (US$ Million) Forecast By Region, 2018 to 2033

Table 26: Italy Industry Analysis and Outlook Volume (Units) Forecast By Region, 2018 to 2033

Table 27: Italy Industry Analysis and Outlook Value (US$ Million) Forecast by Camera Type, 2018 to 2033

Table 28: Italy Industry Analysis and Outlook Volume (Units) Forecast by Camera Type, 2018 to 2033

Table 29: Italy Industry Analysis and Outlook Value (US$ Million) Forecast by Connectivity, 2018 to 2033

Table 30: Italy Industry Analysis and Outlook Volume (Units) Forecast by Connectivity, 2018 to 2033

Table 31: Italy Industry Analysis and Outlook Value (US$ Million) Forecast by Sales Channel, 2018 to 2033

Table 32: Italy Industry Analysis and Outlook Volume (Units) Forecast by Sales Channel, 2018 to 2033

Table 33: France Industry Analysis and Outlook Value (US$ Million) Forecast By Region, 2018 to 2033

Table 34: France Industry Analysis and Outlook Volume (Units) Forecast By Region, 2018 to 2033

Table 35: France Industry Analysis and Outlook Value (US$ Million) Forecast by Camera Type, 2018 to 2033

Table 36: France Industry Analysis and Outlook Volume (Units) Forecast by Camera Type, 2018 to 2033

Table 37: France Industry Analysis and Outlook Value (US$ Million) Forecast by Connectivity, 2018 to 2033

Table 38: France Industry Analysis and Outlook Volume (Units) Forecast by Connectivity, 2018 to 2033

Table 39: France Industry Analysis and Outlook Value (US$ Million) Forecast by Sales Channel, 2018 to 2033

Table 40: France Industry Analysis and Outlook Volume (Units) Forecast by Sales Channel, 2018 to 2033

Table 41: Spain Industry Analysis and Outlook Value (US$ Million) Forecast By Region, 2018 to 2033

Table 42: Spain Industry Analysis and Outlook Volume (Units) Forecast By Region, 2018 to 2033

Table 43: Spain Industry Analysis and Outlook Value (US$ Million) Forecast by Camera Type, 2018 to 2033

Table 44: Spain Industry Analysis and Outlook Volume (Units) Forecast by Camera Type, 2018 to 2033

Table 45: Spain Industry Analysis and Outlook Value (US$ Million) Forecast by Connectivity, 2018 to 2033

Table 46: Spain Industry Analysis and Outlook Volume (Units) Forecast by Connectivity, 2018 to 2033

Table 47: Spain Industry Analysis and Outlook Value (US$ Million) Forecast by Sales Channel, 2018 to 2033

Table 48: Spain Industry Analysis and Outlook Volume (Units) Forecast by Sales Channel, 2018 to 2033

Table 49: Rest of Industry Analysis and Outlook Value (US$ Million) Forecast by Camera Type, 2018 to 2033

Table 50: Rest of Industry Analysis and Outlook Volume (Units) Forecast by Camera Type, 2018 to 2033

Table 51: Rest of Industry Analysis and Outlook Value (US$ Million) Forecast by Connectivity, 2018 to 2033

Table 52: Rest of Industry Analysis and Outlook Volume (Units) Forecast by Connectivity, 2018 to 2033

Table 53: Rest of Industry Analysis and Outlook Value (US$ Million) Forecast by Sales Channel, 2018 to 2033

Table 54: Rest of Industry Analysis and Outlook Volume (Units) Forecast by Sales Channel, 2018 to 2033

List of Charts

Figure 1: Industry Analysis and Outlook Value (US$ Million) by Camera Type, 2023 to 2033

Figure 2: Industry Analysis and Outlook Value (US$ Million) by Connectivity, 2023 to 2033

Figure 3: Industry Analysis and Outlook Value (US$ Million) by Sales Channel, 2023 to 2033

Figure 4: Industry Analysis and Outlook Value (US$ Million) by Country, 2023 to 2033

Figure 5: Industry Analysis and Outlook Value (US$ Million) Analysis by Country, 2018 to 2033

Figure 6: Industry Analysis and Outlook Volume (Units) Analysis by Country, 2018 to 2033

Figure 7: Industry Analysis and Outlook Value Share (%) and BPS Analysis by Country, 2023 to 2033

Figure 8: Industry Analysis and Outlook Y-o-Y Growth (%) Projections by Country, 2023 to 2033

Figure 9: Industry Analysis and Outlook Value (US$ Million) Analysis by Camera Type, 2018 to 2033

Figure 10: Industry Analysis and Outlook Volume (Units) Analysis by Camera Type, 2018 to 2033

Figure 11: Industry Analysis and Outlook Value Share (%) and BPS Analysis by Camera Type, 2023 to 2033

Figure 12: Industry Analysis and Outlook Y-o-Y Growth (%) Projections by Camera Type, 2023 to 2033

Figure 13: Industry Analysis and Outlook Value (US$ Million) Analysis by Connectivity, 2018 to 2033

Figure 14: Industry Analysis and Outlook Volume (Units) Analysis by Connectivity, 2018 to 2033

Figure 15: Industry Analysis and Outlook Value Share (%) and BPS Analysis by Connectivity, 2023 to 2033

Figure 16: Industry Analysis and Outlook Y-o-Y Growth (%) Projections by Connectivity, 2023 to 2033

Figure 17: Industry Analysis and Outlook Value (US$ Million) Analysis by Sales Channel, 2018 to 2033

Figure 18: Industry Analysis and Outlook Volume (Units) Analysis by Sales Channel, 2018 to 2033

Figure 19: Industry Analysis and Outlook Value Share (%) and BPS Analysis by Sales Channel, 2023 to 2033

Figure 20: Industry Analysis and Outlook Y-o-Y Growth (%) Projections by Sales Channel, 2023 to 2033

Figure 21: Industry Analysis and Outlook Attractiveness by Camera Type, 2023 to 2033

Figure 22: Industry Analysis and Outlook Attractiveness by Connectivity, 2023 to 2033

Figure 23: Industry Analysis and Outlook Attractiveness by Sales Channel, 2023 to 2033

Figure 24: Industry Analysis and Outlook Attractiveness by Region, 2023 to 2033

Figure 25: UK Industry Analysis and Outlook Value (US$ Million) by Camera Type, 2023 to 2033

Figure 26: UK Industry Analysis and Outlook Value (US$ Million) by Connectivity, 2023 to 2033

Figure 27: UK Industry Analysis and Outlook Value (US$ Million) by Sales Channel, 2023 to 2033

Figure 28: UK Industry Analysis and Outlook Value (US$ Million) By Region, 2023 to 2033

Figure 29: UK Industry Analysis and Outlook Value (US$ Million) Analysis By Region, 2018 to 2033

Figure 30: UK Industry Analysis and Outlook Volume (Units) Analysis By Region, 2018 to 2033

Figure 31: UK Industry Analysis and Outlook Value Share (%) and BPS Analysis By Region, 2023 to 2033

Figure 32: UK Industry Analysis and Outlook Y-o-Y Growth (%) Projections By Region, 2023 to 2033

Figure 33: UK Industry Analysis and Outlook Value (US$ Million) Analysis by Camera Type, 2018 to 2033

Figure 34: UK Industry Analysis and Outlook Volume (Units) Analysis by Camera Type, 2018 to 2033

Figure 35: UK Industry Analysis and Outlook Value Share (%) and BPS Analysis by Camera Type, 2023 to 2033

Figure 36: UK Industry Analysis and Outlook Y-o-Y Growth (%) Projections by Camera Type, 2023 to 2033

Figure 37: UK Industry Analysis and Outlook Value (US$ Million) Analysis by Connectivity, 2018 to 2033

Figure 38: UK Industry Analysis and Outlook Volume (Units) Analysis by Connectivity, 2018 to 2033

Figure 39: UK Industry Analysis and Outlook Value Share (%) and BPS Analysis by Connectivity, 2023 to 2033

Figure 40: UK Industry Analysis and Outlook Y-o-Y Growth (%) Projections by Connectivity, 2023 to 2033

Figure 41: UK Industry Analysis and Outlook Value (US$ Million) Analysis by Sales Channel, 2018 to 2033

Figure 42: UK Industry Analysis and Outlook Volume (Units) Analysis by Sales Channel, 2018 to 2033

Figure 43: UK Industry Analysis and Outlook Value Share (%) and BPS Analysis by Sales Channel, 2023 to 2033

Figure 44: UK Industry Analysis and Outlook Y-o-Y Growth (%) Projections by Sales Channel, 2023 to 2033

Figure 45: UK Industry Analysis and Outlook Attractiveness by Camera Type, 2023 to 2033

Figure 46: UK Industry Analysis and Outlook Attractiveness by Connectivity, 2023 to 2033

Figure 47: UK Industry Analysis and Outlook Attractiveness by Sales Channel, 2023 to 2033

Figure 48: UK Industry Analysis and Outlook Attractiveness By Region, 2023 to 2033

Figure 49: Germany Industry Analysis and Outlook Value (US$ Million) by Camera Type, 2023 to 2033

Figure 50: Germany Industry Analysis and Outlook Value (US$ Million) by Connectivity, 2023 to 2033

Figure 51: Germany Industry Analysis and Outlook Value (US$ Million) by Sales Channel, 2023 to 2033

Figure 52: Germany Industry Analysis and Outlook Value (US$ Million) By Region, 2023 to 2033

Figure 53: Germany Industry Analysis and Outlook Value (US$ Million) Analysis By Region, 2018 to 2033

Figure 54: Germany Industry Analysis and Outlook Volume (Units) Analysis By Region, 2018 to 2033

Figure 55: Germany Industry Analysis and Outlook Value Share (%) and BPS Analysis By Region, 2023 to 2033

Figure 56: Germany Industry Analysis and Outlook Y-o-Y Growth (%) Projections By Region, 2023 to 2033

Figure 57: Germany Industry Analysis and Outlook Value (US$ Million) Analysis by Camera Type, 2018 to 2033

Figure 58: Germany Industry Analysis and Outlook Volume (Units) Analysis by Camera Type, 2018 to 2033

Figure 59: Germany Industry Analysis and Outlook Value Share (%) and BPS Analysis by Camera Type, 2023 to 2033

Figure 60: Germany Industry Analysis and Outlook Y-o-Y Growth (%) Projections by Camera Type, 2023 to 2033

Figure 61: Germany Industry Analysis and Outlook Value (US$ Million) Analysis by Connectivity, 2018 to 2033

Figure 62: Germany Industry Analysis and Outlook Volume (Units) Analysis by Connectivity, 2018 to 2033

Figure 63: Germany Industry Analysis and Outlook Value Share (%) and BPS Analysis by Connectivity, 2023 to 2033

Figure 64: Germany Industry Analysis and Outlook Y-o-Y Growth (%) Projections by Connectivity, 2023 to 2033

Figure 65: Germany Industry Analysis and Outlook Value (US$ Million) Analysis by Sales Channel, 2018 to 2033

Figure 66: Germany Industry Analysis and Outlook Volume (Units) Analysis by Sales Channel, 2018 to 2033

Figure 67: Germany Industry Analysis and Outlook Value Share (%) and BPS Analysis by Sales Channel, 2023 to 2033

Figure 68: Germany Industry Analysis and Outlook Y-o-Y Growth (%) Projections by Sales Channel, 2023 to 2033

Figure 69: Germany Industry Analysis and Outlook Attractiveness by Camera Type, 2023 to 2033

Figure 70: Germany Industry Analysis and Outlook Attractiveness by Connectivity, 2023 to 2033

Figure 71: Germany Industry Analysis and Outlook Attractiveness by Sales Channel, 2023 to 2033

Figure 72: Germany Industry Analysis and Outlook Attractiveness By Region, 2023 to 2033

Figure 73: Italy Industry Analysis and Outlook Value (US$ Million) by Camera Type, 2023 to 2033

Figure 74: Italy Industry Analysis and Outlook Value (US$ Million) by Connectivity, 2023 to 2033

Figure 75: Italy Industry Analysis and Outlook Value (US$ Million) by Sales Channel, 2023 to 2033

Figure 76: Italy Industry Analysis and Outlook Value (US$ Million) By Region, 2023 to 2033

Figure 77: Italy Industry Analysis and Outlook Value (US$ Million) Analysis By Region, 2018 to 2033

Figure 78: Italy Industry Analysis and Outlook Volume (Units) Analysis By Region, 2018 to 2033

Figure 79: Italy Industry Analysis and Outlook Value Share (%) and BPS Analysis By Region, 2023 to 2033

Figure 80: Italy Industry Analysis and Outlook Y-o-Y Growth (%) Projections By Region, 2023 to 2033

Figure 81: Italy Industry Analysis and Outlook Value (US$ Million) Analysis by Camera Type, 2018 to 2033

Figure 82: Italy Industry Analysis and Outlook Volume (Units) Analysis by Camera Type, 2018 to 2033

Figure 83: Italy Industry Analysis and Outlook Value Share (%) and BPS Analysis by Camera Type, 2023 to 2033

Figure 84: Italy Industry Analysis and Outlook Y-o-Y Growth (%) Projections by Camera Type, 2023 to 2033

Figure 85: Italy Industry Analysis and Outlook Value (US$ Million) Analysis by Connectivity, 2018 to 2033

Figure 86: Italy Industry Analysis and Outlook Volume (Units) Analysis by Connectivity, 2018 to 2033

Figure 87: Italy Industry Analysis and Outlook Value Share (%) and BPS Analysis by Connectivity, 2023 to 2033

Figure 88: Italy Industry Analysis and Outlook Y-o-Y Growth (%) Projections by Connectivity, 2023 to 2033

Figure 89: Italy Industry Analysis and Outlook Value (US$ Million) Analysis by Sales Channel, 2018 to 2033

Figure 90: Italy Industry Analysis and Outlook Volume (Units) Analysis by Sales Channel, 2018 to 2033

Figure 91: Italy Industry Analysis and Outlook Value Share (%) and BPS Analysis by Sales Channel, 2023 to 2033

Figure 92: Italy Industry Analysis and Outlook Y-o-Y Growth (%) Projections by Sales Channel, 2023 to 2033

Figure 93: Italy Industry Analysis and Outlook Attractiveness by Camera Type, 2023 to 2033

Figure 94: Italy Industry Analysis and Outlook Attractiveness by Connectivity, 2023 to 2033

Figure 95: Italy Industry Analysis and Outlook Attractiveness by Sales Channel, 2023 to 2033

Figure 96: Italy Industry Analysis and Outlook Attractiveness By Region, 2023 to 2033

Figure 97: France Industry Analysis and Outlook Value (US$ Million) by Camera Type, 2023 to 2033

Figure 98: France Industry Analysis and Outlook Value (US$ Million) by Connectivity, 2023 to 2033

Figure 99: France Industry Analysis and Outlook Value (US$ Million) by Sales Channel, 2023 to 2033

Figure 100: France Industry Analysis and Outlook Value (US$ Million) By Region, 2023 to 2033

Figure 101: France Industry Analysis and Outlook Value (US$ Million) Analysis By Region, 2018 to 2033

Figure 102: France Industry Analysis and Outlook Volume (Units) Analysis By Region, 2018 to 2033

Figure 103: France Industry Analysis and Outlook Value Share (%) and BPS Analysis By Region, 2023 to 2033

Figure 104: France Industry Analysis and Outlook Y-o-Y Growth (%) Projections By Region, 2023 to 2033

Figure 105: France Industry Analysis and Outlook Value (US$ Million) Analysis by Camera Type, 2018 to 2033

Figure 106: France Industry Analysis and Outlook Volume (Units) Analysis by Camera Type, 2018 to 2033

Figure 107: France Industry Analysis and Outlook Value Share (%) and BPS Analysis by Camera Type, 2023 to 2033

Figure 108: France Industry Analysis and Outlook Y-o-Y Growth (%) Projections by Camera Type, 2023 to 2033

Figure 109: France Industry Analysis and Outlook Value (US$ Million) Analysis by Connectivity, 2018 to 2033

Figure 110: France Industry Analysis and Outlook Volume (Units) Analysis by Connectivity, 2018 to 2033

Figure 111: France Industry Analysis and Outlook Value Share (%) and BPS Analysis by Connectivity, 2023 to 2033

Figure 112: France Industry Analysis and Outlook Y-o-Y Growth (%) Projections by Connectivity, 2023 to 2033

Figure 113: France Industry Analysis and Outlook Value (US$ Million) Analysis by Sales Channel, 2018 to 2033

Figure 114: France Industry Analysis and Outlook Volume (Units) Analysis by Sales Channel, 2018 to 2033

Figure 115: France Industry Analysis and Outlook Value Share (%) and BPS Analysis by Sales Channel, 2023 to 2033

Figure 116: France Industry Analysis and Outlook Y-o-Y Growth (%) Projections by Sales Channel, 2023 to 2033

Figure 117: France Industry Analysis and Outlook Attractiveness by Camera Type, 2023 to 2033

Figure 118: France Industry Analysis and Outlook Attractiveness by Connectivity, 2023 to 2033

Figure 119: France Industry Analysis and Outlook Attractiveness by Sales Channel, 2023 to 2033

Figure 120: France Industry Analysis and Outlook Attractiveness By Region, 2023 to 2033

Figure 121: Spain Industry Analysis and Outlook Value (US$ Million) by Camera Type, 2023 to 2033

Figure 122: Spain Industry Analysis and Outlook Value (US$ Million) by Connectivity, 2023 to 2033

Figure 123: Spain Industry Analysis and Outlook Value (US$ Million) by Sales Channel, 2023 to 2033

Figure 124: Spain Industry Analysis and Outlook Value (US$ Million) By Region, 2023 to 2033

Figure 125: Spain Industry Analysis and Outlook Value (US$ Million) Analysis By Region, 2018 to 2033

Figure 126: Spain Industry Analysis and Outlook Volume (Units) Analysis By Region, 2018 to 2033

Figure 127: Spain Industry Analysis and Outlook Value Share (%) and BPS Analysis By Region, 2023 to 2033

Figure 128: Spain Industry Analysis and Outlook Y-o-Y Growth (%) Projections By Region, 2023 to 2033

Figure 129: Spain Industry Analysis and Outlook Value (US$ Million) Analysis by Camera Type, 2018 to 2033

Figure 130: Spain Industry Analysis and Outlook Volume (Units) Analysis by Camera Type, 2018 to 2033

Figure 131: Spain Industry Analysis and Outlook Value Share (%) and BPS Analysis by Camera Type, 2023 to 2033

Figure 132: Spain Industry Analysis and Outlook Y-o-Y Growth (%) Projections by Camera Type, 2023 to 2033

Figure 133: Spain Industry Analysis and Outlook Value (US$ Million) Analysis by Connectivity, 2018 to 2033

Figure 134: Spain Industry Analysis and Outlook Volume (Units) Analysis by Connectivity, 2018 to 2033

Figure 135: Spain Industry Analysis and Outlook Value Share (%) and BPS Analysis by Connectivity, 2023 to 2033

Figure 136: Spain Industry Analysis and Outlook Y-o-Y Growth (%) Projections by Connectivity, 2023 to 2033

Figure 137: Spain Industry Analysis and Outlook Value (US$ Million) Analysis by Sales Channel, 2018 to 2033

Figure 138: Spain Industry Analysis and Outlook Volume (Units) Analysis by Sales Channel, 2018 to 2033

Figure 139: Spain Industry Analysis and Outlook Value Share (%) and BPS Analysis by Sales Channel, 2023 to 2033

Figure 140: Spain Industry Analysis and Outlook Y-o-Y Growth (%) Projections by Sales Channel, 2023 to 2033

Figure 141: Spain Industry Analysis and Outlook Attractiveness by Camera Type, 2023 to 2033

Figure 142: Spain Industry Analysis and Outlook Attractiveness by Connectivity, 2023 to 2033

Figure 143: Spain Industry Analysis and Outlook Attractiveness by Sales Channel, 2023 to 2033

Figure 144: Spain Industry Analysis and Outlook Attractiveness By Region, 2023 to 2033

Figure 145: Rest of Industry Analysis and Outlook Value (US$ Million) by Camera Type, 2023 to 2033

Figure 146: Rest of Industry Analysis and Outlook Value (US$ Million) by Connectivity, 2023 to 2033

Figure 147: Rest of Industry Analysis and Outlook Value (US$ Million) by Sales Channel, 2023 to 2033

Figure 148: Rest of Industry Analysis and Outlook Value (US$ Million) Analysis by Camera Type, 2018 to 2033

Figure 149: Rest of Industry Analysis and Outlook Volume (Units) Analysis by Camera Type, 2018 to 2033

Figure 150: Rest of Industry Analysis and Outlook Value Share (%) and BPS Analysis by Camera Type, 2023 to 2033

Figure 151: Rest of Industry Analysis and Outlook Y-o-Y Growth (%) Projections by Camera Type, 2023 to 2033

Figure 152: Rest of Industry Analysis and Outlook Value (US$ Million) Analysis by Connectivity, 2018 to 2033

Figure 153: Rest of Industry Analysis and Outlook Volume (Units) Analysis by Connectivity, 2018 to 2033

Figure 154: Rest of Industry Analysis and Outlook Value Share (%) and BPS Analysis by Connectivity, 2023 to 2033

Figure 155: Rest of Industry Analysis and Outlook Y-o-Y Growth (%) Projections by Connectivity, 2023 to 2033

Figure 156: Rest of Industry Analysis and Outlook Value (US$ Million) Analysis by Sales Channel, 2018 to 2033

Figure 157: Rest of Industry Analysis and Outlook Volume (Units) Analysis by Sales Channel, 2018 to 2033

Figure 158: Rest of Industry Analysis and Outlook Value Share (%) and BPS Analysis by Sales Channel, 2023 to 2033

Figure 159: Rest of Industry Analysis and Outlook Y-o-Y Growth (%) Projections by Sales Channel, 2023 to 2033

Figure 160: Rest of Industry Analysis and Outlook Attractiveness by Camera Type, 2023 to 2033

Figure 161: Rest of Industry Analysis and Outlook Attractiveness by Connectivity, 2023 to 2033

Figure 162: Rest of Industry Analysis and Outlook Attractiveness by Sales Channel, 2023 to 2033

Recommendations

Technology

Smart Home Security Camera Market

Published : February 2024

Consumer Product

Smart Home Devices Market

Published : June 2023

Technology

Smart Home Solutions Market

Published : July 2022

Explore Technology Insights

View Reports

Demand and Trends Analysis of Smart Home Security Camera in Western Europe