Reports

- Global Locations -

Headquarters

Future Market Insights, Inc.

Christiana Corporate, 200
Continental Drive, Suite 401,
Newark, Delaware - 19713,
United States

T: +1-845-579-5705

Americas

Future Market Insights, Inc.

616 Corporate Way, Suite 2-9018,
Valley Cottage, NY 10989, United States

T: +1-347-918-3531

MEA

Future Market Insights

1602-6 Jumeirah Bay X2 Tower, Plot No: JLT-PH2-X2A,
Jumeirah Lakes Towers, Dubai,
United Arab Emirates

Europe

Future Market Insights

3rd Floor, 207 Regent Street,
W1B 3HH London
United Kingdom

T: + 44 (0) 20 8123 9659
D: +44 (0) 20 3287 4268

Asia Pacific

Future Market Insights

IndiaLand Global Tech Park, Unit UG-1, Behind Grand HighStreet, Phase 1, Hinjawadi, MH, Pune – 411057, India

Forskolin Market Outlook (2022-2032)

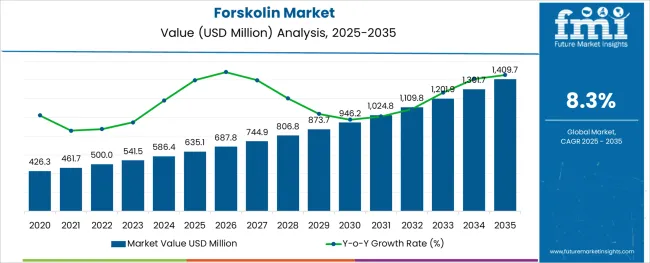
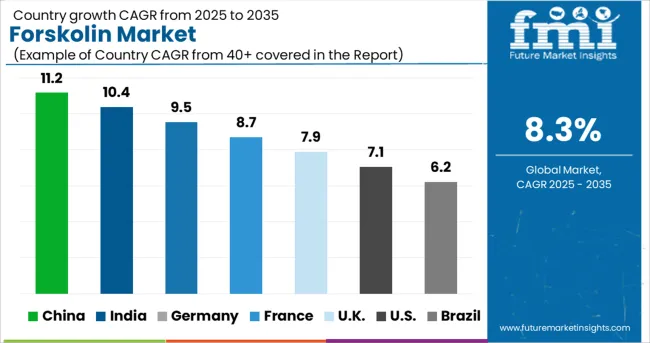
[250 Pages Report] The global forskolin market size reached around US$ 450 Mn in 2021. The demand for forskolin is expected to create an incremental opportunity of US$ 500 Mn by 2022, projecting growth at a CAGR of nearly 8% to 9% during the forecast period 2022-2032. On account of the growing application across the industries such as food & beverages, pharmaceuticals, cosmetics, and others, the sales of forskolin are estimated to surpass US$ 1000 Mn by the end of 2032.

Report Attribute Details
Forskolin Market Registered Base Value (2021) US$ 450 Million
Forskolin Market Expected Value (2022) US$ 500 Million
Forskolin Market Anticipated Value (2032) US$ 1000 Million
Forskolin Market Projected Growth Rate (2022 to 2032) 8% to 9% CAGR

Forskolin as a naturally occurring chemical compound, extracted from the roots of a tropical plant Coleus Forskohlii, commonly known as Indian coleus, related to the mint family and is found in regions such as India, Thailand, and Nepal. This functional compound in generally used in biochemistry to increase the levels of cyclic adenosine monophosphate (cAMP) and in the study of cell physiology.

Don't pay for what you don't need

Customize your report by selecting specific countries or regions and save 30%!

What are Key Governing Factors Driving the Demand in the Global Forskolin Market?

Forskolin is garnering huge popularity across the pharmaceutical & dietary industry. It is finding a wide range of applications in the production of therapeutics medications for the treatment of diseases such as asthma, owing to its antitumor, antiviral, and antimicrobial properties.

In the past few years, a substantial rise in the incidence of cardiovascular and heart-related ailments & diseases is being witnessed worldwide, resulting in creating strong demand for associated therapeutics medications & supplements. For instance, according to the Centers for Disease Control and Prevention, nearly 18.2 Mn adults between the age of 20 to 70, or around 6.7% of the total population across the U.S. are incurring coronary artery disease.

As forskolin is extensively used in the production of medication for the treatment of heart-related disease and respiratory conditions, growing burden of cardiovascular diseases is projected to create high lucrative opportunities for growth in the global market.

Which are Major Restraints Hampering the Growth in the Global Forskolin Market?

There are a number of side effects associated with the consumption of forskolin such as a decline in blood pressure, fastening heartbeats, irritation in upper respiratory tract, restlessness in breathing, enlarging of the blood vessels in the eyes, headache, and others. Growing awareness pertaining to such adverse effects on health is hampering the demand for forskolin.

Also, high cost and increasing availability of substitutes such as xantham gum are some other factors restraining the sales of forskolin in the global market.
Nandini Roy Choudhury

Principal Consultant

Talk to Analyst

Find your sweet spots for generating winning opportunities in this market.

Why is the Sales of Forskolin Accelerating in the South Asia Market?

South Asia is projected to account for the dominant share in the global forskolin market between 2022 and 2032, states Future Market Insights.

Demand for forskolin is increasing at a swift pace, owing to its growing usage in the formulation of dietary supplements & medications for the treatment of cancer, weight management, asthma, and glaucoma among others.

Hence, leading industry players are introducing novel forskolin-based dietary supplements to cater to the growing demand. For instance, in 2019, NutriJa, an Indian manufacturer of dietary supplements, announced launching a new Nutrija Coleus Forskohlii Extract for boosting metabolism. A slew of such product launches is anticipated to favor the demand in the South Asia market.
How is North America Contributing to Overall Revenue Share in the Forskolin Market?

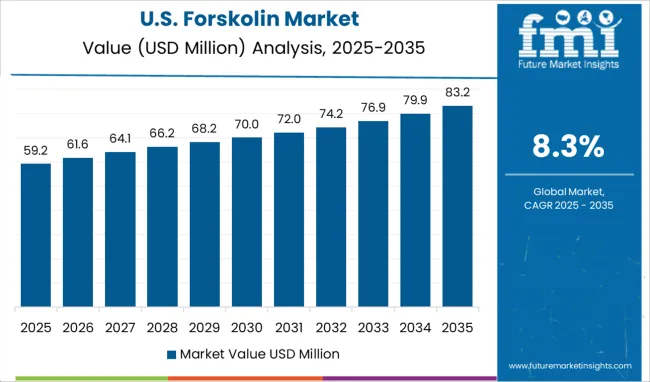
As per FMI, North America is estimated to emerge as a highly remunerative market for forskolin during the forecast period 2022-2032.

The prevalence of lifestyle diseases such as diabetes, obesity, and others is growing at a rapid pace across North America. For instance, according to the Trust for America Health, in 2020, more than 130 million people, or nearly 42.4% of the adult population in the U.S. were suffering from obesity.

Driven by its appetite suppressing, fat burning, enhancing metabolism abilities, and shifting customer preference towards all-natural & plant-based dietary supplements, forskolin is extensively being used in novel weight management supplements. Hence, growing demand for dietary supplements due to the rising burden of obesity is expected to drive the sales in the North America market.
Get the data you need at a Fraction of the cost

Personalize your report by choosing insights you need
and save 40%!

Market Competition

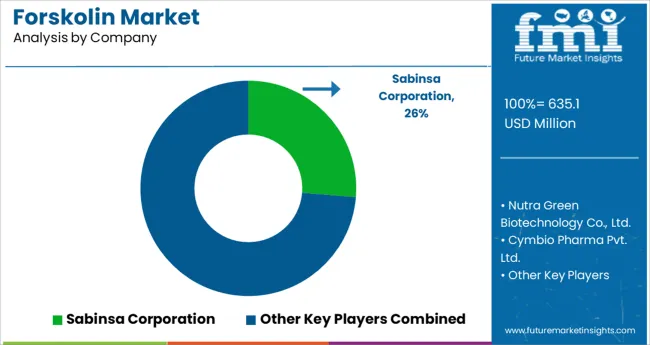
Some of the leading players in the forskolin market are Nutra Green Biotechnology Co., Ltd., Cymbio Pharma Pvt. Ltd., Bioprex Labs, Sabinsa Corporation, Wolfson Berg Limited, Varion Lifesciences Pvt. Ltd., Alchem International Limited, Flavour trove, Alexa Biotech Pvt. Ltd., and others others.

Leading participants in the forskolin market are focusing at adopting capacity expansion, collaboration, mergers & acquisitions strategies to gain edge in the highly competitive market.

Report Scope

Report Attribute Details
Growth Rate CAGR of 8% to 9% from 2022 to 2032
Base Year for Estimation 2021
Historical Data 2015 to 2020
Forecast Period 2022 to 2032
Quantitative Units Revenue in USD Million and CAGR from 2022 to 2032
Report Coverage Revenue Forecast, Volume Forecast, Company Ranking, Competitive Landscape, Growth Factors, Trends and Pricing Analysis
Segments Covered
  • Concentration
  • Application
  • End Use
  • Region
Countries Covered
  • North America
  • Latin America
  • Europe
  • East Asia
  • South Asia
  • Oceania
  • Middle East and Africa
Key Companies Profiled
Customization Available Upon Request

Key Segments Profiled in the Forskolin Market Survey

By Concentration:

  • Low Concentration (10%)
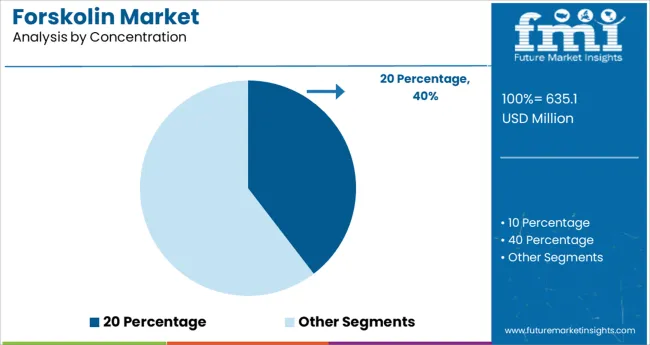
  • Medium Concentration (20% to 40%)
  • High Concentration (95%)

By Application:

  • Allergy Treatment
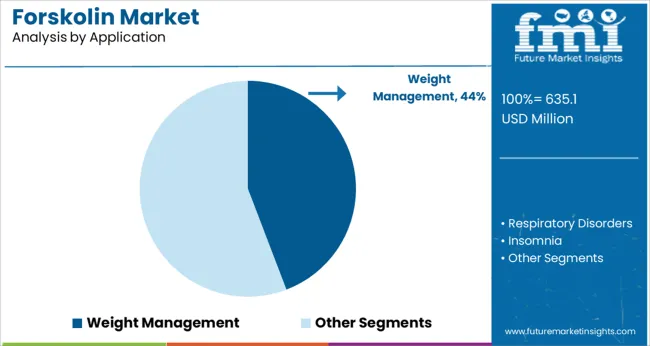
  • Weight Management
  • Respiratory Problems
  • Cardiovascular Disorders
  • Glaucoma
  • Hypothyroidism
  • Psoriasis
  • Others

By End Use:

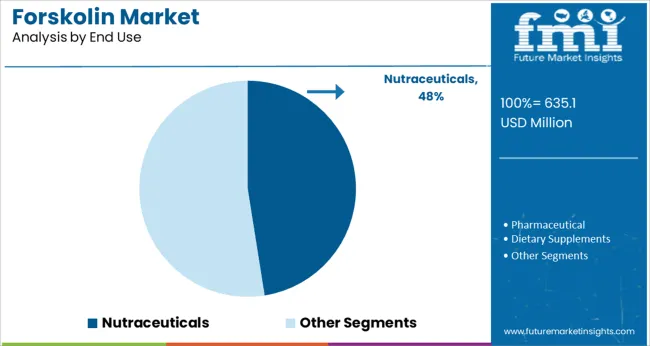
  • Nutraceuticals
  • Pharmaceutical
  • Dietary Supplements
  • Food Processing
  • Cosmetics
  • Others

By Region:

  • North America
  • Latin America
  • Europe
  • East Asia
  • South Asia
  • Oceania
  • Middle East and Africa

Frequently Asked Questions

What is the demand outlook for forskolin market until 2032?

FMI projects the demand for forskolin market to expand at 8% to 9% value CAGR over the forecast period 2022-2032.

Which region is forecast to be the most lucrative for forskolin market growth?

The forskolin market is dominated by South Asia, and this trend is projected to continue for the assessment period.

Which are some key forskolin manufacturer?

Nutra Green Biotechnology Co., Ltd., Cymbio Pharma Pvt. Ltd., Bioprex Labs, Sabinsa Corporation, Wolfson Berg Limited, Varion Lifesciences Pvt. Ltd., Alchem International Limited, Flavour trove, Alexa Biotech Pvt. Ltd., and others are some key forskolin manufacturer.

Table of Content

1. Executive Summary

    1.1. Global Market Outlook

    1.2. Demand-side Trends

    1.3. Supply-side Trends

    1.4. Technology Roadmap Analysis

    1.5. Analysis and Recommendations

2. Market Overview

    2.1. Market Coverage / Taxonomy

    2.2. Market Definition / Scope / Limitations

3. Market Background

    3.1. Market Dynamics

        3.1.1. Drivers

        3.1.2. Restraints

        3.1.3. Opportunity

        3.1.4. Trends

    3.2. Scenario Forecast

        3.2.1. Demand in Optimistic Scenario

        3.2.2. Demand in Likely Scenario

        3.2.3. Demand in Conservative Scenario

    3.3. Opportunity Map Analysis

    3.4. Product Life Cycle Analysis

    3.5. Supply Chain Analysis

        3.5.1. Supply Side Participants and their Roles

            3.5.1.1. Producers

            3.5.1.2. Mid-Level Participants (Traders/ Agents/ Brokers)

            3.5.1.3. Wholesalers and Distributors

        3.5.2. Value Added and Value Created at Node in the Supply Chain

        3.5.3. List of Raw Material Suppliers

        3.5.4. List of Existing and Potential Buyer’s

    3.6. Investment Feasibility Matrix

    3.7. Value Chain Analysis

        3.7.1. Profit Margin Analysis

        3.7.2. Wholesalers and Distributors

        3.7.3. Retailers

    3.8. PESTLE and Porter’s Analysis

    3.9. Regulatory Landscape

        3.9.1. By Key Regions

        3.9.2. By Key Countries

    3.10. Regional Parent Market Outlook

    3.11. Production and Consumption Statistics

    3.12. Import and Export Statistics

4. Global Market Analysis 2017-2021 and Forecast, 2022-2032

    4.1. Historical Market Size Value (US$ Mn) & Volume (Kg) Analysis, 2017-2021

    4.2. Current and Future Market Size Value (US$ Mn) & Volume (Kg) Projections, 2022-2032

        4.2.1. Y-o-Y Growth Trend Analysis

        4.2.2. Absolute $ Opportunity Analysis

5. Global Market Analysis 2017-2021 and Forecast 2022-2032, By Concentration

    5.1. Introduction / Key Findings

    5.2. Historical Market Size Value (US$ Mn) & Volume (Kg) Analysis By Concentration, 2017-2021

    5.3. Current and Future Market Size Value (US$ Mn) & Volume (Kg) Analysis and Forecast By Concentration, 2022-2032

        5.3.1. 10 Percentage

        5.3.2. 20 Percentage

        5.3.3. 40 Percentage

        5.3.4. 95 Percentage

    5.4. Y-o-Y Growth Trend Analysis By Concentration, 2017-2021

    5.5. Absolute $ Opportunity Analysis By Concentration, 2022-2032

Deep-dive segmentation will be available in the sample on request

6. Global Market Analysis 2017-2021 and Forecast 2022-2032, By Application

    6.1. Introduction / Key Findings

    6.2. Historical Market Size Value (US$ Mn) & Volume (Kg) Analysis By Application, 2017-2021

    6.3. Current and Future Market Size Value (US$ Mn) & Volume (Kg) Analysis and Forecast By Application, 2022-2032

        6.3.1. Weight Management

        6.3.2. Respiratory Disorders

        6.3.3. Insomnia

        6.3.4. Digestive Disorders

        6.3.5. Other Applications

    6.4. Y-o-Y Growth Trend Analysis By Application, 2017-2021

    6.5. Absolute $ Opportunity Analysis By Application, 2022-2032

Deep-dive segmentation will be available in the sample on request

7. Global Market Analysis 2017-2021 and Forecast 2022-2032, By End Use

    7.1. Introduction / Key Findings

    7.2. Historical Market Size Value (US$ Mn) & Volume (Kg) Analysis By End Use, 2017-2021

    7.3. Current and Future Market Size Value (US$ Mn) & Volume (Kg) Analysis and Forecast By End Use, 2022-2032

        7.3.1. Nutraceuticals

        7.3.2. Pharmaceutical

        7.3.3. Dietary Supplements

        7.3.4. Food Processing

        7.3.5. Cosmetics

        7.3.6. Others

    7.4. Y-o-Y Growth Trend Analysis By End Use, 2017-2021

    7.5. Absolute $ Opportunity Analysis By End Use, 2022-2032

Deep-dive segmentation will be available in the sample on request

8. Global Market Analysis 2017-2021 and Forecast 2022-2032, By Region

    8.1. Introduction

    8.2. Historical Market Size Value (US$ Mn) & Volume (Kg) Analysis By Region, 2017-2021

    8.3. Current Market Size Value (US$ Mn) & Volume (Kg) Analysis and Forecast By Region, 2022-2032

        8.3.1. North America

        8.3.2. Latin America

        8.3.3. Europe

        8.3.4. East Asia

        8.3.5. South Asia & Pacific

        8.3.6. MEA

    8.4. Market Attractiveness Analysis By Region

9. North America Market Analysis 2017-2021 and Forecast 2022-2032, By Country

    9.1. Historical Market Size Value (US$ Mn) & Volume (Kg) Trend Analysis By Market Taxonomy, 2017-2021

    9.2. Market Size Value (US$ Mn) & Volume (Kg) Forecast By Market Taxonomy, 2022-2032

        9.2.1. By Country

            9.2.1.1. U.S.

            9.2.1.2. Canada

        9.2.2. By Concentration

        9.2.3. By Application

        9.2.4. By End Use

    9.3. Market Attractiveness Analysis

        9.3.1. By Country

        9.3.2. By Concentration

        9.3.3. By Application

        9.3.4. By End Use

    9.4. Key Takeaways

10. Latin America Market Analysis 2017-2021 and Forecast 2022-2032, By Country

    10.1. Historical Market Size Value (US$ Mn) & Volume (Kg) Trend Analysis By Market Taxonomy, 2017-2021

    10.2. Market Size Value (US$ Mn) & Volume (Kg) Forecast By Market Taxonomy, 2022-2032

        10.2.1. By Country

            10.2.1.1. Brazil

            10.2.1.2. Mexico

            10.2.1.3. Rest of Latin America

        10.2.2. By Concentration

        10.2.3. By Application

        10.2.4. By End Use

    10.3. Market Attractiveness Analysis

        10.3.1. By Country

        10.3.2. By Concentration

        10.3.3. By Application

        10.3.4. By End Use

    10.4. Key Takeaways

11. Europe Market Analysis 2017-2021 and Forecast 2022-2032, By Country

    11.1. Historical Market Size Value (US$ Mn) & Volume (Kg) Trend Analysis By Market Taxonomy, 2017-2021

    11.2. Market Size Value (US$ Mn) & Volume (Kg) Forecast By Market Taxonomy, 2022-2032

        11.2.1. By Country

            11.2.1.1. Germany

            11.2.1.2. U.K.

            11.2.1.3. France

            11.2.1.4. Spain

            11.2.1.5. Italy

            11.2.1.6. Rest of Europe

        11.2.2. By Concentration

        11.2.3. By Application

        11.2.4. By End Use

    11.3. Market Attractiveness Analysis

        11.3.1. By Country

        11.3.2. By Concentration

        11.3.3. By Application

        11.3.4. By End Use

    11.4. Key Takeaways

12. East Asia Market Analysis 2017-2021 and Forecast 2022-2032, By Country

    12.1. Historical Market Size Value (US$ Mn) & Volume (Kg) Trend Analysis By Market Taxonomy, 2017-2021

    12.2. Market Size Value (US$ Mn) & Volume (Kg) Forecast By Market Taxonomy, 2022-2032

        12.2.1. By Country

            12.2.1.1. China

            12.2.1.2. Japan

            12.2.1.3. South Korea

        12.2.2. By Concentration

        12.2.3. By Application

        12.2.4. By End Use

    12.3. Market Attractiveness Analysis

        12.3.1. By Country

        12.3.2. By Concentration

        12.3.3. By Application

        12.3.4. By End Use

    12.4. Key Takeaways

13. South Asia & Pacific Market Analysis 2017-2021 and Forecast 2022-2032, By Country

    13.1. Historical Market Size Value (US$ Mn) & Volume (Kg) Trend Analysis By Market Taxonomy, 2017-2021

    13.2. Market Size Value (US$ Mn) & Volume (Kg) Forecast By Market Taxonomy, 2022-2032

        13.2.1. By Country

            13.2.1.1. India

            13.2.1.2. Thailand

            13.2.1.3. Indonesia

            13.2.1.4. Malaysia

            13.2.1.5. Singapore

            13.2.1.6. Australia

            13.2.1.7. New Zealand

            13.2.1.8. Rest of South Asia & Pacific

        13.2.2. By Concentration

        13.2.3. By Application

        13.2.4. By End Use

    13.3. Market Attractiveness Analysis

        13.3.1. By Country

        13.3.2. By Concentration

        13.3.3. By Application

        13.3.4. By End Use

    13.4. Key Takeaways

14. MEA Market Analysis 2017-2021 and Forecast 2022-2032, By Country

    14.1. Historical Market Size Value (US$ Mn) & Volume (Kg) Trend Analysis By Market Taxonomy, 2017-2021

    14.2. Market Size Value (US$ Mn) & Volume (Kg) Forecast By Market Taxonomy, 2022-2032

        14.2.1. By Country

            14.2.1.1. GCC Countries

            14.2.1.2. South Africa

            14.2.1.3. Israel

            14.2.1.4. Rest of MEA

        14.2.2. By Concentration

        14.2.3. By Application

        14.2.4. By End Use

    14.3. Market Attractiveness Analysis

        14.3.1. By Country

        14.3.2. By Concentration

        14.3.3. By Application

        14.3.4. By End Use

    14.4. Key Takeaways

15. Key Countries Market Analysis

    15.1. U.S.

        15.1.1. Pricing Analysis

        15.1.2. Market Share Analysis, 2021

            15.1.2.1. By Concentration

            15.1.2.2. By Application

            15.1.2.3. By End Use

    15.2. Canada

        15.2.1. Pricing Analysis

        15.2.2. Market Share Analysis, 2021

            15.2.2.1. By Concentration

            15.2.2.2. By Application

            15.2.2.3. By End Use

    15.3. Brazil

        15.3.1. Pricing Analysis

        15.3.2. Market Share Analysis, 2021

            15.3.2.1. By Concentration

            15.3.2.2. By Application

            15.3.2.3. By End Use

    15.4. Mexico

        15.4.1. Pricing Analysis

        15.4.2. Market Share Analysis, 2021

            15.4.2.1. By Concentration

            15.4.2.2. By Application

            15.4.2.3. By End Use

    15.5. Germany

        15.5.1. Pricing Analysis

        15.5.2. Market Share Analysis, 2021

            15.5.2.1. By Concentration

            15.5.2.2. By Application

            15.5.2.3. By End Use

    15.6. U.K.

        15.6.1. Pricing Analysis

        15.6.2. Market Share Analysis, 2021

            15.6.2.1. By Concentration

            15.6.2.2. By Application

            15.6.2.3. By End Use

    15.7. France

        15.7.1. Pricing Analysis

        15.7.2. Market Share Analysis, 2021

            15.7.2.1. By Concentration

            15.7.2.2. By Application

            15.7.2.3. By End Use

    15.8. Spain

        15.8.1. Pricing Analysis

        15.8.2. Market Share Analysis, 2021

            15.8.2.1. By Concentration

            15.8.2.2. By Application

            15.8.2.3. By End Use

    15.9. Italy

        15.9.1. Pricing Analysis

        15.9.2. Market Share Analysis, 2021

            15.9.2.1. By Concentration

            15.9.2.2. By Application

            15.9.2.3. By End Use

    15.10. China

        15.10.1. Pricing Analysis

        15.10.2. Market Share Analysis, 2021

            15.10.2.1. By Concentration

            15.10.2.2. By Application

            15.10.2.3. By End Use

    15.11. Japan

        15.11.1. Pricing Analysis

        15.11.2. Market Share Analysis, 2021

            15.11.2.1. By Concentration

            15.11.2.2. By Application

            15.11.2.3. By End Use

    15.12. South Korea

        15.12.1. Pricing Analysis

        15.12.2. Market Share Analysis, 2021

            15.12.2.1. By Concentration

            15.12.2.2. By Application

            15.12.2.3. By End Use

    15.13. India

        15.13.1. Pricing Analysis

        15.13.2. Market Share Analysis, 2021

            15.13.2.1. By Concentration

            15.13.2.2. By Application

            15.13.2.3. By End Use

    15.14. Thailand

        15.14.1. Pricing Analysis

        15.14.2. Market Share Analysis, 2021

            15.14.2.1. By Concentration

            15.14.2.2. By Application

            15.14.2.3. By End Use

    15.15. Indonesia

        15.15.1. Pricing Analysis

        15.15.2. Market Share Analysis, 2021

            15.15.2.1. By Concentration

            15.15.2.2. By Application

            15.15.2.3. By End Use

    15.16. Malaysia

        15.16.1. Pricing Analysis

        15.16.2. Market Share Analysis, 2021

            15.16.2.1. By Concentration

            15.16.2.2. By Application

            15.16.2.3. By End Use

    15.17. Singapore

        15.17.1. Pricing Analysis

        15.17.2. Market Share Analysis, 2021

            15.17.2.1. By Concentration

            15.17.2.2. By Application

            15.17.2.3. By End Use

    15.18. Australia

        15.18.1. Pricing Analysis

        15.18.2. Market Share Analysis, 2021

            15.18.2.1. By Concentration

            15.18.2.2. By Application

            15.18.2.3. By End Use

    15.19. New Zealand

        15.19.1. Pricing Analysis

        15.19.2. Market Share Analysis, 2021

            15.19.2.1. By Concentration

            15.19.2.2. By Application

            15.19.2.3. By End Use

    15.20. GCC Countries

        15.20.1. Pricing Analysis

        15.20.2. Market Share Analysis, 2021

            15.20.2.1. By Concentration

            15.20.2.2. By Application

            15.20.2.3. By End Use

    15.21. South Africa

        15.21.1. Pricing Analysis

        15.21.2. Market Share Analysis, 2021

            15.21.2.1. By Concentration

            15.21.2.2. By Application

            15.21.2.3. By End Use

    15.22. Israel

        15.22.1. Pricing Analysis

        15.22.2. Market Share Analysis, 2021

            15.22.2.1. By Concentration

            15.22.2.2. By Application

            15.22.2.3. By End Use

16. Market Structure Analysis

    16.1. Competition Dashboard

    16.2. Competition Benchmarking

    16.3. Market Share Analysis of Top Players

        16.3.1. By Regional

        16.3.2. By Concentration

        16.3.3. By Application

        16.3.4. By End Use

17. Competition Analysis

    17.1. Competition Deep Dive

        17.1.1. Nutra Green Biotechnology Co., Ltd.

            17.1.1.1. Overview

            17.1.1.2. Product Portfolio

            17.1.1.3. Profitability by Market Segments

            17.1.1.4. Sales Footprint

            17.1.1.5. Strategy Overview

                17.1.1.5.1. Marketing Strategy

                17.1.1.5.2. Product Strategy

                17.1.1.5.3. Channel Strategy

        17.1.2. Cymbio Pharma Pvt. Ltd.

            17.1.2.1. Overview

            17.1.2.2. Product Portfolio

            17.1.2.3. Profitability by Market Segments

            17.1.2.4. Sales Footprint

            17.1.2.5. Strategy Overview

                17.1.2.5.1. Marketing Strategy

                17.1.2.5.2. Product Strategy

                17.1.2.5.3. Channel Strategy

        17.1.3. Bioprex Labs

            17.1.3.1. Overview

            17.1.3.2. Product Portfolio

            17.1.3.3. Profitability by Market Segments

            17.1.3.4. Sales Footprint

            17.1.3.5. Strategy Overview

                17.1.3.5.1. Marketing Strategy

                17.1.3.5.2. Product Strategy

                17.1.3.5.3. Channel Strategy

        17.1.4. Sabinsa Corporation

            17.1.4.1. Overview

            17.1.4.2. Product Portfolio

            17.1.4.3. Profitability by Market Segments

            17.1.4.4. Sales Footprint

            17.1.4.5. Strategy Overview

                17.1.4.5.1. Marketing Strategy

                17.1.4.5.2. Product Strategy

                17.1.4.5.3. Channel Strategy

        17.1.5. Wolfson Berg Limited

            17.1.5.1. Overview

            17.1.5.2. Product Portfolio

            17.1.5.3. Profitability by Market Segments

            17.1.5.4. Sales Footprint

            17.1.5.5. Strategy Overview

                17.1.5.5.1. Marketing Strategy

                17.1.5.5.2. Product Strategy

                17.1.5.5.3. Channel Strategy

        17.1.6. Varion Lifesciences Pvt. Ltd.

            17.1.6.1. Overview

            17.1.6.2. Product Portfolio

            17.1.6.3. Profitability by Market Segments

            17.1.6.4. Sales Footprint

            17.1.6.5. Strategy Overview

                17.1.6.5.1. Marketing Strategy

                17.1.6.5.2. Product Strategy

                17.1.6.5.3. Channel Strategy

        17.1.7. Alchem International Limited

            17.1.7.1. Overview

            17.1.7.2. Product Portfolio

            17.1.7.3. Profitability by Market Segments

            17.1.7.4. Sales Footprint

            17.1.7.5. Strategy Overview

                17.1.7.5.1. Marketing Strategy

                17.1.7.5.2. Product Strategy

                17.1.7.5.3. Channel Strategy

        17.1.8. Flavour Trove

            17.1.8.1. Overview

            17.1.8.2. Product Portfolio

            17.1.8.3. Profitability by Market Segments

            17.1.8.4. Sales Footprint

            17.1.8.5. Strategy Overview

                17.1.8.5.1. Marketing Strategy

                17.1.8.5.2. Product Strategy

                17.1.8.5.3. Channel Strategy

18. Assumptions & Acronyms Used

19. Research Methodology

Don't pay for what you don't need

Customize your report by selecting specific countries or regions and save 30%!

List of Tables

Table 1: Global Market Value (US$ Mn) Forecast by Region, 2017-2032

Table 2: Global Market Volume (Kg) Forecast by Region, 2017-2032

Table 3: Global Market Value (US$ Mn) Forecast by Concentration, 2017-2032

Table 4: Global Market Volume (Kg) Forecast by Concentration, 2017-2032

Table 5: Global Market Value (US$ Mn) Forecast by Application, 2017-2032

Table 6: Global Market Volume (Kg) Forecast by Application, 2017-2032

Table 7: Global Market Value (US$ Mn) Forecast by End Use, 2017-2032

Table 8: Global Market Volume (Kg) Forecast by End Use, 2017-2032

Table 9: North America Market Value (US$ Mn) Forecast by Country, 2017-2032

Table 10: North America Market Volume (Kg) Forecast by Country, 2017-2032

Table 11: North America Market Value (US$ Mn) Forecast by Concentration, 2017-2032

Table 12: North America Market Volume (Kg) Forecast by Concentration, 2017-2032

Table 13: North America Market Value (US$ Mn) Forecast by Application, 2017-2032

Table 14: North America Market Volume (Kg) Forecast by Application, 2017-2032

Table 15: North America Market Value (US$ Mn) Forecast by End Use, 2017-2032

Table 16: North America Market Volume (Kg) Forecast by End Use, 2017-2032

Table 17: Latin America Market Value (US$ Mn) Forecast by Country, 2017-2032

Table 18: Latin America Market Volume (Kg) Forecast by Country, 2017-2032

Table 19: Latin America Market Value (US$ Mn) Forecast by Concentration, 2017-2032

Table 20: Latin America Market Volume (Kg) Forecast by Concentration, 2017-2032

Table 21: Latin America Market Value (US$ Mn) Forecast by Application, 2017-2032

Table 22: Latin America Market Volume (Kg) Forecast by Application, 2017-2032

Table 23: Latin America Market Value (US$ Mn) Forecast by End Use, 2017-2032

Table 24: Latin America Market Volume (Kg) Forecast by End Use, 2017-2032

Table 25: Europe Market Value (US$ Mn) Forecast by Country, 2017-2032

Table 26: Europe Market Volume (Kg) Forecast by Country, 2017-2032

Table 27: Europe Market Value (US$ Mn) Forecast by Concentration, 2017-2032

Table 28: Europe Market Volume (Kg) Forecast by Concentration, 2017-2032

Table 29: Europe Market Value (US$ Mn) Forecast by Application, 2017-2032

Table 30: Europe Market Volume (Kg) Forecast by Application, 2017-2032

Table 31: Europe Market Value (US$ Mn) Forecast by End Use, 2017-2032

Table 32: Europe Market Volume (Kg) Forecast by End Use, 2017-2032

Table 33: East Asia Market Value (US$ Mn) Forecast by Country, 2017-2032

Table 34: East Asia Market Volume (Kg) Forecast by Country, 2017-2032

Table 35: East Asia Market Value (US$ Mn) Forecast by Concentration, 2017-2032

Table 36: East Asia Market Volume (Kg) Forecast by Concentration, 2017-2032

Table 37: East Asia Market Value (US$ Mn) Forecast by Application, 2017-2032

Table 38: East Asia Market Volume (Kg) Forecast by Application, 2017-2032

Table 39: East Asia Market Value (US$ Mn) Forecast by End Use, 2017-2032

Table 40: East Asia Market Volume (Kg) Forecast by End Use, 2017-2032

Table 41: South Asia & Pacific Market Value (US$ Mn) Forecast by Country, 2017-2032

Table 42: South Asia & Pacific Market Volume (Kg) Forecast by Country, 2017-2032

Table 43: South Asia & Pacific Market Value (US$ Mn) Forecast by Concentration, 2017-2032

Table 44: South Asia & Pacific Market Volume (Kg) Forecast by Concentration, 2017-2032

Table 45: South Asia & Pacific Market Value (US$ Mn) Forecast by Application, 2017-2032

Table 46: South Asia & Pacific Market Volume (Kg) Forecast by Application, 2017-2032

Table 47: South Asia & Pacific Market Value (US$ Mn) Forecast by End Use, 2017-2032

Table 48: South Asia & Pacific Market Volume (Kg) Forecast by End Use, 2017-2032

Table 49: MEA Market Value (US$ Mn) Forecast by Country, 2017-2032

Table 50: MEA Market Volume (Kg) Forecast by Country, 2017-2032

Table 51: MEA Market Value (US$ Mn) Forecast by Concentration, 2017-2032

Table 52: MEA Market Volume (Kg) Forecast by Concentration, 2017-2032

Table 53: MEA Market Value (US$ Mn) Forecast by Application, 2017-2032

Table 54: MEA Market Volume (Kg) Forecast by Application, 2017-2032

Table 55: MEA Market Value (US$ Mn) Forecast by End Use, 2017-2032

Table 56: MEA Market Volume (Kg) Forecast by End Use, 2017-2032
Nandini Roy Choudhury

Principal Consultant

Talk to Analyst

Find your sweet spots for generating winning opportunities in this market.

List of Charts

Figure 1: Global Market Value (US$ Mn) by Concentration, 2022-2032

Figure 2: Global Market Value (US$ Mn) by Application, 2022-2032

Figure 3: Global Market Value (US$ Mn) by End Use, 2022-2032

Figure 4: Global Market Value (US$ Mn) by Region, 2022-2032

Figure 5: Global Market Value (US$ Mn) Analysis by Region, 2017-2032

Figure 6: Global Market Volume (Kg) Analysis by Region, 2017-2032

Figure 7: Global Market Value Share (%) and BPS Analysis by Region, 2022-2032

Figure 8: Global Market Y-o-Y Growth (%) Projections by Region, 2022-2032

Figure 9: Global Market Value (US$ Mn) Analysis by Concentration, 2017-2032

Figure 10: Global Market Volume (Kg) Analysis by Concentration, 2017-2032

Figure 11: Global Market Value Share (%) and BPS Analysis by Concentration, 2022-2032

Figure 12: Global Market Y-o-Y Growth (%) Projections by Concentration, 2022-2032

Figure 13: Global Market Value (US$ Mn) Analysis by Application, 2017-2032

Figure 14: Global Market Volume (Kg) Analysis by Application, 2017-2032

Figure 15: Global Market Value Share (%) and BPS Analysis by Application, 2022-2032

Figure 16: Global Market Y-o-Y Growth (%) Projections by Application, 2022-2032

Figure 17: Global Market Value (US$ Mn) Analysis by End Use, 2017-2032

Figure 18: Global Market Volume (Kg) Analysis by End Use, 2017-2032

Figure 19: Global Market Value Share (%) and BPS Analysis by End Use, 2022-2032

Figure 20: Global Market Y-o-Y Growth (%) Projections by End Use, 2022-2032

Figure 21: Global Market Attractiveness by Concentration, 2022-2032

Figure 22: Global Market Attractiveness by Application, 2022-2032

Figure 23: Global Market Attractiveness by End Use, 2022-2032

Figure 24: Global Market Attractiveness by Region, 2022-2032

Figure 25: North America Market Value (US$ Mn) by Concentration, 2022-2032

Figure 26: North America Market Value (US$ Mn) by Application, 2022-2032

Figure 27: North America Market Value (US$ Mn) by End Use, 2022-2032

Figure 28: North America Market Value (US$ Mn) by Country, 2022-2032

Figure 29: North America Market Value (US$ Mn) Analysis by Country, 2017-2032

Figure 30: North America Market Volume (Kg) Analysis by Country, 2017-2032

Figure 31: North America Market Value Share (%) and BPS Analysis by Country, 2022-2032

Figure 32: North America Market Y-o-Y Growth (%) Projections by Country, 2022-2032

Figure 33: North America Market Value (US$ Mn) Analysis by Concentration, 2017-2032

Figure 34: North America Market Volume (Kg) Analysis by Concentration, 2017-2032

Figure 35: North America Market Value Share (%) and BPS Analysis by Concentration, 2022-2032

Figure 36: North America Market Y-o-Y Growth (%) Projections by Concentration, 2022-2032

Figure 37: North America Market Value (US$ Mn) Analysis by Application, 2017-2032

Figure 38: North America Market Volume (Kg) Analysis by Application, 2017-2032

Figure 39: North America Market Value Share (%) and BPS Analysis by Application, 2022-2032

Figure 40: North America Market Y-o-Y Growth (%) Projections by Application, 2022-2032

Figure 41: North America Market Value (US$ Mn) Analysis by End Use, 2017-2032

Figure 42: North America Market Volume (Kg) Analysis by End Use, 2017-2032

Figure 43: North America Market Value Share (%) and BPS Analysis by End Use, 2022-2032

Figure 44: North America Market Y-o-Y Growth (%) Projections by End Use, 2022-2032

Figure 45: North America Market Attractiveness by Concentration, 2022-2032

Figure 46: North America Market Attractiveness by Application, 2022-2032

Figure 47: North America Market Attractiveness by End Use, 2022-2032

Figure 48: North America Market Attractiveness by Country, 2022-2032

Figure 49: Latin America Market Value (US$ Mn) by Concentration, 2022-2032

Figure 50: Latin America Market Value (US$ Mn) by Application, 2022-2032

Figure 51: Latin America Market Value (US$ Mn) by End Use, 2022-2032

Figure 52: Latin America Market Value (US$ Mn) by Country, 2022-2032

Figure 53: Latin America Market Value (US$ Mn) Analysis by Country, 2017-2032

Figure 54: Latin America Market Volume (Kg) Analysis by Country, 2017-2032

Figure 55: Latin America Market Value Share (%) and BPS Analysis by Country, 2022-2032

Figure 56: Latin America Market Y-o-Y Growth (%) Projections by Country, 2022-2032

Figure 57: Latin America Market Value (US$ Mn) Analysis by Concentration, 2017-2032

Figure 58: Latin America Market Volume (Kg) Analysis by Concentration, 2017-2032

Figure 59: Latin America Market Value Share (%) and BPS Analysis by Concentration, 2022-2032

Figure 60: Latin America Market Y-o-Y Growth (%) Projections by Concentration, 2022-2032

Figure 61: Latin America Market Value (US$ Mn) Analysis by Application, 2017-2032

Figure 62: Latin America Market Volume (Kg) Analysis by Application, 2017-2032

Figure 63: Latin America Market Value Share (%) and BPS Analysis by Application, 2022-2032

Figure 64: Latin America Market Y-o-Y Growth (%) Projections by Application, 2022-2032

Figure 65: Latin America Market Value (US$ Mn) Analysis by End Use, 2017-2032

Figure 66: Latin America Market Volume (Kg) Analysis by End Use, 2017-2032

Figure 67: Latin America Market Value Share (%) and BPS Analysis by End Use, 2022-2032

Figure 68: Latin America Market Y-o-Y Growth (%) Projections by End Use, 2022-2032

Figure 69: Latin America Market Attractiveness by Concentration, 2022-2032

Figure 70: Latin America Market Attractiveness by Application, 2022-2032

Figure 71: Latin America Market Attractiveness by End Use, 2022-2032

Figure 72: Latin America Market Attractiveness by Country, 2022-2032

Figure 73: Europe Market Value (US$ Mn) by Concentration, 2022-2032

Figure 74: Europe Market Value (US$ Mn) by Application, 2022-2032

Figure 75: Europe Market Value (US$ Mn) by End Use, 2022-2032

Figure 76: Europe Market Value (US$ Mn) by Country, 2022-2032

Figure 77: Europe Market Value (US$ Mn) Analysis by Country, 2017-2032

Figure 78: Europe Market Volume (Kg) Analysis by Country, 2017-2032

Figure 79: Europe Market Value Share (%) and BPS Analysis by Country, 2022-2032

Figure 80: Europe Market Y-o-Y Growth (%) Projections by Country, 2022-2032

Figure 81: Europe Market Value (US$ Mn) Analysis by Concentration, 2017-2032

Figure 82: Europe Market Volume (Kg) Analysis by Concentration, 2017-2032

Figure 83: Europe Market Value Share (%) and BPS Analysis by Concentration, 2022-2032

Figure 84: Europe Market Y-o-Y Growth (%) Projections by Concentration, 2022-2032

Figure 85: Europe Market Value (US$ Mn) Analysis by Application, 2017-2032

Figure 86: Europe Market Volume (Kg) Analysis by Application, 2017-2032

Figure 87: Europe Market Value Share (%) and BPS Analysis by Application, 2022-2032

Figure 88: Europe Market Y-o-Y Growth (%) Projections by Application, 2022-2032

Figure 89: Europe Market Value (US$ Mn) Analysis by End Use, 2017-2032

Figure 90: Europe Market Volume (Kg) Analysis by End Use, 2017-2032

Figure 91: Europe Market Value Share (%) and BPS Analysis by End Use, 2022-2032

Figure 92: Europe Market Y-o-Y Growth (%) Projections by End Use, 2022-2032

Figure 93: Europe Market Attractiveness by Concentration, 2022-2032

Figure 94: Europe Market Attractiveness by Application, 2022-2032

Figure 95: Europe Market Attractiveness by End Use, 2022-2032

Figure 96: Europe Market Attractiveness by Country, 2022-2032

Figure 97: East Asia Market Value (US$ Mn) by Concentration, 2022-2032

Figure 98: East Asia Market Value (US$ Mn) by Application, 2022-2032

Figure 99: East Asia Market Value (US$ Mn) by End Use, 2022-2032

Figure 100: East Asia Market Value (US$ Mn) by Country, 2022-2032

Figure 101: East Asia Market Value (US$ Mn) Analysis by Country, 2017-2032

Figure 102: East Asia Market Volume (Kg) Analysis by Country, 2017-2032

Figure 103: East Asia Market Value Share (%) and BPS Analysis by Country, 2022-2032

Figure 104: East Asia Market Y-o-Y Growth (%) Projections by Country, 2022-2032

Figure 105: East Asia Market Value (US$ Mn) Analysis by Concentration, 2017-2032

Figure 106: East Asia Market Volume (Kg) Analysis by Concentration, 2017-2032

Figure 107: East Asia Market Value Share (%) and BPS Analysis by Concentration, 2022-2032

Figure 108: East Asia Market Y-o-Y Growth (%) Projections by Concentration, 2022-2032

Figure 109: East Asia Market Value (US$ Mn) Analysis by Application, 2017-2032

Figure 110: East Asia Market Volume (Kg) Analysis by Application, 2017-2032

Figure 111: East Asia Market Value Share (%) and BPS Analysis by Application, 2022-2032

Figure 112: East Asia Market Y-o-Y Growth (%) Projections by Application, 2022-2032

Figure 113: East Asia Market Value (US$ Mn) Analysis by End Use, 2017-2032

Figure 114: East Asia Market Volume (Kg) Analysis by End Use, 2017-2032

Figure 115: East Asia Market Value Share (%) and BPS Analysis by End Use, 2022-2032

Figure 116: East Asia Market Y-o-Y Growth (%) Projections by End Use, 2022-2032

Figure 117: East Asia Market Attractiveness by Concentration, 2022-2032

Figure 118: East Asia Market Attractiveness by Application, 2022-2032

Figure 119: East Asia Market Attractiveness by End Use, 2022-2032

Figure 120: East Asia Market Attractiveness by Country, 2022-2032

Figure 121: South Asia & Pacific Market Value (US$ Mn) by Concentration, 2022-2032

Figure 122: South Asia & Pacific Market Value (US$ Mn) by Application, 2022-2032

Figure 123: South Asia & Pacific Market Value (US$ Mn) by End Use, 2022-2032

Figure 124: South Asia & Pacific Market Value (US$ Mn) by Country, 2022-2032

Figure 125: South Asia & Pacific Market Value (US$ Mn) Analysis by Country, 2017-2032

Figure 126: South Asia & Pacific Market Volume (Kg) Analysis by Country, 2017-2032

Figure 127: South Asia & Pacific Market Value Share (%) and BPS Analysis by Country, 2022-2032

Figure 128: South Asia & Pacific Market Y-o-Y Growth (%) Projections by Country, 2022-2032

Figure 129: South Asia & Pacific Market Value (US$ Mn) Analysis by Concentration, 2017-2032

Figure 130: South Asia & Pacific Market Volume (Kg) Analysis by Concentration, 2017-2032

Figure 131: South Asia & Pacific Market Value Share (%) and BPS Analysis by Concentration, 2022-2032

Figure 132: South Asia & Pacific Market Y-o-Y Growth (%) Projections by Concentration, 2022-2032

Figure 133: South Asia & Pacific Market Value (US$ Mn) Analysis by Application, 2017-2032

Figure 134: South Asia & Pacific Market Volume (Kg) Analysis by Application, 2017-2032

Figure 135: South Asia & Pacific Market Value Share (%) and BPS Analysis by Application, 2022-2032

Figure 136: South Asia & Pacific Market Y-o-Y Growth (%) Projections by Application, 2022-2032

Figure 137: South Asia & Pacific Market Value (US$ Mn) Analysis by End Use, 2017-2032

Figure 138: South Asia & Pacific Market Volume (Kg) Analysis by End Use, 2017-2032

Figure 139: South Asia & Pacific Market Value Share (%) and BPS Analysis by End Use, 2022-2032

Figure 140: South Asia & Pacific Market Y-o-Y Growth (%) Projections by End Use, 2022-2032

Figure 141: South Asia & Pacific Market Attractiveness by Concentration, 2022-2032

Figure 142: South Asia & Pacific Market Attractiveness by Application, 2022-2032

Figure 143: South Asia & Pacific Market Attractiveness by End Use, 2022-2032

Figure 144: South Asia & Pacific Market Attractiveness by Country, 2022-2032

Figure 145: MEA Market Value (US$ Mn) by Concentration, 2022-2032

Figure 146: MEA Market Value (US$ Mn) by Application, 2022-2032

Figure 147: MEA Market Value (US$ Mn) by End Use, 2022-2032

Figure 148: MEA Market Value (US$ Mn) by Country, 2022-2032

Figure 149: MEA Market Value (US$ Mn) Analysis by Country, 2017-2032

Figure 150: MEA Market Volume (Kg) Analysis by Country, 2017-2032

Figure 151: MEA Market Value Share (%) and BPS Analysis by Country, 2022-2032

Figure 152: MEA Market Y-o-Y Growth (%) Projections by Country, 2022-2032

Figure 153: MEA Market Value (US$ Mn) Analysis by Concentration, 2017-2032

Figure 154: MEA Market Volume (Kg) Analysis by Concentration, 2017-2032

Figure 155: MEA Market Value Share (%) and BPS Analysis by Concentration, 2022-2032

Figure 156: MEA Market Y-o-Y Growth (%) Projections by Concentration, 2022-2032

Figure 157: MEA Market Value (US$ Mn) Analysis by Application, 2017-2032

Figure 158: MEA Market Volume (Kg) Analysis by Application, 2017-2032

Figure 159: MEA Market Value Share (%) and BPS Analysis by Application, 2022-2032

Figure 160: MEA Market Y-o-Y Growth (%) Projections by Application, 2022-2032

Figure 161: MEA Market Value (US$ Mn) Analysis by End Use, 2017-2032

Figure 162: MEA Market Volume (Kg) Analysis by End Use, 2017-2032

Figure 163: MEA Market Value Share (%) and BPS Analysis by End Use, 2022-2032

Figure 164: MEA Market Y-o-Y Growth (%) Projections by End Use, 2022-2032

Figure 165: MEA Market Attractiveness by Concentration, 2022-2032

Figure 166: MEA Market Attractiveness by Application, 2022-2032

Figure 167: MEA Market Attractiveness by End Use, 2022-2032

Figure 168: MEA Market Attractiveness by Country, 2022-2032

Recommendations

Food and Beverage

Flavored Butter And Oils Market

Published : August 2023

Food and Beverage

Flavored Water Market

Published : May 2023

Food and Beverage

Micronutrient Powders Market

Published : May 2022

Explore Food and Beverage Insights

View Reports