The global coronary artery bypass graft market is valued at USD 18,700.6 million in 2025. It is slated to reach USD 24,889.1 million by 2035, recording an absolute increase of USD 6,188.5 million over the forecast period. This translates into a total growth of 33.1%, with the market forecast to expand at a CAGR of 2.9% between 2025 and 2035. The market size is expected to grow by nearly 1.33X during the same period, supported by increasing prevalence of coronary artery disease and cardiovascular conditions, growing adoption of minimally invasive surgical techniques and advanced graft technologies, and rising emphasis on improved clinical outcomes and patient safety across diverse hospital, cardiology clinic, and research institute applications.
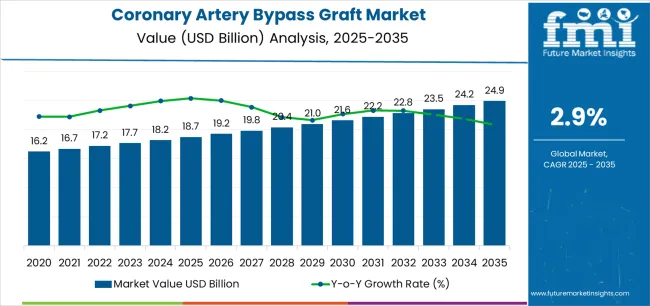
Between 2025 and 2030, the coronary artery bypass graft market is projected to expand from USD 18,700.6 million to USD 21,574.1 million, resulting in a value increase of USD 2,873.5 million, which represents 46.4% of the total forecast growth for the decade. This phase of development will be shaped by increasing aging population and rising cardiovascular disease burden, growing adoption of off-pump and minimally invasive CABG techniques, and expanding access to advanced cardiac surgical capabilities in emerging markets. Cardiac surgeons and hospital systems are enhancing their CABG capabilities to address the growing demand for effective coronary revascularization solutions that ensure optimal patient outcomes and procedural safety while supporting quality of life improvement.
| Metric | Value |
|---|---|
| Estimated Value in (2025E) | USD 18,700.6 million |
| Forecast Value in (2035F) | USD 24,889.1 million |
| Forecast CAGR (2025 to 2035) | 2.9% |
From 2030 to 2035, the market is forecast to grow from USD 21,574.1 million to USD 24,889.1 million, adding another USD 3,315.0 million, which constitutes 53.6% of the ten-year expansion. This period is expected to be characterized by the expansion of hybrid coronary revascularization approaches combining surgery and percutaneous interventions, the development of advanced graft preservation technologies and robotic-assisted CABG systems, and the growth of specialized applications for high-risk patient populations and complex coronary anatomy. The growing adoption of precision medicine approaches and individualized surgical planning will drive demand for CABG procedures with enhanced patient selection and technique optimization.
Between 2020 and 2025, the coronary artery bypass graft market experienced modest growth, influenced by increasing competition from percutaneous coronary intervention technologies while maintaining importance for complex coronary disease and specific patient populations requiring surgical revascularization. The market developed as cardiac surgeons and interventional cardiologists recognized the complementary roles of CABG and percutaneous approaches in comprehensive coronary disease management, with CABG maintaining advantages for multi-vessel disease, left main stenosis, and diabetes patients. Technological advancement in off-pump techniques and graft harvesting methods began emphasizing the critical importance of minimizing surgical trauma and improving recovery while maintaining long-term graft patency.
Market expansion is being supported by the persistent global burden of coronary artery disease driven by aging populations and cardiovascular risk factor prevalence, alongside the corresponding need for effective revascularization procedures that can restore coronary blood flow, relieve angina symptoms, and improve survival outcomes across various multi-vessel coronary disease, left main stenosis, diabetes with coronary disease, and complex coronary anatomy applications. Modern cardiac surgeons and healthcare systems continue to recognize CABG as essential treatment for specific patient populations requiring complete revascularization and durable long-term results.
The growing emphasis on surgical technique refinement and outcomes optimization is driving demand for advanced CABG technologies that can support off-pump procedures, enable minimally invasive approaches, and ensure comprehensive graft patency. Healthcare providers' preference for surgical revascularization that combines proven efficacy with refined techniques and improved recovery profiles is creating opportunities for innovative CABG implementations. The rising influence of diabetes epidemic and complex coronary disease presentations is also contributing to sustained demand for CABG procedures that can provide superior outcomes for high-risk patient populations.
The market is segmented by technology, procedure, end user, and region. By technology, the market is divided into off-pump CABG, on-pump CABG, and others. Based on procedure, the market is categorized into single CABG surgery, double CABG surgery, triple CABG surgery, quadruple CABG surgery, and others. By end user, the market includes hospitals, cardiology clinics, research institutes, and others. Regionally, the market is divided into East Asia, Europe, North America, South Asia, Latin America, Middle East & Africa, and Eastern Europe.
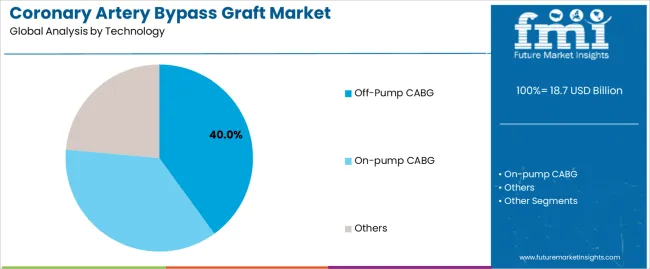
The off-pump CABG segment is projected to maintain its leading position in the coronary artery bypass graft market in 2025, with a market share of 40%. This reaffirming role underscores its position as the preferred technology approach for minimizing cardiopulmonary bypass complications and reducing perioperative morbidity. Cardiac surgeons increasingly utilize off-pump techniques for their potential to reduce systemic inflammatory response, decrease neurological complications, and support faster patient recovery while maintaining revascularization completeness. Off-pump CABG technology's growing adoption and clinical evidence directly address the surgical community's requirements for minimizing procedure-related complications and enhancing patient safety across diverse coronary disease presentations.
This technology segment represents modern surgical refinement, reflecting the evolution toward less invasive approaches with potential for reduced complications and established feasibility across multiple patient populations and surgical expertise levels. Cardiac surgery investments in off-pump training and stabilization device technologies continue to strengthen adoption among experienced surgeons and specialized centers. With patient safety priorities demanding complication reduction and recovery enhancement, off-pump CABG aligns with both clinical objectives and patient preferences, making it a central component of contemporary coronary revascularization strategies.
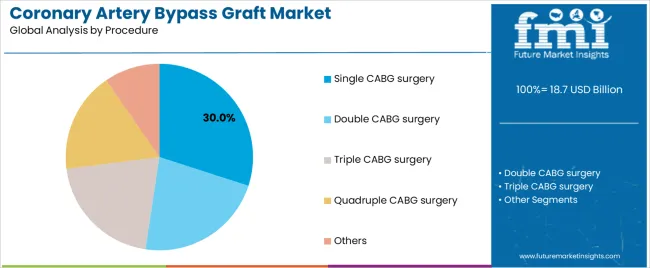
The CABG market encompasses diverse procedure types based on the number of grafts required to achieve complete revascularization. Single CABG surgery, representing 30% of the procedure volume, addresses isolated coronary lesions or specific anatomical targets, providing focused revascularization for limited disease presentations. This approach serves patients with single-vessel disease or those requiring targeted intervention for high-risk lesions.
Double and triple CABG surgery procedures represent substantial procedure volumes, driven by multi-vessel coronary disease requiring comprehensive revascularization. These configurations address the common clinical scenario of atherosclerotic disease affecting multiple coronary territories, enabling complete revascularization through multiple bypass grafts. Triple CABG, which accounts for a large portion of the volume, particularly represents a frequent procedure type for patients with three-vessel disease requiring left anterior descending, circumflex, and right coronary artery bypass grafts.
Quadruple CABG surgery serves patients with extensive coronary disease requiring four or more bypass grafts for complete revascularization. This complex procedure, though less frequent, addresses severe multi-vessel disease with multiple significant stenoses across coronary territories, ensuring comprehensive blood flow restoration through extensive grafting.
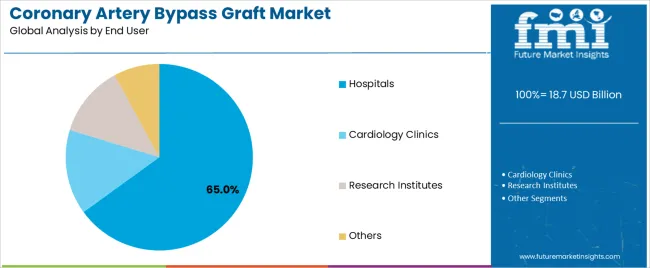
The hospitals end-user segment, representing 65% of CABG procedure volume, is projected to continue dominating the market in 2025, underscoring its critical role as the primary setting for cardiac surgical revascularization procedures requiring comprehensive perioperative support and specialized cardiac surgery infrastructure. Hospital cardiac surgery programs provide essential capabilities including operating room facilities, cardiopulmonary bypass equipment, intensive care monitoring, and multidisciplinary cardiac care teams necessary for safe CABG execution. Positioned as essential providers of complex cardiac surgical care, hospital-based programs offer both procedural capabilities and comprehensive patient management.
The segment is supported by continuous infrastructure investment and the growing concentration of cardiac surgical expertise in specialized centers with appropriate procedure volumes and quality outcomes. Hospitals are investing in hybrid operating rooms and advanced perioperative technologies to support comprehensive coronary revascularization programs combining surgical and percutaneous approaches. As healthcare delivery evolves and quality metrics intensify, the hospitals segment will continue to dominate CABG delivery while supporting surgical excellence and optimal patient outcomes.
The coronary artery bypass graft market is advancing modestly due to persistent prevalence of coronary artery disease requiring surgical revascularization driven by aging populations and cardiovascular risk factors, while facing competitive pressure from evolving percutaneous coronary intervention technologies that provide less invasive alternatives for certain patient populations. The market continues serving specific patient populations where CABG demonstrates superior outcomes including multi-vessel disease, left main stenosis, and diabetes patients requiring complete revascularization across complex coronary anatomy. The market faces challenges, including competition from advancing percutaneous technologies and drug-eluting stents, declining CABG volumes in some developed markets due to improved medical management, and technical complexity requiring specialized surgical expertise and institutional infrastructure. Innovation in minimally invasive approaches and hybrid revascularization strategies continues to influence procedure evolution and market dynamics.
The growing adoption of off-pump CABG and minimally invasive direct coronary artery bypass (MIDCAB) approaches is driving demand for specialized stabilization devices, visualization systems, and surgical expertise that enable cardiopulmonary bypass avoidance while maintaining revascularization quality. These advanced surgical techniques require refined skills and appropriate patient selection to deliver complication reduction benefits while ensuring complete revascularization and long-term graft patency. Cardiac surgery programs are increasingly investing in off-pump training and technology infrastructure to offer patients less invasive surgical options, creating opportunities for medical device innovations supporting off-pump stabilization, surgical visualization enhancement, and graft assessment technologies specifically designed for beating-heart surgery applications.
Modern cardiac centers are incorporating hybrid approaches combining surgical and percutaneous revascularization to optimize individual patient treatment strategies, enable minimally invasive surgical access for critical lesions, and support comprehensive revascularization through complementary techniques. Leading programs are implementing hybrid operating room facilities with integrated imaging and intervention capabilities, developing multidisciplinary heart teams for collaborative treatment planning, and establishing protocols that leverage surgical bypass for optimal targets while utilizing percutaneous intervention for appropriate secondary vessels. These approaches improve treatment individualization while enabling strategic revascularization options, providing minimally invasive surgical access for left anterior descending artery grafting combined with percutaneous intervention for other territories, and supporting staged procedures for complex anatomy or high-risk patients.
The expansion of graft technology innovation is driving development of improved arterial conduits, enhanced vein graft preservation solutions, and tissue-engineered graft alternatives that address graft failure mechanisms and improve long-term patency. These advanced graft technologies require specialized handling protocols and surgical techniques that optimize graft quality and maintain biological viability, creating specialized market segments supporting surgical excellence. Manufacturers are investing in graft preservation solution development, conduit harvesting device innovation, and bioengineered graft research to enhance long-term CABG outcomes while supporting procedural efficiency across diverse graft sources and patient characteristics.
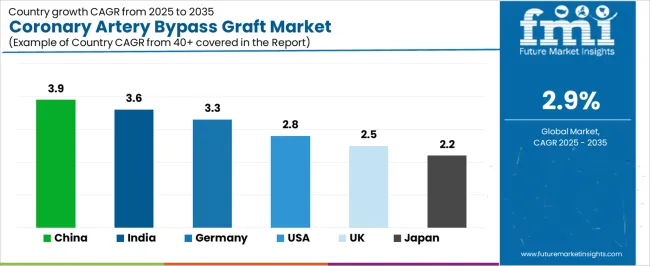
| Country | CAGR (2025-2035) |
|---|---|
| China | 3.9% |
| India | 3.6% |
| Germany | 3.3% |
| USA | 2.8% |
| UK | 2.5% |
| Japan | 2.2% |
The coronary artery bypass graft market is experiencing varied growth globally, with China leading at a 3.9% CAGR through 2035, driven by expanding cardiac surgery infrastructure, growing cardiovascular disease burden in aging population, and increasing access to advanced cardiac care in tier-one and tier-two cities. India follows at 3.6%, supported by large population with high cardiovascular disease prevalence, expanding private cardiac surgery capabilities, and growing medical tourism for cardiac procedures.
Germany demonstrates 3.3% growth, supported by advanced cardiac surgery excellence, comprehensive insurance coverage, and high-quality surgical outcomes. The United States records 2.8%, reflecting mature market with stable procedure volumes serving appropriate patient populations while facing continued competition from percutaneous interventions. The United Kingdom exhibits 2.5% growth, emphasizing evidence-based patient selection and surgical quality programs. Japan shows 2.2% growth, emphasizing surgical precision and quality-focused cardiac care across established cardiac surgery programs.
The report covers an in-depth analysis of 40+ countries, with top-performing countries are highlighted below.
Revenue from coronary artery bypass graft procedures in China is projected to exhibit notable growth with a CAGR of 3.9% through 2035, driven by expanding cardiac surgery infrastructure and growing cardiovascular disease burden supported by healthcare system modernization and increasing access to specialized cardiac care. The country's healthcare capacity expansion and rising chronic disease prevalence are creating demand for comprehensive cardiac surgical services. Major hospital systems and cardiac centers are establishing CABG programs to serve growing patient populations requiring coronary revascularization.
Demand for coronary artery bypass graft procedures in India is expanding at a CAGR of 3.6%, supported by the country's large population with high cardiovascular disease burden, expanding private cardiac surgery infrastructure, and growing reputation for quality cardiac care attracting domestic and international patients. The country's cardiac surgery expertise development and cost-competitive high-quality care are driving CABG capabilities throughout metropolitan medical centers. Leading cardiac hospitals and specialty centers are establishing comprehensive coronary revascularization programs serving diverse patient populations.
Revenue from coronary artery bypass graft procedures in Germany is growing at a CAGR of 3.3%, driven by the country's cardiac surgery excellence, comprehensive healthcare system, and established quality assurance programs supporting optimal surgical outcomes. Germany's medical expertise and healthcare infrastructure are supporting high-quality CABG delivery throughout cardiac surgical centers. University medical centers and specialized cardiac hospitals are maintaining comprehensive coronary revascularization capabilities serving appropriate patient populations.
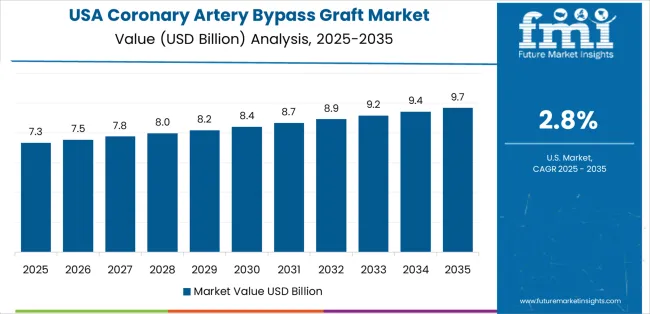
Demand for coronary artery bypass graft procedures in the United States is expected to expand at a CAGR of 2.8%, reflecting the country's mature cardiac surgery infrastructure with stable procedure volumes serving well-defined patient populations while adapting to evolving practice patterns and competitive technologies. The nation's comprehensive cardiac care capabilities and evidence-based practice are supporting appropriate CABG utilization. Cardiac surgery programs are maintaining quality focus and outcome excellence while navigating shifting revascularization strategies.
Revenue from coronary artery bypass graft procedures in the United Kingdom is anticipated to grow at a CAGR of 2.5%, supported by the country's NHS cardiac surgery services, established quality monitoring programs, and evidence-based approach to coronary revascularization supporting appropriate patient selection. The UK's healthcare system and outcome transparency are supporting quality-focused CABG delivery. NHS cardiac surgical centers are maintaining comprehensive revascularization capabilities within resource-conscious healthcare delivery models.
Demand for coronary artery bypass graft procedures in Japan is growing at a CAGR of 2.2%, driven by the country's emphasis on surgical precision, comprehensive perioperative care, and quality-focused cardiac surgery programs serving aging population with cardiovascular disease. Japan's medical excellence and quality standards are supporting refined CABG delivery throughout cardiac surgical centers. Leading university hospitals and cardiac specialty institutions are maintaining high-quality surgical revascularization capabilities emphasizing optimal outcomes.
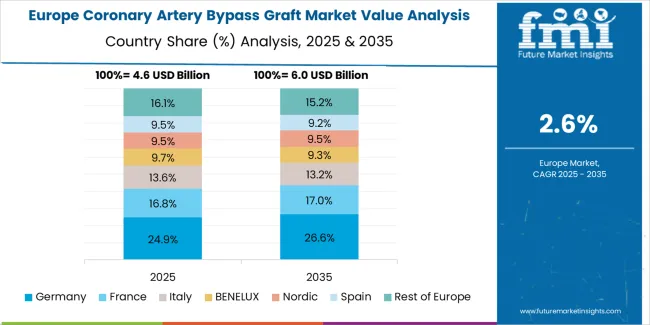
The coronary artery bypass graft market in Europe is projected to grow from USD 4,825.3 million in 2025 to USD 6,187.5 million by 2035, registering a CAGR of 2.5% over the forecast period. Germany is expected to maintain leadership with a 28.6% market share in 2025, moderating to 28.3% by 2035, supported by cardiac surgery excellence, comprehensive cardiac care infrastructure, and strong quality outcome programs.
The United Kingdom follows with 17.9% in 2025, projected at 17.6% by 2035, driven by NHS cardiac surgery services, national quality programs, and evidence-based revascularization practices. France holds 15.4% in 2025, reaching 15.6% by 2035 on the back of academic cardiac surgery programs and comprehensive cardiac care delivery. Italy commands 12.7% in 2025, rising slightly to 12.9% by 2035, while Spain accounts for 10.2% in 2025, reaching 10.4% by 2035 aided by expanding cardiac surgery capabilities and healthcare system development.
The Netherlands maintains 6.3% in 2025, up to 6.4% by 2035 due to cardiac surgery expertise and quality-focused programs. The Rest of Europe region, including Nordics, Central & Eastern Europe, and other markets, is anticipated to hold 8.9% in 2025 and 8.8% by 2035, reflecting stable cardiac surgery volumes, quality program development, and evidence-based practice adoption.
The coronary artery bypass graft market is characterized by competition among established medical device manufacturers providing surgical instruments, graft harvesting systems, stabilization devices, and cardiopulmonary bypass equipment. Companies are investing in minimally invasive technology development, off-pump surgical device innovation, graft preservation solution enhancement, and surgical training program support to deliver high-quality, safe, and effective CABG enabling technologies. Innovation in robotic surgical systems, enhanced visualization technologies, and graft quality assessment tools is central to strengthening market position and supporting surgical excellence.
Medtronic plc leads the market with a 25.0% share, offering comprehensive cardiac surgery solutions with focus on perfusion systems, surgical stabilization devices, and advanced cardiac surgical technologies supporting diverse CABG approaches. The company has announced investments in minimally invasive surgical technologies and robotic-assisted platform development to enhance procedural capabilities and surgical outcomes. Terumo Corp. provides innovative cardiopulmonary bypass systems, surgical grafts, and vascular access technologies with emphasis on quality and reliability across cardiac surgical applications.
Guidant Group delivers specialized cardiac surgery products with focus on surgical instruments and procedural support technologies for coronary revascularization. Getinge AB offers comprehensive cardiac surgery systems including perfusion equipment, surgical tables, and perioperative support technologies. Additional market participants include surgical instrument manufacturers, graft preservation solution providers, and specialized medical device companies serving cardiac surgery programs across diverse geographic markets and institutional settings.
Coronary artery bypass graft represents an established cardiac surgical procedure within cardiovascular medicine, with market revenues projected to grow from USD 18,700.6 million in 2025 to USD 24,889.1 million by 2035 at a 2.9% CAGR. These surgical revascularization procedures—primarily off-pump and on-pump configurations serving multiple vessel disease patterns—serve as essential treatment options for coronary artery disease in hospital cardiac surgery programs, specialized cardiology clinics, and research institutes where complete revascularization, symptom relief, and survival improvement are clinical priorities. Market growth is driven by persistent cardiovascular disease burden, aging population demographics, refined surgical techniques minimizing complications, and continued evidence supporting CABG superiority for specific patient populations including multi-vessel disease, left main stenosis, and diabetes patients requiring coronary revascularization.
How Healthcare Regulators Could Strengthen Quality Standards and Patient Safety?
How Professional Societies Could Advance Surgical Standards and Clinical Excellence?
How Medical Device Manufacturers Could Drive Innovation and Clinical Value?
How Cardiac Surgery Programs Could Optimize Outcomes and Institutional Excellence?
How Research Institutions Could Enable Clinical Advancement?
How Investors and Healthcare Systems Could Support Program Development?
| Items | Values |
|---|---|
| Quantitative Units (2025) | USD 18,700.6 million |
| Technology | Off-pump CABG, On-pump CABG, Others |
| Procedure | Single CABG surgery, Double CABG surgery, Triple CABG surgery, Quadruple CABG surgery, Others |
| End User | Hospitals, Cardiology Clinics, Research Institutes, Others |
| Regions Covered | East Asia, Europe, North America, South Asia, Latin America, Middle East & Africa, Eastern Europe |
| Countries Covered | China, India, Germany, United States, United Kingdom, Japan, and 40+ countries |
| Key Companies Profiled | Medtronic plc, Terumo Corp., Guidant Group, Getinge AB |
| Additional Attributes | Dollar sales by technology, procedure type, and end-user category, regional demand trends, competitive landscape, technological advancements in minimally invasive techniques, off-pump surgical innovation, graft preservation technologies, and clinical outcome optimization |
The global coronary artery bypass graft market is estimated to be valued at USD 18.7 billion in 2025.
The market size for the coronary artery bypass graft market is projected to reach USD 24,889.1 billion by 2035.
The coronary artery bypass graft market is expected to grow at a 2.9% CAGR between 2025 and 2035.
The key product types in coronary artery bypass graft market are off-pump cabg , on-pump cabg and others.
In terms of procedure, single cabg surgery segment to command 30.0% share in the coronary artery bypass graft market in 2025.


Our Research Products

The "Full Research Suite" delivers actionable market intel, deep dives on markets or technologies, so clients act faster, cut risk, and unlock growth.

The Leaderboard benchmarks and ranks top vendors, classifying them as Established Leaders, Leading Challengers, or Disruptors & Challengers.

Locates where complements amplify value and substitutes erode it, forecasting net impact by horizon

We deliver granular, decision-grade intel: market sizing, 5-year forecasts, pricing, adoption, usage, revenue, and operational KPIs—plus competitor tracking, regulation, and value chains—across 60 countries broadly.

Spot the shifts before they hit your P&L. We track inflection points, adoption curves, pricing moves, and ecosystem plays to show where demand is heading, why it is changing, and what to do next across high-growth markets and disruptive tech

Real-time reads of user behavior. We track shifting priorities, perceptions of today’s and next-gen services, and provider experience, then pace how fast tech moves from trial to adoption, blending buyer, consumer, and channel inputs with social signals (#WhySwitch, #UX).

Partner with our analyst team to build a custom report designed around your business priorities. From analysing market trends to assessing competitors or crafting bespoke datasets, we tailor insights to your needs.
Supplier Intelligence
Discovery & Profiling
Capacity & Footprint
Performance & Risk
Compliance & Governance
Commercial Readiness
Who Supplies Whom
Scorecards & Shortlists
Playbooks & Docs
Category Intelligence
Definition & Scope
Demand & Use Cases
Cost Drivers
Market Structure
Supply Chain Map
Trade & Policy
Operating Norms
Deliverables
Buyer Intelligence
Account Basics
Spend & Scope
Procurement Model
Vendor Requirements
Terms & Policies
Entry Strategy
Pain Points & Triggers
Outputs
Pricing Analysis
Benchmarks
Trends
Should-Cost
Indexation
Landed Cost
Commercial Terms
Deliverables
Brand Analysis
Positioning & Value Prop
Share & Presence
Customer Evidence
Go-to-Market
Digital & Reputation
Compliance & Trust
KPIs & Gaps
Outputs
Full Research Suite comprises of:
Market outlook & trends analysis
Interviews & case studies
Strategic recommendations
Vendor profiles & capabilities analysis
5-year forecasts
8 regions and 60+ country-level data splits
Market segment data splits
12 months of continuous data updates
DELIVERED AS:
PDF EXCEL ONLINE
Demand for Coronary Artery Bypass Graft in Japan Size and Share Forecast Outlook 2025 to 2035
Demand for Coronary Artery Bypass Graft in USA Size and Share Forecast Outlook 2025 to 2035
Bypass Fat Supplement Market Analysis - Size, Share, and Forecast Outlook 2025 to 2035
Coronary Intravascular Lithotripsy Market Size and Share Forecast Outlook 2025 to 2035
Bypass Switch Market Size, Growth, and Forecast 2025 to 2035
Coronary Stents Market Insights – Trends, Growth & Forecast 2025-2035
Artery Compression Devices Market
Coronary Guidewires Market
Bone Grafts and Substitutes Market Overview - Size, Share & Forecast 2025 to 2035
Hybrid Grafts Market Size and Share Forecast Outlook 2025 to 2035
Aortic Stent Grafts Market Analysis - Size, Share, and Forecast 2025 to 2035
Bioresorbable Coronary Scaffolds Market
Bioactive Bone Grafts Market Size and Share Forecast Outlook 2025 to 2035
Demand for Bone Grafts and Substitutes in USA Size and Share Forecast Outlook 2025 to 2035
Demand for Bone Grafts and Substitutes in Japan Size and Share Forecast Outlook 2025 to 2035
Cardiopulmonary Bypass System Market – Trends & Forecast 2025 to 2035
Industrial Analysis of Coronary Stent in India Size and Share Forecast Outlook 2025 to 2035
Thoracic Vascular Stent Grafts Market Trends and Forecast 2025 to 2035

Thank you!
You will receive an email from our Business Development Manager. Please be sure to check your SPAM/JUNK folder too.
Chat With
MaRIA