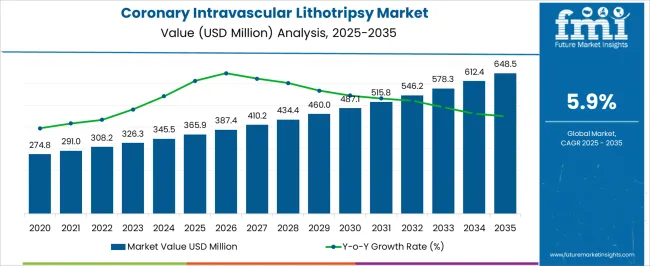
The Coronary Intravascular Lithotripsy Market is estimated to be valued at USD 365.9 million in 2025 and is projected to reach USD 648.5 million by 2035, registering a compound annual growth rate (CAGR) of 5.9% over the forecast period.

| Metric | Value |
|---|---|
| Coronary Intravascular Lithotripsy Market Estimated Value in (2025 E) | USD 365.9 million |
| Coronary Intravascular Lithotripsy Market Forecast Value in (2035 F) | USD 648.5 million |
| Forecast CAGR (2025 to 2035) | 5.9% |
The Coronary Intravascular Lithotripsy market is witnessing robust growth, driven by the rising prevalence of cardiovascular diseases, particularly calcified coronary artery conditions, which require advanced interventional therapies. The market expansion is being supported by increasing adoption of minimally invasive procedures that reduce procedural risks and improve patient outcomes. Intravascular lithotripsy technology provides a precise method for modifying calcified plaque in coronary arteries, enhancing stent deployment and improving long-term vascular patency.
Hospitals are increasingly implementing these procedures due to improved clinical safety, faster recovery times, and higher procedural success rates compared to traditional therapies. Technological advancements, including optimized catheter designs and energy delivery systems, are further enhancing treatment efficiency and precision.
Growing awareness among healthcare providers regarding the benefits of intravascular lithotripsy, coupled with supportive reimbursement policies and clinical guidelines, is driving market adoption As the global population ages and cardiovascular disease incidence rises, the demand for effective and reliable coronary interventions is expected to sustain long-term market growth and open opportunities for expanded clinical application.

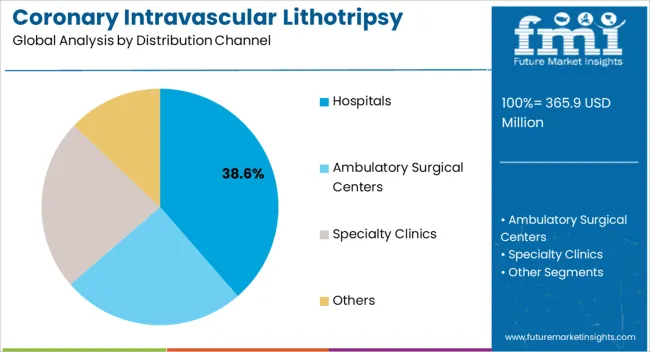
The hospitals distribution channel segment is projected to hold 38.6% of the market revenue in 2025, establishing it as the leading channel. Growth in this segment is being driven by the increasing reliance on hospitals for advanced interventional cardiology procedures and comprehensive patient care. Hospitals offer the infrastructure, skilled medical personnel, and clinical expertise required to perform complex coronary intravascular lithotripsy procedures safely and effectively.
The ability to integrate these treatments within cardiac catheterization labs and cardiovascular care programs enhances adoption. Hospitals also benefit from offering cutting-edge technologies to improve patient outcomes and attract referrals, which strengthens their position as primary distribution channels. Supportive policies, reimbursement frameworks, and clinical guidelines further promote adoption within hospital settings.
Additionally, hospital-based implementation ensures standardized procedures, monitoring, and post-operative care, reducing complications and improving recovery As healthcare systems continue to prioritize minimally invasive cardiac interventions and advanced cardiovascular care, the hospitals distribution channel is expected to maintain its leading share, driven by operational efficiency, clinical expertise, and patient-centered outcomes.
From 2020 to 2025, the global coronary intravascular lithotripsy market experienced a CAGR of 5.0 %, reaching a market size of USD 365.9 Million in 2025.
From 2020 to 2025, the global coronary intravascular lithotripsy industry witnessed steady growth due to the shift towards minimally invasive treatments. Coronary IVL is a relatively new interventional cardiology device, and its market has grown steadily in recent years.
With the advent of IVL, a novel option for treating calcified coronary artery lesions was created, addressing a huge unmet need in the cardiovascular industry.
Since its initial approval and commercialization, the use of coronary IVL has grown as additional clinical data proving its efficacy has emerged. The availability of specialized IVL systems, advances in catheter technology, and increasing physician experience have all led to market expansion.
Future Forecast for Coronary Intravascular Lithotripsy Industry:
Looking ahead, the global coronary intravascular lithotripsy industry is expected to rise at a CAGR of 6.2% from 2025 to 2035. During the forecast period, the market size is expected to reach USD 648.5 million in 2035.
The rising global frequency of cardiovascular illnesses, especially calcified lesions, is expected to increase demand for effective treatment alternatives. Because IVL is a minimally invasive alternative to standard treatments, it has the potential to expand as a result of its capacity to meet an unmet therapeutic need.
As more physicians become aware of the benefits of IVL and clinical data accumulates, the device may become more widely used. Increased acceptability among interventional cardiologists and healthcare providers has the potential to propel market expansion.
| Country | The United States |
|---|---|
| Market Size (USD million) by End of Forecast Period (2035) | USD 648.5 Million |
| CAGR % 2025 to End of Forecast (2035) | 6.6% |
The coronary intravascular lithotripsy industry in the United States is expected to reach a market value of USD 648.5 million by 2035, expanding at a CAGR of 6.6%.
The coronary intravascular lithotripsy market in the United States is expected to grow as the coronary artery disease in on the rise. For instance, According to the CDC, the most frequent kind of heart disease is coronary heart disease, which will kill 375,476 individuals in 2024. Coronary IVL provides a less invasive and effective therapeutic option for individuals with severely calcified coronary lesions, fueling market acceptance and growth.
| Country | The United Kingdom |
|---|---|
| Market Size (USD million) by End of Forecast Period (2035) | USD 28.0 million |
| CAGR % 2025 to End of Forecast (2035) | 6.1% |
The coronary intravascular lithotripsy industry in the United Kingdom is expected to reach a market value of USD 28.0 million by 2035, expanding at a CAGR of 6.1% during the forecast period. The market in the United Kingdom is expected to grow due to the increased preference for minimally invasive treatment options.
The UK healthcare system prioritizes the use of novel medical technology to enhance patient outcomes. As healthcare professionals and hospitals become more aware of coronary IVL, this technique is likely to be adopted as a beneficial therapeutic option for patients with calcified coronary lesions. As a result, the UK government is planning to invest in new medical technology to improve healthcare systems. For example, the NHS spends around £10 billion each year on medical technologies.
| Country | China |
|---|---|
| Market Size (USD billion) by End of Forecast Period (2035) | USD 48.4 billion |
| CAGR % 2025 to End of Forecast (2035) | 8.8% |
The coronary intravascular lithotripsy industry in China is anticipated to reach a market value of USD 48.4 million by 2035, moving at a CAGR of 8.8% during the forecast period. Due to the advantages of minimally invasive procedures, such as shorter hospital stays, quicker recovery periods, and less problems, they are becoming more and more popular in China. For instance, because to its advantages including shorter hospital stays, quicker recovery periods, and less problems, minimally invasive therapies are becoming more and more popular in China.
This trend is supported by the minimally invasive treatment for calcified coronary lesions known as coronary IVL, which is anticipated to see more use in the future.

| Country | Japan |
|---|---|
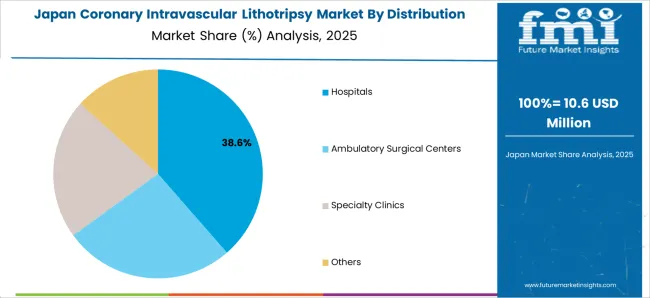
| Market Size (USD million) by End of Forecast Period (2035) | USD 21.9 million |
| CAGR % 2025 to End of Forecast (2035) | 6.4% |
The coronary intravascular lithotripsy industry in Japan is estimated to reach a market value of USD 21.9 million by 2035, thriving at a CAGR of 6.4%. During the projection period, the Japan market grew due to growing geriatric population.
Japan's ageing population, along with a rising incidence of heart illnesses, pushes the desire for effective, less invasive treatment alternatives. Coronary IVL serves an unmet therapeutic need and adds to market growth by treating calcified lesions.
| Country | South Korea |
|---|---|
| Market Size (USD million) by End of Forecast Period (2035) | USD 7.2 million |
| CAGR % 2025 to End of Forecast (2035) | 5.9% |
The coronary intravascular lithotripsy industry in South Korea is expected to reach a market share of USD 7.2 million, expanding at a CAGR of 5.9% during the forecast period. South Korea's government has been aggressively supporting healthcare reforms and encouraging the use of modern medical technology.
Policies that priorities cardiovascular disease management and medical device development create a favorable environment for the market expansion of coronary IVL.
The hospitals dominated the coronary intravascular lithotripsy industry with a share of 42.7% in 2025. This segment captures a significant market share in 2025 while growing at a projected CAGR of 7.3% between 2025 and 2035, due to the demand for accessible and convenience.
In clinic settings, hospitals may greatly contribute to the patient care team by examining drugs and teaching patients about various cardiac diseases. As a result, hospitals are critical in heart care treatment.

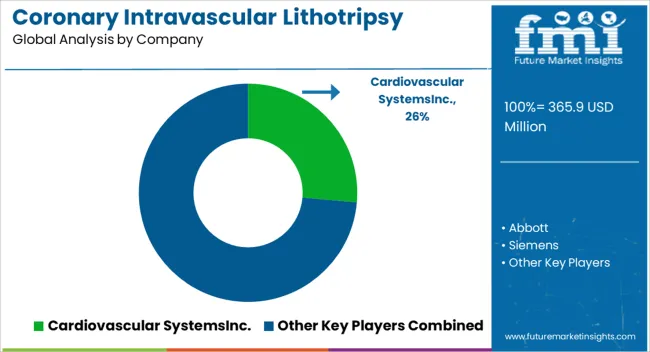
The coronary intravascular lithotripsy industry is highly competitive and numerous players are actively seeking to get hold of market share. In such a scenario, key players have to adopt strategies, which are effective in order to stay ahead of the competition.
Key Strategies Adopted by the Players
Product Innovation
Companies make significant investments in R&D to bring new goods to market that offer improved efficiency, dependability, and cost-effectiveness. Companies may set themselves apart from rivals and adapt to clients' changing requirements thanks to product innovation.
Strategic Partnerships and Collaborations
Strategic partnerships and collaborations between leading organisations in the sector are frequently formed to take advantage of one another's advantages and broaden their market reach. These partnerships can provide businesses access to emerging markets and technology.
Expansion into Emerging Markets
The market for coronary intravascular lithotripsy is expanding significantly in developing nations like China and India. Important firms are creating local production facilities and bolstering their distribution networks in an effort to increase their market share.
Mergers and Acquisitions
In order to strengthen their market positions, increase the scope of their product offerings, and gain access to new markets, major companies in the coronary intravascular lithotripsy market frequently participate in mergers and acquisitions.
Shockwave Medical, Inc.
Key Developments in the Coronary Intravascular Lithotripsy Market:
On February 12, 2024, the USA FDA approved two Intravascular Lithotripsy (IVL) Systems- Shockwave Intravascular Lithotripsy (IVL) System and Shockwave C2 Coronary Intravascular Lithotripsy (IVL) Catheter, according to Shockwave Medical, Inc.
The global coronary intravascular lithotripsy market is estimated to be valued at USD 365.9 million in 2025.
The market size for the coronary intravascular lithotripsy market is projected to reach USD 648.5 million by 2035.
The coronary intravascular lithotripsy market is expected to grow at a 5.9% CAGR between 2025 and 2035.
The key product types in coronary intravascular lithotripsy market are hospitals, ambulatory surgical centers, specialty clinics and others.
In terms of , segment to command 0.0% share in the coronary intravascular lithotripsy market in 2025.


Full Research Suite comprises of:
Market outlook & trends analysis
Interviews & case studies
Strategic recommendations
Vendor profiles & capabilities analysis
5-year forecasts
8 regions and 60+ country-level data splits
Market segment data splits
12 months of continuous data updates
DELIVERED AS:
PDF EXCEL ONLINE
Coronary Artery Bypass Grafts Market is segmented by technology, procedure and end user from 2025 to 2035
Coronary Stents Market Insights – Trends, Growth & Forecast 2025-2035
Coronary Guidewires Market
Bioresorbable Coronary Scaffolds Market
Industrial Analysis of Coronary Stent in India Size and Share Forecast Outlook 2025 to 2035
Intravascular Ultrasound Systems Market Size and Share Forecast Outlook 2025 to 2035
Intravascular Imaging Market Growth – Trends & Forecast 2025 to 2035
Disseminated Intravascular Coagulation (DIC) Treatment Market Analysis – Size, Share & Forecast 2025 to 2035
Spectroscopy Intravascular Imaging System Market
Lithotripsy Devices Market Size and Share Forecast Outlook 2025 to 2035

Thank you!
You will receive an email from our Business Development Manager. Please be sure to check your SPAM/JUNK folder too.
Chat With
MaRIA