
- Market Size (2026)
- USD 4.7 Bn
- Forecast (2036)
- USD 7.3 Bn
- CAGR (2026 to 2036)
- 4.5%
How big is Greyboard Market in 2026?
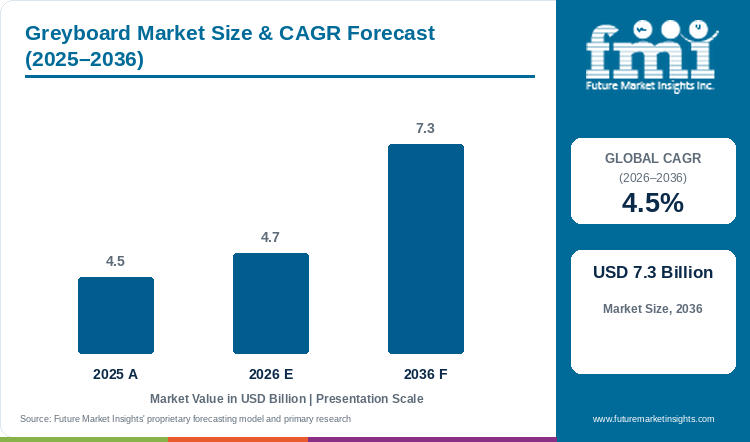
The greyboard market valuation was valued at USD 4.5 billion in 2025 to USD 4.7 billion in 2026 and is estimated to reach USD 7.3 billion by 2036, expanding at a 4.5% CAGR during the forecast period.
Global greyboard market size stood at USD 4.5 billion in 2025 and reaches USD 4.7 billion in 2026, with industry valuation projected to reach USD 7.3 billion by 2036 at a 4.5% CAGR, according to FMI projections. Consumer brands and rigid box makers are shifting away from plastic blister trays and synthetic foam inserts to avoid municipal packaging waste fees, which directly increases mill orders for multi-ply recycled board. In January 2025, the European Union enacted Regulation 2025/40 establishing a 70% minimum recyclability requirement across all consumer and industrial packaging [1]. 600 to 1200 GSM Standard Caliper sheets hold 56.4% of 2026 demand as box plants rely on uniform board thickness for automated V-grooving, a pattern that also supports the printed rigid packaging sector at a 4.8% CAGR. Paperboard suppliers are adding recovered fiber capacity to serve this demand, and in July 2025 Graphic Packaging Holding Company committed USD 850 million in annual capital investment to complete its Waco recycled paperboard mill [2]. However, moisture absorption in humid warehouses can warp uncoated sheets and remains a practical restraint that buyers manage through strict flatness tolerances.
Key Market Trends & Insights
- By basis weight: 600 to 1200 GSM Standard Caliper grades hold an estimated 56.4% share in 2026 because medium-heavy board thicknesses deliver high box compression strength without excessive die-cutting knife wear.
- By material composition: 100% Recycled Waste Paper represents 76.8% in 2026 as de-inked newspaper and old corrugated container furnishes lower raw fiber costs per metric ton.
- By surface finish: Smooth Calendered Finish accounts for 58.5% in 2026 because compressed surface fibers minimize PVA glue absorption during high-speed decorative paper lamination.
- By end-use application: Rigid Luxury Boxes and Setup Cartons secure 37.3% in 2026 owing to premium cosmetics and electronics brands shifting from molded plastic inserts to rigid paperboard.
- By distribution channel: Direct Mill-to-Converter Contracts command 61.2% in 2026 through custom reel-sheeting tolerances and quarterly waste-paper index pricing agreements.
Regional Highlights
- Top national expansion: Poland leads national growth projections at a 5.3% CAGR through 2036 under automated rigid box converting and furniture core exports across Central Europe.
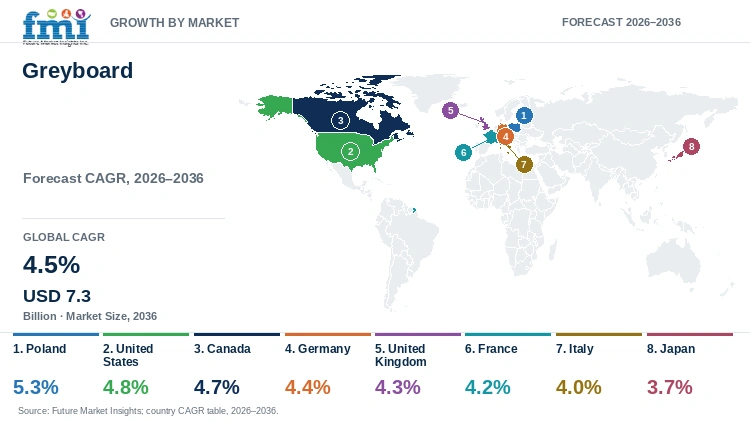
- Broader country progression: The United States tracks at a 4.8% CAGR ahead of Canada at 4.7% and Germany at 4.4%, whereas France advances at a 4.2% CAGR and Japan records a 3.7% CAGR.
Market Size & Forecast
Table 1: Market Size and Forecast for the Greyboard Market (USD billion and CAGR percentage), 2025 to 2036
| Metric | Value |
|---|---|
| 2025 Market Size | USD 4.5 billion |
| Estimated Market Size in 2026 | USD 4.7 billion |
| Projected Market Size by 2036 | USD 7.3 billion |
| CAGR, 2026 to 2036 | 4.5% |
| Added Valuation, 2026 to 2036 | USD 2.6 billion |
Strong demand for plastic-free gift boxes, book covers and retail display stands is expanding mill shipments of uncoated recycled greyboard across Europe, North America and Asia. Brand owners want rigid paperboard boxes that protect heavy glass perfume bottles and electronics while remaining 100% recyclable in household paper bins. Untreated recycled board can absorb moisture during damp transit, so mills are refining recovered pulp and applying bio-based surface treatments to keep boxes rigid. In May 2026, materials researchers reporting in Carbohydrate Polymers showed that mechanical pulp refining paired with a beeswax and cellulose coating cut water vapor transmission on recycled paper by 94% [3]. As a result, converters buying folding carton and paperboard packaging steadily select refined, high-density greyboard cores that hold their shape from the factory floor to retail shelves.
Recovered Fiber Tonnage and Caliper Yield Sizing
Table 2: Recovered Fiber Tonnage and Caliper Yield Sizing for the Greyboard Market (USD billion and operational ranges), 2025 to 2036
| Metric | 2025 | 2026 | 2036 |
|---|---|---|---|
| Market size (USD billion) | 4.5 | 4.7 | 7.3 |
| Global greyboard physical shipments (million metric tons) | 6.1 to 6.6 | 6.3 to 6.9 | 9.2 to 10.1 |
| Recovered waste paper input volume (million metric tons) | 6.8 to 7.4 | 7.0 to 7.7 | 10.2 to 11.2 |
| Realized manufacturer price per metric ton (USD) | 690 to 745 | 700 to 755 | 735 to 805 |
Operational note: Physical shipment ranges reflect a 1.11 metric ton recovered paper input per metric ton of finished greyboard across 300 to 1,500 GSM board machines.
Higher consumption of premium cosmetics, spirits and luxury apparel is pushing carton converters to source smoother, tighter-tolerance board substrates that reduce wrapping defects. When a rigid box plant laminates thin decorative paper onto greyboard at high speed, uneven board thickness or rough fibers create surface blisters and costly scrap. To capture this luxury packaging demand, in September 2025 Stora Enso Oyj launched its Ensovelvet uncoated paperboard in 240 to 320 GSM grades engineered for smooth folding and tactile cosmetics boxes [4]. Converters sourcing coated recycled boxboard pair these smooth outer wraps with rigid greyboard inner cores to deliver plastic-free presentation boxes at scale.
Per Capita & Rigid Converting Line Allocation
Table 3: Per Capita and Converting Plant Allocation Indicators for the Greyboard Market (USD), 2025 to 2036
| Metric | 2025 | 2026 | 2036 |
|---|---|---|---|
| World population (billion) | 8.2 | 8.3 | 9.0 |
| Market value per 1,000 people (USD) | 548.8 | 566.3 | 811.1 |
| Annual board procurement per converting plant (USD thousand) | 285.0 to 320.0 | 295.0 to 335.0 | 430.0 to 485.0 |
| FSC and PEFC certified recycled board share (%) | 68.0% to 72.0% | 70.0% to 74.0% | 83.0% to 88.0% |
Table 4: Converting Plant & Channel Indicators for the Greyboard Market (USD and percentages), 2026
| Metric | Value | Institutional Reference Basis |
|---|---|---|
| Market size, 2026 | USD 4.7 billion | 2026 global valuation baseline |
| Active rigid box and bindery converting plants global | 15,200 plants | Commercial setup box, bookbinding & protector lines |
| Mean board procurement per plant | USD 309,210.5 | Annualized greyboard substrate allocation |
| Direct Mill-to-Converter Contracts value, 2026 | USD 2.9 billion | 61.2% distribution channel allocation |
Cost pressure on home appliance and furniture shippers to eliminate expanded polystyrene foam is creating steady new volume for heavy-caliper greyboard edge protectors and corner posts. Logistics managers need low-cost fiber corner blocks that absorb truck vibration without crushing under stacked pallets. In September 2025, packaging engineers publishing in Materials confirmed through refrigerator vibration testing that recycled cardboard structural supports matched expanded polystyrene foam in dynamic stiffness retention [5]. Industrial buyers procuring paper and paperboard packaging are therefore replacing foam dunnage with laminated greyboard corner protectors across warehouse distribution networks.
Analyst Perspective
"Rigid box makers and bookbinders do not purchase greyboard solely on price per metric ton. They buy guaranteed sheet flatness, uniform caliper tolerance, and low glue uptake across high-speed laminating lines. Recycled board mills that control cross-machine moisture profiles and deliver custom sheet sizes directly to converters will capture long-term contract volume as brands in Europe, the United States, and Canada phase out plastic packaging inserts."
- Nandini Roy Choudhury, Principal Consultant, Future Market Insights.
How is the greyboard market segmented?
The greyboard market is segmented by basis weight, material composition, surface finish, end-use application, and distribution channel. In 2026, 600 to 1200 GSM Standard Caliper is projected at 56.4%, 100% Recycled Waste Paper at 76.8%, Smooth Calendered Finish at 58.5%, Rigid Luxury Boxes and Setup Cartons at 37.3%, and Direct Mill-to-Converter Contracts at 61.2%.
By basis weight: 600 to 1200 GSM Standard Caliper, 300 to 600 GSM Lightweight Board, and Above 1200 GSM Heavy Industrial Board.
By material composition: 100% Recycled Waste Paper and Mixed Mechanical and Waste Pulp Blend.
By surface finish: Smooth Calendered Finish and Uncalendered Standard Finish.
By end-use application: Rigid Luxury Boxes and Setup Cartons, Book Binding and Hardcover Stationery, Graphic Display Mounting Boards and Edge Protectors and Furniture Core.
By distribution channel: Direct Mill-to-Converter Contracts, Paperboard Merchants and Sheeting Distributors, and Specialty Packaging Supply Portals.
Why does 600 to 1200 GSM Standard Caliper lead the basis weight category?
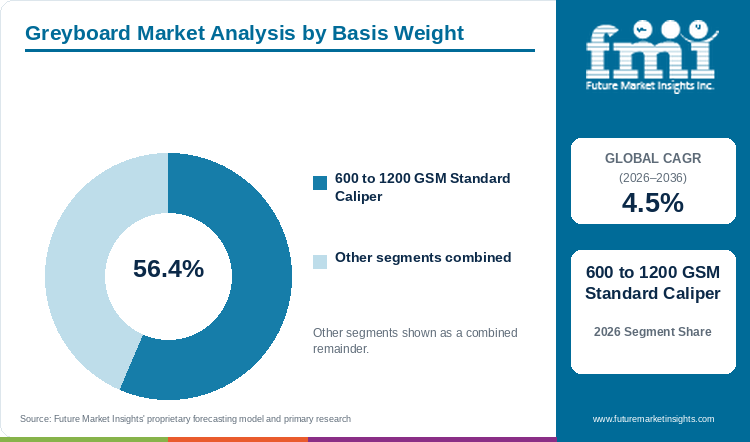
600 to 1200 GSM Standard Caliper grades hold an estimated 56.4% of basis weight demand in 2026, anchored by V-grooving accuracy across rigid setup box lines.
Table 5: Basis Weight Share for the Greyboard Market (percentage share), 2026
| Basis Weight | Share (2026) |
|---|---|
| 600 to 1200 GSM Standard Caliper | 56.4% |
| Other Segments Combined | 43.6%* |
| Total | 100.0% |
*Note: Remaining basis weight categories (300 to 600 GSM Lightweight Board at 24.8% and Above 1200 GSM Heavy Industrial Board at 18.8%) account for the balance of 2026 global greyboard demand.
Table 6: Basis Weight Leadership and Market Growth for the Greyboard Market (segment and CAGR percentage), 2026 to 2036
| Metric | Value |
|---|---|
| Global CAGR (2026 to 2036) | 4.5% |
| Leading Segment | 600 to 1200 GSM Standard Caliper |
High adoption of automated rigid box assembly and hardcover bookbinding lines is driving demand for 600 to 1,200 GSM Standard Caliper greyboard. Converters prefer this 1.0 to 2.0 millimeter thickness range because the board bends cleanly along 90-degree V-grooves without cracking while providing strong sidewall protection for electronics and gift sets. Lighter 300 to 600 GSM boards account for 24.8% of 2026 demand in compact stationery sleeves, while Above 1,200 GSM grades hold 18.8% for heavy pallet edge protectors. Box makers sourcing corrugated and folding carton packaging standardize on 600 to 1,200 GSM sheets to run multiple box sizes without resetting cutting pressures.
- 600 to 1200 GSM Standard Caliper holds 56.4% of basis weight value in 2026 because 1.0 to 2.0 millimeter calipers balance structural rigidity with rotary cutting throughput.
- In December 2025, Stora Enso Oyj reported at the European Carton Excellence Awards that precision paperboard structures with integrated board locks reduced overall package volume by 50% [6].
What sustains 100% Recycled Waste Paper leadership in material composition?
100% Recycled Waste Paper represents 76.8% of the material composition category in 2026, supported by municipal fiber collection and corporate circularity mandates.
Lower raw material costs and corporate recycled-content mandates keep 100% Recycled Waste Paper at the top of the material composition segment. Paperboard mills blend collected old corrugated containers, mixed office waste, and newspapers to produce greyboard at USD 180 to USD 240 per ton below virgin wood-pulp grades. Mixed Mechanical and Waste Pulp Blend boards hold the remaining 23.2% share in applications requiring extra bending stiffness for archival book covers. Retail brands purchasing coated recycled paperboard specify 100% recycled greyboard cores to meet sustainability targets and lower packaging tax rates.
- 100% Recycled Waste Paper represents 76.8% of the material composition segment in 2026 as luxury and retail brands mandate verified post-consumer fiber content.
- In June 2026, Graphic Packaging Holding Company reported in its 2025 Impact Report that 96% of its sold packaging products were recyclable and replaced 880 million plastic packages in 2025 [7].
How does Smooth Calendered Finish lead the surface finish category?
Smooth Calendered Finish accounts for 58.5% of surface finish demand in 2026, driven by reduced adhesive consumption on litho-laminating lines.
Need for lower adhesive consumption and defect-free decorative wrapping explains why Smooth Calendered Finish leads the surface finish category. Compression of greyboard through heated steel calender rolls flattens surface fibers so polyvinyl acetate glue spreads evenly in a thin film rather than soaking into porous board. Uncalendered Standard Finish represents 41.5% of 2026 demand for hidden sofa frames and industrial pallet interleaving where visual appearance does not affect sales. Print finishers producing uv-barrier paper packaging rely on calendered greyboard so thin printed wrap papers stay flat under retail store lighting.
- Smooth Calendered Finish accounts for 58.5% of surface finish demand in 2026 because low surface roughness prevents wrap blistering and cuts adhesive coat weight by 15%.
- In August 2025, researchers at BOKU University reporting in ACS Omega showed that paper surface energy and fiber density directly control resin wetting and penetration uniformity during lamination [8].
Why do Rigid Luxury Boxes and Setup Cartons lead end-use applications?
Rigid Luxury Boxes and Setup Cartons secure 37.3% of end-use application value in 2026, supported by premium spirits, cosmetics, and smartphone unboxing standards.
Expansion of direct-to-consumer e-commerce and premium retail gifting drives the leadership of Rigid Luxury Boxes and Setup Cartons among end-use applications. Cosmetics, watch, jewelry and smartphone brands use rigid greyboard setup boxes to prevent transit damage and create a memorable unboxing experience that justifies premium retail prices. Book Binding and Hardcover Stationery holds 26.4% of 2026 demand, while Graphic Display Mounting Boards capture 19.5% and Edge Protectors and Furniture Core account for 16.8%. Brand buyers ordering luxury rigid boxes specify high-density greyboard walls that resist corner crushing in parcel sorting hubs.
- Rigid Luxury Boxes and Setup Cartons secure 37.3% of end-use application demand in 2026 as high-margin gifting and electronics brands replace plastic clamshells with wrapped board.
- In October 2026, Graphic Packaging Holding Company won three Paperboard Packaging Council awards for structural paperboard packs across retail food and beverage categories [9].
What gives Direct Mill-to-Converter Contracts the lead in distribution channel?
Direct Mill-to-Converter Contracts command 61.2% of distribution channel share in 2026, anchored by bespoke sheet slitting and moisture-locked pallet delivery.
Converter focus on reducing sheet trim waste and securing stable quarterly pricing keeps Direct Mill-to-Converter Contracts as the largest distribution channel. Large box plants order custom-sheeted reels directly from board mills so sheet width and grain direction match their die-cutting chases without side-trim scrap. Paperboard Merchants and Sheeting Distributors hold 27.5% of 2026 volume by supplying smaller print shops with rapid local deliveries, while Specialty Packaging Supply Portals represent 11.3%. Direct mill contracts also protect converters through indexed waste-paper pricing and moisture-proof pallet wrapping.
- Direct Mill-to-Converter Contracts command 61.2% of distribution channel value in 2026 because custom guillotine sheet dimensions reduce converter trim scrap by 6% to 9%.
- In June 2026, Sonoco Products Company implemented a 7% price increase across converted paperboard tubes and cores, partitions and protective packaging in North America to offset input inflation [10].
What are the drivers, restraints, and opportunities in the greyboard market?
In the greyboard market, statutory European and North American plastic-substitution rules and e-commerce transit durability standards are projected to drive adoption whereas volatile recovered waste-paper energy costs restrain mill margins and bio-barrier surface coatings unlock moisture-resistant packaging.
- Driver: Brand commitments to replace plastic inserts and EU Regulation 2025/40 recyclability rules increase mill orders for 100% recycled greyboard cores.
- Restraint: Swings in waste-paper collection prices and high natural-gas drying costs squeeze operating margins for recycled board mills.
- Opportunity: Water-based biopolymer and wax barrier coatings allow recycled greyboard to enter chilled food trays and moisture-exposed transit packaging.
Growth Analysis and Future Potential: Qualitative Demand Catalysts
Retailer bans on non-recyclable plastic packaging and well-established municipal paper collection networks are driving steady demand for recycled greyboard across consumer and industrial sectors. When e-commerce shippers and consumer brands replace foam blocks and plastic blisters with greyboard inserts, households can place the entire box directly into curbside paper recycling bins. Buyers sourcing paperboard packaging substrates prefer uncoated recycled board because high recovery rates keep raw fiber supplies abundant and affordable. Figures from the U.S. Forest and Paper Association in 2026, about 80% of U.S. paper mills use recycled paper and recycled roughly 45 million tons of paper in 2025 [11].
Risk Assessment of the Greyboard Market: Operational and Furnish Friction
Sensitivity of uncoated recycled paperboard to high warehouse humidity and rising energy costs for mill drying cylinders remain the main factors restraining greyboard market growth. Uncoated cellulose fibers absorb moisture when relative humidity exceeds 75% during sea freight or monsoon storage, which causes board swelling and weakens glued box corners. In May 2025, food packaging researchers at the University of Montpellier reporting in Food Research International found that cellulosic cardboards lost structural stiffness when exposed to 100% relative humidity after creasing and folding [12]. Shippers using cardboard edge protectors in damp distribution lanes must therefore pay extra for moisture-resistant outer wraps or chemical sizing.
Commercial Opportunity Analysis: Surface Engineering and Value-Add Formats
Application of eco-friendly, water-based barrier coatings onto recycled greyboard offers board mills a strong commercial opportunity to win higher-margin food and personal care packaging accounts. Conventional polyethylene film lamination makes paperboard difficult to repulp, whereas biodegradable biopolymer and natural wax coatings protect against moisture while keeping the board recyclable. In October 2025, researchers at Texas A&M University publishing in ACS Applied Materials and Interfaces showed that a water-based chitosan, pectin and carnauba wax coating reduced paper water absorption from 131.6 to 29.1 grams per square meter [13]. Mills that integrate these water-based barrier coatings on the board machine can capture new sales in chilled food trays and cosmetics gift sets.
Greyboard Market by Country (2026 to 2036)
National growth modeling shows Poland leading greyboard expansion at a 5.3% CAGR through 2036, while the United States records a 4.8% CAGR and Japan tracks at 3.7%. Regional adoption patterns reflect local investments in rigid gift-box assembly, hardcover bookbinding, and statutory fiber-packaging compliance.
Table 7: Country CAGR and Primary Growth Levers for the Greyboard Market (CAGR percentage and operational drivers), 2026 to 2036
| Country | CAGR (2026 to 2036) | Primary Growth Lever |
|---|---|---|
| Poland | 5.3% | Central European rigid box converting hub and furniture honeycomb core exports |
| United States | 4.8% | Closed-loop recycled paperboard mill investments and e-commerce protective dunnage |
| Canada | 4.7% | USD 125 billion food and beverage sector adopting recycled fiber secondary packs |
| Germany | 4.4% | National PPWR transposition enforcing strict recyclability grading on retail packs |
| United Kingdom | 4.3% | 52.2% private-label grocery share driving cost-efficient recycled display boards |
| France | 4.2% | AGEC anti-waste law plastic bans across cosmetics, spirits, and artisanal gifting |
| Italy | 4.0% | Luxury fashion and gourmet food setup box production across 55,000 processors |
| Japan | 3.7% | High-precision calendered chipboard for confectionery gifting and hardcover books |
Source: Future Market Insights analysis
Poland Greyboard Market Outlook (2026 to 2036)
Greyboard demand in Poland is projected to grow at a leading 5.3% CAGR from 2026 to 2036 as Western European cosmetics, confectionery, and spirits brands shift rigid box production to converting plants in Poland. Box factories in Poznan, Warsaw and Wroclaw combine lower labor costs with modern automated V-grooving and wrapping lines, allowing them to supply luxury gift boxes and furniture core panels across the European Union. Data from the July 2026 USDA Foreign Agricultural Service Exporter Guide for Poland, national food and agricultural imports exceeded USD 48 billion in 2025, which fuels domestic retail and export packaging demand [14]. Local converters steadily order 800 to 1,000 GSM calendered recycled board to keep high-speed wrapping lines running without stops.
Key takeaway: In Poland, near-shored luxury box converting and furniture core exports are projected to drive Europe's fastest national greyboard growth at a 5.3% CAGR.
United States Greyboard Market Outlook (2026 to 2036)
Demand for greyboard in the United States is forecast to expand at a 4.8% CAGR between 2026 and 2036, driven by e-commerce mailer stiffeners, hardcover book production and retail plastic-reduction pledges. Consumer goods companies and fulfillment centers across the United States are replacing expanded polystyrene corner blocks and plastic clamshells with heavy-caliper uncoated recycled paperboard. In its 2025 Form 10-K filed with the U.S. Securities and Exchange Commission in February 2026, Graphic Packaging Holding Company reported USD 128 million in annual dividends and realigned its Americas Paperboard Packaging operations to serve CPG brands [15]. Domestic converters favor mill-direct sheet contracts that guarantee flat board for automated packaging lines.
Key takeaway: In the United States, modern recycled paperboard mill capacity and e-commerce protective packaging demand are anticipated to sustain a 4.8% CAGR through 2036.
Canada Greyboard Market Outlook (2026 to 2036)
Valuation of the greyboard market in Canada is estimated to advance at a 4.7% CAGR through 2036 as federal zero-plastic-waste rules and provincial blue-box fee schedules penalize non-recyclable packaging. Food, beverage, and consumer goods manufacturers in Ontario and Quebec are redesigning secondary display cartons and gift packs around 100% recycled paperboard cores to lower extended producer responsibility fees. Per the August 2026 USDA Foreign Agricultural Service Food Processing Ingredients report on Canada, food and beverage processing remains the largest manufacturing employer in the country and relies heavily on recyclable packaging [16]. Box makers in Canada prioritize cold-weather board grades that resist edge cracking in winter transit.
Key takeaway: In Canada, mandatory 2026 package labeling redesigns and a USD 125 billion food processing base are forecast to support a 4.7% CAGR.
Germany Greyboard Market Outlook (2026 to 2036)
Sales of greyboard in Germany are projected to progress at a 4.4% CAGR from 2026 to 2036 because strict national packaging waste laws and high retail recycling targets favor mono-material fiber board. Industrial equipment makers, bookbinders and confectionery exporters in Germany use heavy recycled greyboard for protective pallet edge posts, archival binders and seasonal gift boxes. Per the October 2026 USDA Foreign Agricultural Service report on Germany transposing the EU Packaging and Packaging Waste Regulation, national compliance rules enforce strict recyclability grading across all commercial packaging [17]. However, elevated industrial electricity prices in Germany push domestic board mills to invest in heat-recovery drying hoods to protect margins.
Key takeaway: In Germany, strict national enforcement of EU packaging recyclability grades and industrial foam replacement are slated to maintain a 4.4% CAGR.
United Kingdom Greyboard Market Outlook (2026 to 2036)
Greyboard consumption in the United Kingdom is anticipated to rise at a 4.3% CAGR over the 2026 to 2036 period, supported by Scotch whisky presentation tubes, premium beauty boxes and book publishing. Distilleries, cosmetics houses, and publishers in the United Kingdom rely on rigid wrapped greyboard cartons to command luxury export prices while meeting supermarket plastic-free packaging commitments. Data from the October 2026 USDA Foreign Agricultural Service Retail Foods report on the United Kingdom confirms that competition among major grocery chains continues to accelerate fiber packaging adoption across private-label lines [18]. Domestic converters steadily source pre-calendered recycled sheets to shorten setup times on short seasonal runs.
Key takeaway: In the United Kingdom, a record 52.2% private-label grocery share and spirits gift-box demand are estimated to support a 4.3% CAGR.
France Greyboard Market Outlook (2026 to 2036)
Demand for greyboard in France is expected to grow at a 4.2% CAGR between 2026 and 2036 as champagne houses, fragrance brands, and gourmet food producers replace plastic gift-box inserts with sculpted paperboard cradles. National anti-waste legislation in France restricts single-use plastic blisters in prestige retail, prompting luxury packaging designers to engineer multi-layered greyboard compartments wrapped in uncoated art papers. Data from the April 2026 USDA Foreign Agricultural Service Food Processing Ingredients report on France, domestic food and beverage processors continue adapting packaging formats to meet strict environmental labeling rules [19]. Carton makers in France require ultra-smooth calendered greyboard to prevent glue show-through on thin luxury wraps.
Key takeaway: In France, statutory single-use plastic phaseouts and luxury fragrance and champagne coffret production are projected to sustain a 4.2% CAGR.
Italy Greyboard Market Outlook (2026 to 2036)
The greyboard market in Italy is projected to expand at a 4.0% CAGR through 2036, anchored by leather footwear boxes and fashion accessories, premium pasta gift packs and architectural board panels. Footwear and luxury leather goods workshops across Lombardy, Tuscany, and Veneto consume high volumes of 700 to 1,100 GSM greyboard for durable telescopic shoeboxes that withstand international retail distribution. In October 2025, Researchers in Italy writing in Scientific Reports confirmed that recycled cardboard panels engineered from recovered pulp delivered strong low-frequency acoustic insulation and mechanical stability for building applications [20]. Converters in Italy favor regional recycled mills in northern Italy that supply custom sheet sizes on short lead times.
Key takeaway: In Italy, luxury footwear and gourmet gift-box converting across northern industrial districts are anticipated to drive a steady 4.0% CAGR.
Japan Greyboard Market Outlook (2026 to 2036)
Valuation of the greyboard market in Japan is forecast to progress at a 3.7% CAGR from 2026 to 2036 as department-store confectionery brands, electronics makers, and stationery producers maintain exacting presentation standards. Retail gift traditions in Japan require rigid setup boxes with razor-sharp corners, zero odour transfer and smooth interiors, which sustains steady demand for multi-ply recycled board made from clean sorted office waste. Per the April 2026 USDA Foreign Agricultural Service Food Processing Ingredients report on Japan, domestic food manufacturers prioritize high-quality protective packaging for premium retail gift assortments [21]. Mills serving Japan compete on micron-level caliper consistency and spotless surface cleanliness rather than spot price.
Key takeaway: In Japan, exacting department-store confectionery gifting standards and precision stationery converting are predicted to maintain a 3.7% CAGR through 2036.
Full report country CAGRs cover: North America and Latin America and Western Europe and Eastern Europe, East Asia, South Asia and Pacific and Middle East and Africa.
Who are the notable companies in the greyboard market?
Berry Global Group Inc., Sealed Air Corporation, Mondi Group plc, Sonoco Products Company, International Paper Company, Graphic Packaging Holding Company, Stora Enso Oyj, Smurfit Westrock plc, DS Smith plc, and Mayr-Melnhof Karton AG are the notable companies in the greyboard market.
Competitive positioning in the greyboard sector divides integrated recycled paperboard mill operators, multi-material fiber and carton converters, and protective packaging systems providers. Sonoco Products Company, Graphic Packaging Holding Company, Stora Enso Oyj and Mayr-Melnhof Karton AG operate high-capacity recycled and virgin board machines supplying uncoated and coated sheets. Mondi Group plc, International Paper Company, Smurfit Westrock plc and DS Smith plc integrate containerboard and solid board with pan-regional converting networks whereas Sealed Air Corporation and Berry Global Group Inc. compete across protective dunnage and hybrid transit packaging.
- Integrated Paperboard and Recycled Mill Operators: Sonoco Products Company and Graphic Packaging Holding Company, Stora Enso Oyj and Mayr-Melnhof Karton AG manufacture multi-ply uncoated recycled paperboard, greyboard and folding boxboard across high-width cylinder and Fourdrinier machines.
- Global Fiber and Corrugated Converting Groups: Mondi Group plc and International Paper Company, Smurfit Westrock plc and DS Smith plc convert recovered fiberboard, solid board partitions and heavy-duty transit packs across European and United States and Canada box plants.
- Protective Dunnage and Hybrid Packaging Specialists: Sealed Air Corporation and Berry Global Group Inc. supply automated protective cushioning, edge-protection systems, and recycled-content shipping materials that compete with or integrate rigid board.
Competitive Benchmarking: Greyboard Market
Table 8: Competitive Benchmarking for the Greyboard Market (qualitative capability ratings), 2026
| Company | Recycled Board Mill Scale | Rigid Converting Support | Plastic-Replacement Fit | Geographic Reach |
|---|---|---|---|---|
| Graphic Packaging Holding Company | High | High | High | North America and Europe recycled board mills; launched Waco URB grade in July 2026 |
| Sonoco Products Company | High | High | High | Global URB mill network across 37 countries; USD 7.5 billion 2025 continuing operations |
| Stora Enso Oyj | High | High | High | European and Asian renewable board mills; inaugurated Oulu line in August 2025 |
| Mondi Group plc | High | High | High | Europe and North America kraft and recycled board; won 9 WorldStar Awards in January 2026 |
| Smurfit Westrock plc | High | High | High | 500+ packaging operations across 40 countries; USD 7.71 billion Q1 2026 net sales |
| International Paper Company | High | High | High | North America and EMEA fiber packaging leader following 2025 DS Smith acquisition |
| DS Smith plc | Medium | High | High | European circular fiber design centers; industrial plastic-free board replacements |
| Sealed Air Corporation | Medium | High | Medium | Global protective packaging across 117 countries; fiber and recycled cushioning systems |
| Berry Global Group Inc. | Medium | Medium | Medium | Global rigid and protective packaging; combined with Amcor plc in April 2025 |
| Mayr-Melnhof Karton AG | High | Medium | High | European coated and uncoated recycled cartonboard and greyboard mill network |
Evaluation basis: Recycled Board Mill Scale assesses documented first-party recycled paperboard and multi-ply cylinder/Fourdrinier tonnage, whereas Rigid Converting Support rates sheet-cutting precision, caliper range and structural design centers. Plastic-Replacement Fit measures verified commercial deployments replacing polymer foams, trays, and wraps with recyclable fiberboard.
Key Developments in the Greyboard Market
- Stora Enso Oyj inaugurated its EUR 1 billion consumer packaging board production line at its Oulu mill in Finland on August 18, 2025 to supply lightweight, high-stiffness renewable board across European and global converting markets [22].
- Mondi Group plc secured nine WorldStar Packaging Awards on January 14, 2026 for fiber-based innovations including its 3 in 1 Separator corrugated board structure that replaces expanded polystyrene in electronics transit [23].
- DS Smith plc published its technical guidance on the EU Packaging and Packaging Waste Regulation 2025/40 on July 30, 2026 detailing how recyclable fiber and paperboard packaging helps industrial and retail customers meet 2030 circularity targets [24].
Key Players in the Greyboard Market
Integrated Paperboard and Recycled Mill Operators
- Sonoco Products Company
- Graphic Packaging Holding Company
- Stora Enso Oyj
- Mayr-Melnhof Karton AG
Global Fiber and Corrugated Converting Groups
- Mondi Group plc
- International Paper Company
- Smurfit Westrock plc
- DS Smith plc
Protective Dunnage and Hybrid Packaging Specialists
- Sealed Air Corporation
- Berry Global Group Inc.
Greyboard Market - Report Scope
Table 9: Report Scope for the Greyboard Market (coverage fields and definitions), 2026 to 2036
| Coverage field | Report scope |
|---|---|
| Market breakdown | Basis Weight, Material Composition, Surface Finish, End-Use Application, Distribution Channel |
| Quantitative Units | USD Billion |
| Market Definition | Includes commercial manufacturer valuation from uncoated and calendered multi-ply greyboard, chipboard, and solid recycled paperboard sheets and reels (300 GSM to above 1,200 GSM) used in rigid setup boxes, hardcover bookbinding, display mounting, edge protectors, and furniture cores. Category Scope Note: Excludes corrugated fluted containerboard boxes, bleached solid sulfate folding boxboard, and flexible wrapping papers. |
| Regions Covered | North America, Latin America, Western Europe, Eastern Europe, East Asia, South Asia and Pacific, Middle East and Africa |
| Countries Covered | Poland, United States, Canada, Germany, United Kingdom, France, Italy, Japan, and additional countries in the full report |
| Key Companies Covered | Berry Global Group Inc., Sealed Air Corporation, Mondi Group plc, Sonoco Products Company, International Paper Company, Graphic Packaging Holding Company, Stora Enso Oyj, Smurfit Westrock plc, DS Smith plc, Mayr-Melnhof Karton AG |
| Forecast Period | 2026 to 2036 |
| Approach | Primary and secondary research with top-down and bottom-up market triangulation. |
Greyboard Market - Research Methodology
Table 10: Research Methodology for the Greyboard Market (research methods and approach), 2026 edition
| Method | Approach |
|---|---|
| Primary Research | Structured interviews with recycled paperboard mill technical directors, luxury rigid setup box converters, commercial bookbinders, and industrial pallet edge-protector manufacturers to validate GSM caliper mix and per-ton price realizations. |
| Secondary Research | Analysis of Regulation (EU) 2025/40 packaging recyclability rules, USDA FAS national food and retail packaging reports, SEC Form 10-K filings, AF&PA recovery statistics, and peer-reviewed cellulose mechanics literature. |
| Market Sizing and Forecasting | Top-down Global Industrial and Consumer Packaging baseline (where greyboard represents 1.2% share) reconciled against bottom-up physical shipments (6.3M to 6.9M metric tons in 2026) and realized mill prices per ton from 2026 to 2036. |
| Country Forecasting Model | Econometric national models weight rigid box converting plant installations, hardcover publishing output, recovered waste-paper collection rates, and statutory EPR plastic-substitution timelines across eight countries. |
| Operational Benchmark Traceability | Tonnage and converting plant allocation indicators in Tables 2, 3, and 4 trace to AF&PA recovered cardboard balances, SEC mill capacity disclosures, and peer-reviewed board stiffness and barrier assays. |
| Data Triangulation and Validation | Valuation estimates isolate multi-ply uncoated recycled greyboard and rigid chipboard substrates while strictly excluding corrugated shipping cases, liquid beverage cartons, and coated virgin bleached board. |
Greyboard Market by Segments
Greyboard Market segmented by Basis Weight:
- 600 to 1200 GSM Standard Caliper
- 300 to 600 GSM Lightweight Board
- Above 1200 GSM Heavy Industrial Board
Greyboard Market segmented by Material Composition:
- 100% Recycled Waste Paper
- Mixed Mechanical and Waste Pulp Blend
Greyboard Market segmented by Surface Finish:
- Smooth Calendered Finish
- Uncalendered Standard Finish
Greyboard Market segmented by End-Use Application:
- Rigid Luxury Boxes and Setup Cartons
- Book Binding and Hardcover Stationery
- Graphic Display Mounting Boards
- Edge Protectors and Furniture Core
Greyboard Market segmented by Distribution Channel:
- Direct Mill-to-Converter Contracts
- Paperboard Merchants and Sheeting Distributors
- Specialty Packaging Supply Portals
Greyboard Market by Region
- North America
- United States
- Canada
- Latin America
- Brazil
- Mexico
- Argentina
- Chile
- Western Europe
- Germany
- France
- United Kingdom
- Italy
- Spain
- Benelux
- Nordics
- Eastern Europe
- Poland
- Czech Republic
- Romania
- Hungary
- East Asia
- China
- Japan
- South Korea
- South Asia and Pacific
- India
- ASEAN
- Australia and New Zealand
- Middle East and Africa
- GCC Countries
- South Africa
- Türkiye
- Israel
Research Sources and Bibliography
- [1] European Union. (2025, January 22). Regulation (EU) 2025/40 of the European Parliament and of the Council on packaging and packaging waste. Official Journal of the European Union.
- [2] Graphic Packaging Holding Company. (2025, July 29). Graphic Packaging Holding Company Reports Second Quarter 2025 Financial Results and Waco Recycled Paperboard Investment. Graphic Packaging Investor Relations.
- [3] Bastida, G. A. & Delgado-Aguilar, M. (2026, May 19). Mechanical refining of recycled paper structure to optimize polysaccharide-stabilized beeswax barrier coatings. Carbohydrate Polymers, 386, 125463 (PubMed PMID 42230025).
- [4] Stora Enso Oyj. (2025, September 25). Stora Enso introduces Ensovelvet a new premium uncoated paperboard for luxury packaging. Stora Enso Newsroom.
- [5] Kim, S. & Park, J. (2025, September 18). Dynamic Behavior of Corrugated Cardboard Edge Damaged by Vibration Input Environments. Materials, 18(18), 4364 (PubMed PMID 41010207).
- [6] Stora Enso Oyj. (2025, December 18). Standout year in carton innovation at the 2025 European Carton Excellence Awards. Stora Enso Newsroom.
- [7] Graphic Packaging Holding Company. (2026, June 30). Graphic Packaging 2025 Impact Report on 880 Million Plastic Packages Replaced With Paperboard Innovations. Graphic Packaging International Newsroom.
- [8] Billich, E. & van Herwijnen, H. W. G. (2025, August 8). Wettability of Kraft Paper with Biobased Impregnation Resins for the Production of High-Pressure Laminates. ACS Omega, 10(32), 36115 (PubMed PMID 40852241).
- [9] Graphic Packaging Holding Company. (2026, October 2). Graphic Packaging Wins Three 2026 PPC Awards for Paperboard Packaging Design. Graphic Packaging International Newsroom.
- [10] Sonoco Products Company. (2026, June 8). Sonoco Price Increases for Uncoated Recycled Paperboard and Converted Paperboard Products. Sonoco Investor Relations.
- [11] American Forest & Paper Association. (2026, August 1). 2025 Cardboard Recycling Rate and Paperboard Recovery Statistics. American Forest & Paper Association.
- [12] Pigneres, E. & Guillard, V. (2025, May 1). Polymer-coated cardboards as strawberry packaging alternatives under real testing and converting conditions. Food Research International, 208, 116023 (PubMed PMID 40263869).
- [13] Fisher, S. G. & Grunlan, J. C. (2025, October 1). Biopolymer and Carnauba Wax Coating for Improved Paper Oxygen Barrier, Water Vapor Barrier, and Grease Resistance. ACS Applied Materials & Interfaces, 17(39), 55307 (PubMed PMID 40973097).
- [14] USDA Foreign Agricultural Service. (2026, July 27). Poland Exporter Guide Annual Report PL2026-0012. U.S. Department of Agriculture GAIN.
- [15] Graphic Packaging Holding Company. (2026, February 18). Annual Report Pursuant to Section 13 or 15(d) of the Securities Exchange Act of 1934 for Fiscal Year Ended December 31, 2025. U.S. Securities and Exchange Commission EDGAR.
- [16] USDA Foreign Agricultural Service. (2026, August 27). Canada Food Processing Ingredients Annual Report CA2026-0022. U.S. Department of Agriculture GAIN.
- [17] USDA Foreign Agricultural Service. (2026, October 26). Germany Transposes EU Packaging and Packaging Waste Regulation GM2026-0017. U.S. Department of Agriculture GAIN.
- [18] USDA Foreign Agricultural Service. (2026, October 1). United Kingdom Retail Foods Annual Report UK2026-0025. U.S. Department of Agriculture GAIN.
- [19] USDA Foreign Agricultural Service. (2026, April 3). France Food Processing Ingredients Annual Report FR2026-0003. U.S. Department of Agriculture GAIN.
- [20] Rotilio, M. & Cucchiella, F. (2025, October 1). Preliminary studies on recycling cardboard packaging into building products. Scientific Reports, 15(1), 34180 (PubMed PMID 41034271).
- [21] USDA Foreign Agricultural Service. (2026, April 1). Japan Food Processing Ingredients Annual Report JA2026-0012. U.S. Department of Agriculture GAIN.
- [22] Stora Enso Oyj. (2025, August 18). Stora Enso billion-euro investment in renewable packaging consumer board production line inaugurated in Finland. Stora Enso Newsroom.
- [23] Mondi Group plc. (2026, January 14). Mondi recognised with nine WorldStar Awards for packaging innovation. Mondi Group Newsroom.
- [24] DS Smith plc. (2026, July 30). PPWR The Packaging and Packaging Waste Regulation 2025/40 Explained for Fiber Packaging. DS Smith Media Stories.
- [25] Somsesta, N. & Hongrattanavichit, I. (2025, July 16). Surface-coated paper packaging with nanocellulose modified with quaternary ammonium organosilane and precipitated calcium carbonate. Scientific Reports, 15(1), 25723 (PubMed PMID 40670488).
- [26] Sonoco Products Company. (2026, February 16). Sonoco Reports Fourth Quarter and Full Year 2025 Results. Sonoco Investor Relations.
- [27] Smurfit Westrock plc. (2026, April 30). Smurfit Westrock Reports First Quarter 2026 Results. Smurfit Westrock Newsroom.
- [28] Sealed Air Corporation. (2026, January 26). Sealed Air Celebrates Protective Packaging Innovation and 90-Percent Recycled-Content Portfolio. Sealed Air Media Center.
This bibliography is provided for reader reference and is not exhaustive. The full report contains the complete reference list and detailed citations.
This Report Answers
- How large is the greyboard market in 2026 and what is forecast for 2036?
- Which statutory plastic-replacement rules and rigid box converting trends support demand for greyboard?
- Why does 600 to 1200 GSM Standard Caliper lead the basis weight category?
- Why does 100% Recycled Waste Paper lead the material composition category globally?
- How do growth rates differ across Poland and the United States and Canada, France, Italy and Japan?
- Which leading companies operate integrated recycled board mills versus pan-regional converting networks?
- What moisture absorption and warping risks restrain uncalibrated greyboard use in humid supply chains?
- What should rigid box converters evaluate before switching from virgin board or plastic inserts to recycled greyboard?
Table of Content
Table of Content
- Key Takeaways
- Market Size and CAGR
- Top Growth Driver
- Fastest Growing Segment
- Leading Region
- Key Companies
- Emerging Opportunities
- Executive Summary
- Global Market Outlook
- Demand-side Trends
- Supply-side Trends
- Technology Roadmap Analysis
- Analysis and Recommendations
- Analyst Perspective (What is happening? Why now? What should investors know?)
- Key Questions Answered
- How large is the market?
- What is the CAGR?
- What are key trends?
- Which region dominates?
- Who are the leaders?
Read More...
- Market Overview
- Market Coverage / Taxonomy
- Market Definition / Scope / Limitations
- Research Methodology
- Chapter Orientation
- Analytical Lens and Working Hypotheses
- Market Structure, Signals, and Trend Drivers
- Benchmarking and Cross-market Comparability
- Market Sizing, Forecasting, and Opportunity Mapping
- Research Design and Evidence Framework
- Desk Research Programme (Secondary Evidence)
- Expert Input and Fieldwork (Primary Evidence)
- Tooling, Models, and Reference Databases
- Data Engineering and Model Build
- Quality Assurance and Audit Trail
- Market Background
- Market Dynamics (Drivers, Restraints, Opportunity, Trends)
- Scenario Forecast (Optimistic, Likely, Conservative)
- Impact Analysis
- AI Impact
- Sustainability Impact
- Regulatory Impact
- Technology Impact
- Consumer / Buyer Analysis
- Purchase Drivers
- Adoption Barriers
- Buyer Journey
- Opportunity Map Analysis
- Product Life Cycle Analysis
- Supply Chain Analysis
- Investment Feasibility Matrix
- Value Chain Analysis
- PESTLE and Porter's Analysis
- Regulatory Landscape
- Regional Parent Market Outlook
- Production and Consumption Statistics
- Import and Export Statistics
- Global Market Analysis and Forecast, 2021 to 2036
- Historical Market Size Value (USD Billion) Analysis, 2021 to 2025
- Current and Future Market Size Value (USD Billion) Projections, 2026 to 2036
- Y-o-Y Growth Trend Analysis
- Absolute $ Opportunity Analysis
- Global Market Pricing Analysis, 2021 to 2036
- Global Market Analysis and Forecast, By Basis Weight, 2021 to 2036
- Introduction / Key Findings
- Historical Market Size Value (USD Billion) Analysis By Basis Weight, 2021 to 2025
- Current and Future Market Size Value (USD Billion) Analysis and Forecast By Basis Weight, 2026 to 2036
- 600 to 1200 GSM Standard Caliper
- 300 to 600 GSM Lightweight Board
- Above 1200 GSM Heavy Industrial Board
- Y-o-Y Growth Trend Analysis By Basis Weight, 2021 to 2025
- Absolute $ Opportunity Analysis By Basis Weight, 2026 to 2036
- Global Market Analysis and Forecast, By Material Composition, 2021 to 2036
- Introduction / Key Findings
- Historical Market Size Value (USD Billion) Analysis By Material Composition, 2021 to 2025
- Current and Future Market Size Value (USD Billion) Analysis and Forecast By Material Composition, 2026 to 2036
- 100% Recycled Waste Paper
- Mixed Mechanical and Waste Pulp Blend
- Y-o-Y Growth Trend Analysis By Material Composition, 2021 to 2025
- Absolute $ Opportunity Analysis By Material Composition, 2026 to 2036
- Global Market Analysis and Forecast, By Surface Finish, 2021 to 2036
- Introduction / Key Findings
- Historical Market Size Value (USD Billion) Analysis By Surface Finish, 2021 to 2025
- Current and Future Market Size Value (USD Billion) Analysis and Forecast By Surface Finish, 2026 to 2036
- Smooth Calendered Finish
- Uncalendered Standard Finish
- Y-o-Y Growth Trend Analysis By Surface Finish, 2021 to 2025
- Absolute $ Opportunity Analysis By Surface Finish, 2026 to 2036
- Global Market Analysis and Forecast, By End-Use Application, 2021 to 2036
- Introduction / Key Findings
- Historical Market Size Value (USD Billion) Analysis By End-Use Application, 2021 to 2025
- Current and Future Market Size Value (USD Billion) Analysis and Forecast By End-Use Application, 2026 to 2036
- Rigid Luxury Boxes and Setup Cartons
- Book Binding and Hardcover Stationery
- Graphic Display Mounting Boards
- Edge Protectors and Furniture Core
- Y-o-Y Growth Trend Analysis By End-Use Application, 2021 to 2025
- Absolute $ Opportunity Analysis By End-Use Application, 2026 to 2036
- Global Market Analysis and Forecast, By Distribution Channel, 2021 to 2036
- Introduction / Key Findings
- Historical Market Size Value (USD Billion) Analysis By Distribution Channel, 2021 to 2025
- Current and Future Market Size Value (USD Billion) Analysis and Forecast By Distribution Channel, 2026 to 2036
- Direct Mill-to-Converter Contracts
- Paperboard Merchants and Sheeting Distributors
- Specialty Packaging Supply Portals
- Y-o-Y Growth Trend Analysis By Distribution Channel, 2021 to 2025
- Absolute $ Opportunity Analysis By Distribution Channel, 2026 to 2036
- Global Market Analysis and Forecast, By Region, 2021 to 2036
- Introduction
- Historical Market Size Value (USD Billion) Analysis By Region, 2021 to 2025
- Current Market Size Value (USD Billion) Analysis and Forecast By Region, 2026 to 2036
- North America
- Latin America
- Western Europe
- Eastern Europe
- East Asia
- South Asia and Pacific
- Middle East and Africa
- Market Attractiveness Analysis By Region
- North America Market Analysis and Forecast, By Country, 2021 to 2036
- Historical Market Size Value (USD Billion) Trend Analysis By Market Taxonomy, 2021 to 2025
- Market Size Value (USD Billion) Forecast By Market Taxonomy, 2026 to 2036
- By Country
- United States
- Canada
- By Basis Weight
- By Material Composition
- By Surface Finish
- By End-Use Application
- By Distribution Channel
- By Country
- Market Attractiveness Analysis
- By Country
- By Basis Weight
- By Material Composition
- By Surface Finish
- By End-Use Application
- By Distribution Channel
- Key Takeaways
- Latin America Market Analysis and Forecast, By Country
- Historical Market Size Value (USD Billion) Trend Analysis By Market Taxonomy, 2021 to 2025
- Market Size Value (USD Billion) Forecast By Market Taxonomy, 2026 to 2036
- By Country
- Brazil
- Mexico
- Argentina
- Chile
- By Basis Weight
- By Material Composition
- By Surface Finish
- By End-Use Application
- By Distribution Channel
- By Country
- Market Attractiveness Analysis
- By Country
- By Basis Weight
- By Material Composition
- By Surface Finish
- By End-Use Application
- By Distribution Channel
- Key Takeaways
- Western Europe Market Analysis and Forecast, By Country
- Historical Market Size Value (USD Billion) Trend Analysis By Market Taxonomy, 2021 to 2025
- Market Size Value (USD Billion) Forecast By Market Taxonomy, 2026 to 2036
- By Country
- Germany
- France
- United Kingdom
- Italy
- Spain
- Benelux
- Nordics
- By Basis Weight
- By Material Composition
- By Surface Finish
- By End-Use Application
- By Distribution Channel
- By Country
- Market Attractiveness Analysis
- By Country
- By Basis Weight
- By Material Composition
- By Surface Finish
- By End-Use Application
- By Distribution Channel
- Key Takeaways
- Eastern Europe Market Analysis and Forecast, By Country
- Historical Market Size Value (USD Billion) Trend Analysis By Market Taxonomy, 2021 to 2025
- Market Size Value (USD Billion) Forecast By Market Taxonomy, 2026 to 2036
- By Country
- Poland
- Czech Republic
- Romania
- Hungary
- By Basis Weight
- By Material Composition
- By Surface Finish
- By End-Use Application
- By Distribution Channel
- By Country
- Market Attractiveness Analysis
- By Country
- By Basis Weight
- By Material Composition
- By Surface Finish
- By End-Use Application
- By Distribution Channel
- Key Takeaways
- East Asia Market Analysis and Forecast, By Country
- Historical Market Size Value (USD Billion) Trend Analysis By Market Taxonomy, 2021 to 2025
- Market Size Value (USD Billion) Forecast By Market Taxonomy, 2026 to 2036
- By Country
- China
- Japan
- South Korea
- By Basis Weight
- By Material Composition
- By Surface Finish
- By End-Use Application
- By Distribution Channel
- By Country
- Market Attractiveness Analysis
- By Country
- By Basis Weight
- By Material Composition
- By Surface Finish
- By End-Use Application
- By Distribution Channel
- Key Takeaways
- South Asia and Pacific Market Analysis and Forecast, By Country
- Historical Market Size Value (USD Billion) Trend Analysis By Market Taxonomy, 2021 to 2025
- Market Size Value (USD Billion) Forecast By Market Taxonomy, 2026 to 2036
- By Country
- India
- ASEAN
- Australia and New Zealand
- By Basis Weight
- By Material Composition
- By Surface Finish
- By End-Use Application
- By Distribution Channel
- By Country
- Market Attractiveness Analysis
- By Country
- By Basis Weight
- By Material Composition
- By Surface Finish
- By End-Use Application
- By Distribution Channel
- Key Takeaways
- Middle East and Africa Market Analysis and Forecast, By Country
- Historical Market Size Value (USD Billion) Trend Analysis By Market Taxonomy, 2021 to 2025
- Market Size Value (USD Billion) Forecast By Market Taxonomy, 2026 to 2036
- By Country
- GCC Countries
- South Africa
- Türkiye
- Israel
- By Basis Weight
- By Material Composition
- By Surface Finish
- By End-Use Application
- By Distribution Channel
- By Country
- Market Attractiveness Analysis
- By Country
- By Basis Weight
- By Material Composition
- By Surface Finish
- By End-Use Application
- By Distribution Channel
- Key Takeaways
- Key Countries Market Analysis
- United States
- Pricing Analysis
- Market Share Analysis, 2025
- By Basis Weight
- By Material Composition
- By Surface Finish
- By End-Use Application
- By Distribution Channel
- Canada
- Pricing Analysis
- Market Share Analysis, 2025
- By Basis Weight
- By Material Composition
- By Surface Finish
- By End-Use Application
- By Distribution Channel
- Mexico
- Pricing Analysis
- Market Share Analysis, 2025
- By Basis Weight
- By Material Composition
- By Surface Finish
- By End-Use Application
- By Distribution Channel
- Brazil
- Pricing Analysis
- Market Share Analysis, 2025
- By Basis Weight
- By Material Composition
- By Surface Finish
- By End-Use Application
- By Distribution Channel
- Chile
- Pricing Analysis
- Market Share Analysis, 2025
- By Basis Weight
- By Material Composition
- By Surface Finish
- By End-Use Application
- By Distribution Channel
- Germany
- Pricing Analysis
- Market Share Analysis, 2025
- By Basis Weight
- By Material Composition
- By Surface Finish
- By End-Use Application
- By Distribution Channel
- United Kingdom
- Pricing Analysis
- Market Share Analysis, 2025
- By Basis Weight
- By Material Composition
- By Surface Finish
- By End-Use Application
- By Distribution Channel
- Italy
- Pricing Analysis
- Market Share Analysis, 2025
- By Basis Weight
- By Material Composition
- By Surface Finish
- By End-Use Application
- By Distribution Channel
- Spain
- Pricing Analysis
- Market Share Analysis, 2025
- By Basis Weight
- By Material Composition
- By Surface Finish
- By End-Use Application
- By Distribution Channel
- France
- Pricing Analysis
- Market Share Analysis, 2025
- By Basis Weight
- By Material Composition
- By Surface Finish
- By End-Use Application
- By Distribution Channel
- India
- Pricing Analysis
- Market Share Analysis, 2025
- By Basis Weight
- By Material Composition
- By Surface Finish
- By End-Use Application
- By Distribution Channel
- ASEAN
- Pricing Analysis
- Market Share Analysis, 2025
- By Basis Weight
- By Material Composition
- By Surface Finish
- By End-Use Application
- By Distribution Channel
- Australia and New Zealand
- Pricing Analysis
- Market Share Analysis, 2025
- By Basis Weight
- By Material Composition
- By Surface Finish
- By End-Use Application
- By Distribution Channel
- China
- Pricing Analysis
- Market Share Analysis, 2025
- By Basis Weight
- By Material Composition
- By Surface Finish
- By End-Use Application
- By Distribution Channel
- Japan
- Pricing Analysis
- Market Share Analysis, 2025
- By Basis Weight
- By Material Composition
- By Surface Finish
- By End-Use Application
- By Distribution Channel
- South Korea
- Pricing Analysis
- Market Share Analysis, 2025
- By Basis Weight
- By Material Composition
- By Surface Finish
- By End-Use Application
- By Distribution Channel
- Poland
- Pricing Analysis
- Market Share Analysis, 2025
- By Basis Weight
- By Material Composition
- By Surface Finish
- By End-Use Application
- By Distribution Channel
- Hungary
- Pricing Analysis
- Market Share Analysis, 2025
- By Basis Weight
- By Material Composition
- By Surface Finish
- By End-Use Application
- By Distribution Channel
- Türkiye
- Pricing Analysis
- Market Share Analysis, 2025
- By Basis Weight
- By Material Composition
- By Surface Finish
- By End-Use Application
- By Distribution Channel
- South Africa
- Pricing Analysis
- Market Share Analysis, 2025
- By Basis Weight
- By Material Composition
- By Surface Finish
- By End-Use Application
- By Distribution Channel
- United States
- Market Structure Analysis
- Competition Dashboard
- Competition Benchmarking
- Market Share Analysis of Top Players
- By Regional
- By Basis Weight
- By Material Composition
- By Surface Finish
- By End-Use Application
- By Distribution Channel
- Emerging Startups
- Innovation Benchmarking
- Competition Analysis
- Competition Deep Dive
- Graphic Packaging Holding Company
- Overview
- Product Portfolio
- Profitability by Market Segments
- Sales Footprint
- Strategy Overview
- Marketing Strategy
- Product Strategy
- Channel Strategy
- Sonoco Products Company
- Stora Enso Oyj
- Mondi Group plc
- Smurfit Westrock plc
- International Paper Company
- DS Smith plc
- Sealed Air Corporation
- Berry Global Group Inc.
- Mayr-Melnhof Karton AG
- Graphic Packaging Holding Company
- Case Studies
- Success Stories
- Recent Developments
- Competition Deep Dive
- Assumptions & Acronyms Used
List of Tables
- Table 1: Global Market Value (USD Billion) Forecast by Region, 2021 to 2036
- Table 2: Global Market Value (USD Billion) Forecast by Basis Weight, 2021 to 2036
- Table 3: Global Market Value (USD Billion) Forecast by Material Composition, 2021 to 2036
- Table 4: Global Market Value (USD Billion) Forecast by Surface Finish, 2021 to 2036
- Table 5: Global Market Value (USD Billion) Forecast by End-Use Application, 2021 to 2036
- Table 6: Global Market Value (USD Billion) Forecast by Distribution Channel, 2021 to 2036
- Table 7: North America Market Value (USD Billion) Forecast by Country, 2021 to 2036
- Table 8: North America Market Value (USD Billion) Forecast by Basis Weight, 2021 to 2036
- Table 9: North America Market Value (USD Billion) Forecast by Material Composition, 2021 to 2036
- Table 10: North America Market Value (USD Billion) Forecast by Surface Finish, 2021 to 2036
- Table 11: North America Market Value (USD Billion) Forecast by End-Use Application, 2021 to 2036
- Table 12: North America Market Value (USD Billion) Forecast by Distribution Channel, 2021 to 2036
- Table 13: Latin America Market Value (USD Billion) Forecast by Country, 2021 to 2036
- Table 14: Latin America Market Value (USD Billion) Forecast by Basis Weight, 2021 to 2036
- Table 15: Latin America Market Value (USD Billion) Forecast by Material Composition, 2021 to 2036
- Table 16: Latin America Market Value (USD Billion) Forecast by Surface Finish, 2021 to 2036
- Table 17: Latin America Market Value (USD Billion) Forecast by End-Use Application, 2021 to 2036
- Table 18: Latin America Market Value (USD Billion) Forecast by Distribution Channel, 2021 to 2036
- Table 19: Western Europe Market Value (USD Billion) Forecast by Country, 2021 to 2036
- Table 20: Western Europe Market Value (USD Billion) Forecast by Basis Weight, 2021 to 2036
- Table 21: Western Europe Market Value (USD Billion) Forecast by Material Composition, 2021 to 2036
- Table 22: Western Europe Market Value (USD Billion) Forecast by Surface Finish, 2021 to 2036
- Table 23: Western Europe Market Value (USD Billion) Forecast by End-Use Application, 2021 to 2036
- Table 24: Western Europe Market Value (USD Billion) Forecast by Distribution Channel, 2021 to 2036
- Table 25: Eastern Europe Market Value (USD Billion) Forecast by Country, 2021 to 2036
- Table 26: Eastern Europe Market Value (USD Billion) Forecast by Basis Weight, 2021 to 2036
- Table 27: Eastern Europe Market Value (USD Billion) Forecast by Material Composition, 2021 to 2036
- Table 28: Eastern Europe Market Value (USD Billion) Forecast by Surface Finish, 2021 to 2036
- Table 29: Eastern Europe Market Value (USD Billion) Forecast by End-Use Application, 2021 to 2036
- Table 30: Eastern Europe Market Value (USD Billion) Forecast by Distribution Channel, 2021 to 2036
- Table 31: East Asia Market Value (USD Billion) Forecast by Country, 2021 to 2036
- Table 32: East Asia Market Value (USD Billion) Forecast by Basis Weight, 2021 to 2036
- Table 33: East Asia Market Value (USD Billion) Forecast by Material Composition, 2021 to 2036
- Table 34: East Asia Market Value (USD Billion) Forecast by Surface Finish, 2021 to 2036
- Table 35: East Asia Market Value (USD Billion) Forecast by End-Use Application, 2021 to 2036
- Table 36: East Asia Market Value (USD Billion) Forecast by Distribution Channel, 2021 to 2036
- Table 37: South Asia and Pacific Market Value (USD Billion) Forecast by Country, 2021 to 2036
- Table 38: South Asia and Pacific Market Value (USD Billion) Forecast by Basis Weight, 2021 to 2036
- Table 39: South Asia and Pacific Market Value (USD Billion) Forecast by Material Composition, 2021 to 2036
- Table 40: South Asia and Pacific Market Value (USD Billion) Forecast by Surface Finish, 2021 to 2036
- Table 41: South Asia and Pacific Market Value (USD Billion) Forecast by End-Use Application, 2021 to 2036
- Table 42: South Asia and Pacific Market Value (USD Billion) Forecast by Distribution Channel, 2021 to 2036
- Table 43: Middle East and Africa Market Value (USD Billion) Forecast by Country, 2021 to 2036
- Table 44: Middle East and Africa Market Value (USD Billion) Forecast by Basis Weight, 2021 to 2036
- Table 45: Middle East and Africa Market Value (USD Billion) Forecast by Material Composition, 2021 to 2036
- Table 46: Middle East and Africa Market Value (USD Billion) Forecast by Surface Finish, 2021 to 2036
- Table 47: Middle East and Africa Market Value (USD Billion) Forecast by End-Use Application, 2021 to 2036
- Table 48: Middle East and Africa Market Value (USD Billion) Forecast by Distribution Channel, 2021 to 2036
List of Figures
- Figure 1: Global Market Pricing Analysis
- Figure 2: Global Market Value (USD Billion) Forecast 2021-2036
- Figure 3: Global Market Value Share and BPS Analysis by Basis Weight, 2026 and 2036
- Figure 4: Global Market Y-o-Y Growth Comparison by Basis Weight, 2026-2036
- Figure 5: Global Market Attractiveness Analysis by Basis Weight
- Figure 6: Global Market Value Share and BPS Analysis by Material Composition, 2026 and 2036
- Figure 7: Global Market Y-o-Y Growth Comparison by Material Composition, 2026-2036
- Figure 8: Global Market Attractiveness Analysis by Material Composition
- Figure 9: Global Market Value Share and BPS Analysis by Surface Finish, 2026 and 2036
- Figure 10: Global Market Y-o-Y Growth Comparison by Surface Finish, 2026-2036
- Figure 11: Global Market Attractiveness Analysis by Surface Finish
- Figure 12: Global Market Value Share and BPS Analysis by End-Use Application, 2026 and 2036
- Figure 13: Global Market Y-o-Y Growth Comparison by End-Use Application, 2026-2036
- Figure 14: Global Market Attractiveness Analysis by End-Use Application
- Figure 15: Global Market Value Share and BPS Analysis by Distribution Channel, 2026 and 2036
- Figure 16: Global Market Y-o-Y Growth Comparison by Distribution Channel, 2026-2036
- Figure 17: Global Market Attractiveness Analysis by Distribution Channel
- Figure 18: Global Market Value (USD Billion) Share and BPS Analysis by Region, 2026 and 2036
- Figure 19: Global Market Y-o-Y Growth Comparison by Region, 2026-2036
- Figure 20: Global Market Attractiveness Analysis by Region
- Figure 21: North America Market Incremental Dollar Opportunity, 2026-2036
- Figure 22: Latin America Market Incremental Dollar Opportunity, 2026-2036
- Figure 23: Western Europe Market Incremental Dollar Opportunity, 2026-2036
- Figure 24: Eastern Europe Market Incremental Dollar Opportunity, 2026-2036
- Figure 25: East Asia Market Incremental Dollar Opportunity, 2026-2036
- Figure 26: South Asia and Pacific Market Incremental Dollar Opportunity, 2026-2036
- Figure 27: Middle East and Africa Market Incremental Dollar Opportunity, 2026-2036
- Figure 28: North America Market Value Share and BPS Analysis by Country, 2026 and 2036
- Figure 29: North America Market Value Share and BPS Analysis by Basis Weight, 2026 and 2036
- Figure 30: North America Market Y-o-Y Growth Comparison by Basis Weight, 2026-2036
- Figure 31: North America Market Attractiveness Analysis by Basis Weight
- Figure 32: North America Market Value Share and BPS Analysis by Material Composition, 2026 and 2036
- Figure 33: North America Market Y-o-Y Growth Comparison by Material Composition, 2026-2036
- Figure 34: North America Market Attractiveness Analysis by Material Composition
- Figure 35: North America Market Value Share and BPS Analysis by Surface Finish, 2026 and 2036
- Figure 36: North America Market Y-o-Y Growth Comparison by Surface Finish, 2026-2036
- Figure 37: North America Market Attractiveness Analysis by Surface Finish
- Figure 38: North America Market Value Share and BPS Analysis by End-Use Application, 2026 and 2036
- Figure 39: North America Market Y-o-Y Growth Comparison by End-Use Application, 2026-2036
- Figure 40: North America Market Attractiveness Analysis by End-Use Application
- Figure 41: North America Market Value Share and BPS Analysis by Distribution Channel, 2026 and 2036
- Figure 42: North America Market Y-o-Y Growth Comparison by Distribution Channel, 2026-2036
- Figure 43: North America Market Attractiveness Analysis by Distribution Channel
- Figure 44: Latin America Market Value Share and BPS Analysis by Country, 2026 and 2036
- Figure 45: Latin America Market Value Share and BPS Analysis by Basis Weight, 2026 and 2036
- Figure 46: Latin America Market Y-o-Y Growth Comparison by Basis Weight, 2026-2036
- Figure 47: Latin America Market Attractiveness Analysis by Basis Weight
- Figure 48: Latin America Market Value Share and BPS Analysis by Material Composition, 2026 and 2036
- Figure 49: Latin America Market Y-o-Y Growth Comparison by Material Composition, 2026-2036
- Figure 50: Latin America Market Attractiveness Analysis by Material Composition
- Figure 51: Latin America Market Value Share and BPS Analysis by Surface Finish, 2026 and 2036
- Figure 52: Latin America Market Y-o-Y Growth Comparison by Surface Finish, 2026-2036
- Figure 53: Latin America Market Attractiveness Analysis by Surface Finish
- Figure 54: Latin America Market Value Share and BPS Analysis by End-Use Application, 2026 and 2036
- Figure 55: Latin America Market Y-o-Y Growth Comparison by End-Use Application, 2026-2036
- Figure 56: Latin America Market Attractiveness Analysis by End-Use Application
- Figure 57: Latin America Market Value Share and BPS Analysis by Distribution Channel, 2026 and 2036
- Figure 58: Latin America Market Y-o-Y Growth Comparison by Distribution Channel, 2026-2036
- Figure 59: Latin America Market Attractiveness Analysis by Distribution Channel
- Figure 60: Western Europe Market Value Share and BPS Analysis by Country, 2026 and 2036
- Figure 61: Western Europe Market Value Share and BPS Analysis by Basis Weight, 2026 and 2036
- Figure 62: Western Europe Market Y-o-Y Growth Comparison by Basis Weight, 2026-2036
- Figure 63: Western Europe Market Attractiveness Analysis by Basis Weight
- Figure 64: Western Europe Market Value Share and BPS Analysis by Material Composition, 2026 and 2036
- Figure 65: Western Europe Market Y-o-Y Growth Comparison by Material Composition, 2026-2036
- Figure 66: Western Europe Market Attractiveness Analysis by Material Composition
- Figure 67: Western Europe Market Value Share and BPS Analysis by Surface Finish, 2026 and 2036
- Figure 68: Western Europe Market Y-o-Y Growth Comparison by Surface Finish, 2026-2036
- Figure 69: Western Europe Market Attractiveness Analysis by Surface Finish
- Figure 70: Western Europe Market Value Share and BPS Analysis by End-Use Application, 2026 and 2036
- Figure 71: Western Europe Market Y-o-Y Growth Comparison by End-Use Application, 2026-2036
- Figure 72: Western Europe Market Attractiveness Analysis by End-Use Application
- Figure 73: Western Europe Market Value Share and BPS Analysis by Distribution Channel, 2026 and 2036
- Figure 74: Western Europe Market Y-o-Y Growth Comparison by Distribution Channel, 2026-2036
- Figure 75: Western Europe Market Attractiveness Analysis by Distribution Channel
- Figure 76: Eastern Europe Market Value Share and BPS Analysis by Country, 2026 and 2036
- Figure 77: Eastern Europe Market Value Share and BPS Analysis by Basis Weight, 2026 and 2036
- Figure 78: Eastern Europe Market Y-o-Y Growth Comparison by Basis Weight, 2026-2036
- Figure 79: Eastern Europe Market Attractiveness Analysis by Basis Weight
- Figure 80: Eastern Europe Market Value Share and BPS Analysis by Material Composition, 2026 and 2036
- Figure 81: Eastern Europe Market Y-o-Y Growth Comparison by Material Composition, 2026-2036
- Figure 82: Eastern Europe Market Attractiveness Analysis by Material Composition
- Figure 83: Eastern Europe Market Value Share and BPS Analysis by Surface Finish, 2026 and 2036
- Figure 84: Eastern Europe Market Y-o-Y Growth Comparison by Surface Finish, 2026-2036
- Figure 85: Eastern Europe Market Attractiveness Analysis by Surface Finish
- Figure 86: Eastern Europe Market Value Share and BPS Analysis by End-Use Application, 2026 and 2036
- Figure 87: Eastern Europe Market Y-o-Y Growth Comparison by End-Use Application, 2026-2036
- Figure 88: Eastern Europe Market Attractiveness Analysis by End-Use Application
- Figure 89: Eastern Europe Market Value Share and BPS Analysis by Distribution Channel, 2026 and 2036
- Figure 90: Eastern Europe Market Y-o-Y Growth Comparison by Distribution Channel, 2026-2036
- Figure 91: Eastern Europe Market Attractiveness Analysis by Distribution Channel
- Figure 92: East Asia Market Value Share and BPS Analysis by Country, 2026 and 2036
- Figure 93: East Asia Market Value Share and BPS Analysis by Basis Weight, 2026 and 2036
- Figure 94: East Asia Market Y-o-Y Growth Comparison by Basis Weight, 2026-2036
- Figure 95: East Asia Market Attractiveness Analysis by Basis Weight
- Figure 96: East Asia Market Value Share and BPS Analysis by Material Composition, 2026 and 2036
- Figure 97: East Asia Market Y-o-Y Growth Comparison by Material Composition, 2026-2036
- Figure 98: East Asia Market Attractiveness Analysis by Material Composition
- Figure 99: East Asia Market Value Share and BPS Analysis by Surface Finish, 2026 and 2036
- Figure 100: East Asia Market Y-o-Y Growth Comparison by Surface Finish, 2026-2036
- Figure 101: East Asia Market Attractiveness Analysis by Surface Finish
- Figure 102: East Asia Market Value Share and BPS Analysis by End-Use Application, 2026 and 2036
- Figure 103: East Asia Market Y-o-Y Growth Comparison by End-Use Application, 2026-2036
- Figure 104: East Asia Market Attractiveness Analysis by End-Use Application
- Figure 105: East Asia Market Value Share and BPS Analysis by Distribution Channel, 2026 and 2036
- Figure 106: East Asia Market Y-o-Y Growth Comparison by Distribution Channel, 2026-2036
- Figure 107: East Asia Market Attractiveness Analysis by Distribution Channel
- Figure 108: South Asia and Pacific Market Value Share and BPS Analysis by Country, 2026 and 2036
- Figure 109: South Asia and Pacific Market Value Share and BPS Analysis by Basis Weight, 2026 and 2036
- Figure 110: South Asia and Pacific Market Y-o-Y Growth Comparison by Basis Weight, 2026-2036
- Figure 111: South Asia and Pacific Market Attractiveness Analysis by Basis Weight
- Figure 112: South Asia and Pacific Market Value Share and BPS Analysis by Material Composition, 2026 and 2036
- Figure 113: South Asia and Pacific Market Y-o-Y Growth Comparison by Material Composition, 2026-2036
- Figure 114: South Asia and Pacific Market Attractiveness Analysis by Material Composition
- Figure 115: South Asia and Pacific Market Value Share and BPS Analysis by Surface Finish, 2026 and 2036
- Figure 116: South Asia and Pacific Market Y-o-Y Growth Comparison by Surface Finish, 2026-2036
- Figure 117: South Asia and Pacific Market Attractiveness Analysis by Surface Finish
- Figure 118: South Asia and Pacific Market Value Share and BPS Analysis by End-Use Application, 2026 and 2036
- Figure 119: South Asia and Pacific Market Y-o-Y Growth Comparison by End-Use Application, 2026-2036
- Figure 120: South Asia and Pacific Market Attractiveness Analysis by End-Use Application
- Figure 121: South Asia and Pacific Market Value Share and BPS Analysis by Distribution Channel, 2026 and 2036
- Figure 122: South Asia and Pacific Market Y-o-Y Growth Comparison by Distribution Channel, 2026-2036
- Figure 123: South Asia and Pacific Market Attractiveness Analysis by Distribution Channel
- Figure 124: Middle East and Africa Market Value Share and BPS Analysis by Country, 2026 and 2036
- Figure 125: Middle East and Africa Market Value Share and BPS Analysis by Basis Weight, 2026 and 2036
- Figure 126: Middle East and Africa Market Y-o-Y Growth Comparison by Basis Weight, 2026-2036
- Figure 127: Middle East and Africa Market Attractiveness Analysis by Basis Weight
- Figure 128: Middle East and Africa Market Value Share and BPS Analysis by Material Composition, 2026 and 2036
- Figure 129: Middle East and Africa Market Y-o-Y Growth Comparison by Material Composition, 2026-2036
- Figure 130: Middle East and Africa Market Attractiveness Analysis by Material Composition
- Figure 131: Middle East and Africa Market Value Share and BPS Analysis by Surface Finish, 2026 and 2036
- Figure 132: Middle East and Africa Market Y-o-Y Growth Comparison by Surface Finish, 2026-2036
- Figure 133: Middle East and Africa Market Attractiveness Analysis by Surface Finish
- Figure 134: Middle East and Africa Market Value Share and BPS Analysis by End-Use Application, 2026 and 2036
- Figure 135: Middle East and Africa Market Y-o-Y Growth Comparison by End-Use Application, 2026-2036
- Figure 136: Middle East and Africa Market Attractiveness Analysis by End-Use Application
- Figure 137: Middle East and Africa Market Value Share and BPS Analysis by Distribution Channel, 2026 and 2036
- Figure 138: Middle East and Africa Market Y-o-Y Growth Comparison by Distribution Channel, 2026-2036
- Figure 139: Middle East and Africa Market Attractiveness Analysis by Distribution Channel
- Figure 140: Global Market - Tier Structure Analysis
- Figure 141: Global Market - Company Share Analysis
Frequently Asked Questions
How big is the greyboard market in 2026, and what is forecast for 2036?
Global greyboard market size reached USD 4.5 billion in 2025 and advances to USD 4.7 billion in 2026. Total valuation will hit USD 7.3 billion by 2036 as luxury box makers and bookbinders standardize on recycled fiberboard cores.
What is the CAGR for the greyboard market from 2026 to 2036?
Greyboard demand is forecast to grow at a 4.5% CAGR from 2026 to 2036, generating USD 2.6 billion in net added valuation across setup cartons, bookbinding and pallet protectors.
Which basis weight segment leads the greyboard market?
600 to 1200 GSM Standard Caliper grades hold 56.4% of basis weight demand in 2026 because 1.0 to 2.0 millimeter calipers provide optimal V-grooving accuracy and corner crush resistance on automated box lines.
Which material composition segment leads the greyboard market?
100% Recycled Waste Paper accounts for 76.8% of the material composition category in 2026 as post-consumer newspaper and corrugated furnishes lower fiber cost per ton and satisfy EU PPWR recyclability grades.
Which country has a notable growth outlook during the assessment period?
Poland leads national expansion projections at a 5.3% CAGR through 2036, supported by Central European luxury rigid box converting plants and furniture honeycomb core manufacturing.
Who are the key players in the market?
Active suppliers include Berry Global Group Inc. and Sealed Air Corporation with Mondi Group plc and Sonoco Products Company. International Paper Company and Graphic Packaging Holding Company also compete with Stora Enso Oyj, Smurfit Westrock plc, DS Smith plc and Mayr-Melnhof Karton AG.
Preview the report firsthand - request a free sample
Get SampleGet the brochure for pricing and purchase details.
Get PDF
