Human Identification Market
Recognition Affirmation! Forensics, Paternity Testing, Disaster Victim Identification, & Anthropology - Few of the Many Fields to Adopt Human Identification Techniques. Here’s more.
Human Identification Market by Product, Technology, Application, End User & Region | Forecast 2023 to 2033
Human Identification Market Outlook (2023 to 2033)
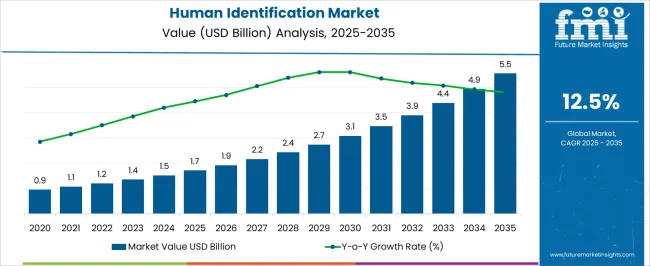
The global human identification demand is anticipated to accelerate at a CAGR of 9.6%. The market revenue is likely to be valued at US$ 1.2 billion in 2023 and exhibit a revenue growth of US$ 3 billion by 2033.
Global Trends & Scopes Transforming the Human Identification Market
Key players provide simplified, end-to-end forensic DNA analysis workflows to assist end users in resolving challenging cases and providing investigative leads in a forensically responsible way. They are dedicated to providing unrivaled service and ongoing innovation to suit the demands of today and tomorrow, which is a factor that is allowing steady growth for the market.
The amount and quality of genomic DNA extracted and purified from a forensic sample are closely connected to downstream analytical success. The Precision ID NGS System for HID can assist end users in solving difficult problems by extracting additional information from difficult samples.
The quick deployment of a new, cutting-edge forensic science services facility is helping them to meet their aim of providing forensic DNA testing in their community sooner. The aid of Life Technologies application professionals was critical in speeding up the procedure and improving validation quality assurance, allowing them to begin processing DNA evidence. This development is expected to accelerate market growth.
Certain important players' next-generation sequencing (NGS) technology and informatics give significantly more information from forensic DNA than traditional PCR and capillary electrophoresis (CE) procedures, with far greater resolution than was previously achievable. With the targeted strength of NGS-based forensic genomics methodologies, key companies claim that their customers may obtain the answers they need more swiftly and with higher confidence, thus giving a boost to the market.
The three-step human whole-genome sequencing method offers labs a fully featured, quick solution. The resultant WGS provides high-quality insights for all variation classes throughout the whole genome. Human identification and forensics labs are always under pressure to boost the efficiency of their operations without losing quality due to increased demands on time and resources. The increase in demand is expected to boost the market.
Certain reputable significant businesses have been trusted partners and solution suppliers for forensics laboratories globally for over 20 years. They have created a comprehensive set of solutions that give end customers the speed, precision, and dependability they want, whether they work in a small lab or a high-throughput facility. Their cutting-edge solutions and services may help end users at every stage of the human identification process. With the already existing provisions by key players and the progress in terms of human identification, the market is expected to grow further.
Through their Investigator Community initiatives, they hope to advance the discipline of forensics by assisting forensic scientists at all stages of their careers. FISH is an effective method for detecting various chromosomal abnormalities. AneuVysion, the only FDA-cleared tool for the fast detection of anatomy in amniotic fluid samples, is only one of the DNA FISH probes available for preimplantation, prenatal, and postnatal genetic testing studies.
A reliable STR profile is necessary while preparing to testify in court. Key companies provide a diverse line of multiplex PCR kits for human identity and paternity testing, allowing end users to have confidence in their evidence. With high levels of sensitivity and durability, these STR kits provide the most complete and adaptable coverage of current international STR standards for both casework and reference materials.
Key companies offer comprehensive, integrated, and efficient workflows for all types of human identification (human ID) and forensic testing. End users can begin with their new sample collection portfolio and then speed up their process with a variety of automated sample purifying options.
Attributes |
Details |
Human Identification Market HCAGR (2017 to 2022) |
12.5% |
Human Identification Market CAGR (2023 to 2033) |
9.6% |
Market Size for Human Identification (2023) |
US$ 1.2 billion |
Market Size for Human Identification (2033) |
US$ 3 billion |
Let us know your requirement to get
100% FREE customization
A Contrast with the Historical Market Scenario
According to a Future Market Insights study, the global forum of human identification has shown exceptional growth in recent years. The market's significant players are working together to address the growing demand for human identification. The CAGR was 12.5% from 2017 to 2022, and it is expected to climb to 9.6% over the projected period.
Comparative Analysis of Adjacent Markets
Human Identification Market:
Attributes |
Human Identification Market |
CAGR (2023 to 2033) |
9.6% |
Market Value (2033) |
US$ 3 billion |
Growth Factor |
Modern technological advancements are opening up new avenues for conducting rigorous scientific investigations and measurements to improve the efficacy and speed of the criminal justice system. |
Opportunity |
Rapid DNA analysis has enormous development potential since human identification systems are widely used in the investigation of missing persons. |
Restraints |
The high cost of genetic equipment may impede the rate of growth of the human identification industry. |
Identity Verification Market:
Attributes |
Identity Verification Market |
CAGR (2023 to 2033) |
14.8% |
Market Value (2033) |
US$ 46 billion |
Growth Factor |
The expanding amount of internet procedures such as financial transactions and online onboarding activities has boosted the global market's need for business identity verification. |
Opportunity |
The widespread usage of electronic ID cards (eID) and attendance verification devices has resulted in high demand for offline ID verification services. |
Restraints |
Digital literacy is particularly poor in low-income economies, making it difficult for top ID verification businesses to enter the market. |
3D Bioprinted Human Tissue Market:
Attributes |
3D Bioprinted Human Tissue Market |
CAGR (2023 to 2033) |
8.3% |
Market Value (2033) |
US$ 12.7 billion |
Growth Factor |
Tissue engineering demand is predicted to increase as the focus shifts from stem cell treatment to immune cellular therapies. |
Opportunity |
Companies are always spending on research and development in order to stay up with changing customer tastes and end-use industry demands. |
Restraints |
Without a healthy vascular network, 3D bioprinted human tissues would not get enough nutrition, exchange gases, or dispose of waste effectively. |
Find your sweet spots for generating winning opportunities in this market.
Talk to AnalystRegion-Wise Overview
Country | United States of America |
CAGR (2023 to 2033) | 9.4% |
HCAGR (2017 to 2022) | 12.1% |
Country | United Kingdom |
CAGR (2023 to 2033) | 8.7% |
HCAGR (2017 to 2022) | 11.1% |
Country | China |
CAGR (2023 to 2033) | 9% |
HCAGR (2017 to 2022) | 11.7% |
Country | Japan |
CAGR (2023 to 2033) | 8.1% |
HCAGR (2017 to 2022) | 10.6% |
Country | South Korea |
CAGR (2023 to 2033) | 7.3% |
HCAGR (2017 to 2022) | 9.2% |
AI-powered Biometric Recognition Service - the USA leads in Modern Human Identification Solutions!
Attributes |
Details |
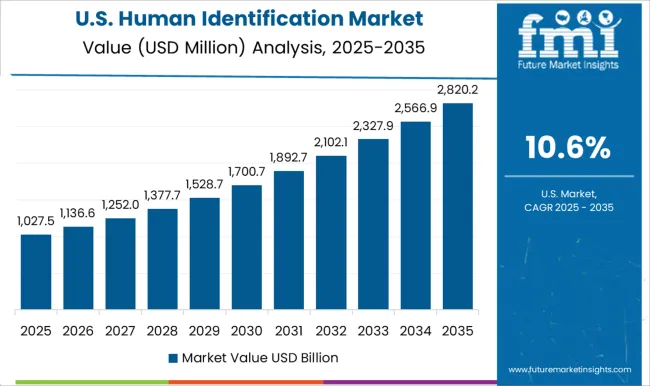
United States Market Size (2033) |
US$ 1.1 billion |
United States Market Absolute Dollar Growth (US$ million/billion) |
US$ 629.3 million |
North America currently holds the largest share of the human identification market, particularly in the USA, which holds a revenue share of 9.4%. The value of the human identification market in the USA is estimated to reach a high of US$ 1.1 billion. This is attributed to the financial backing by the government for forensic research. The USA is the most important market for human identification, and the country's expanding DNA database is another element driving market expansion.
Community members, law enforcement agencies, and workers receive hands-on training from key providers, which includes public lectures, demonstrations of field recovery procedures, and workshops. Their staff includes qualified teachers for California's Peace Officer Standards and Training (POST) Homicide Courses. Moreover, it includes a range of stand-alone training in excavation procedures, human remains recovery, search and rescue, and bone identification.
Key players supply fraud prevention solutions by safeguarding the systems of end users. This enables client ID verification through the use of an AI-powered biometric recognition service. With the assistance of their staff, consumers may secure high-quality identity verification. Key players are capable of adhering to rules and directives that impact the end user's company. Furthermore, the criteria for Know Your Customer (KYC) and Anti-Money Laundering (AML) are satisfied. These useful features are expected to drive market growth.
Few biometric technologies arouse as much interest as face recognition. Forensic anthropological services are provided by key players to state and federal law enforcement, medical examiners, and attorneys. They help the court system handle criminal and missing person situations, giving families closure. The findings of sponsored testing at the Maryland Test Facility were disclosed by the US Homeland Security Science and Technology Directorate at the end of May 2018. (MdTF). These real-world experiments assessed the performance of 12 facial recognition systems in a 2 m by 2.5 m hallway.
Specialized Teams of Former Forensic DNA Practitioners in the UK are Involved in the Development of Human Identification Products
Attributes |
Details |
UK Market Size (2033) |
US$ 126.3 million |
UK Market Absolute Dollar Growth (US$ million/billion) |
US$ 71.2 million |
With a high-paced revenue growth rate of 8.7% and a projected value of US$ 126.3 million over the projection period, the United Kingdom offers enormous market potential. To maintain current market rivalry, enterprises run by market goliaths routinely update their product catalogs with new and application-specific items. Moreover, experts in the country specialize in the identification and interpretation of charred and extremely fragmented remains, as well as disaster victim identification (DVI).
Capillary electrophoresis (CE) and massively parallel sequencing (MPS) are two typical procedures used for human identification in forensic and paternity testing facilities in the United Kingdom. DNA is collected from a range of materials in both methods, and certain portions of the DNA are evaluated to create a unique genetic fingerprint for each person. Key providers supply reagents, instruments, services, and support for capillary electrophoresis and massively parallel sequencing techniques for DNA extraction, quantification, STR amplification, and analysis.
Human identification products are offered by key providers through specialized teams of former forensic DNA practitioners. They provide laboratories with application training, validation of DNA analysis methodologies, and setup and maintenance of workflow automation equipment. On a local and global scale, forensic archaeologists and anthropologists aid both civilian and military police officers with the finding, retrieval, and identification of human remains from crime scenes, conflict zones, and mass mortality situations.
Human Identification Research Facilities in South Korea Promote the Identification of Live & Deceased Corpses
Attributes |
Details |
South Korea Market Size (2033) |
US$ 103.5 million |
South Korea Market Absolute Dollar Growth (US$ million/billion) |
US$ 52.4 million |
Asia Pacific has a substantial human identification market, particularly in Japan and South Korea. This is owing to the increasing knowledge of forensic technology in this region. Many economies are investing heavily in the human identification sector. Furthermore, the surge in criminal activity in nations like China, Japan, and South Korea has prompted governments to take steps to enhance their technology, which is contributing to market growth.
South Korea accounts for 7.3% of the overall demand in the human identification market. South Korea's human identification industry is predicted to reach a peak of US$ 103.5 million. The government has a human identification research facility in place to collect human identification technologies that can differentiate between the identities of live and deceased corpses, as well as the data of Korean characters required for it.
These centers also exist to build a bank of human identity data based on quality control and standardization of these data and technologies, as well as to contribute to the resolution of local or global societal concerns involving human identification. The government has announced the design and execution of a new array, the Korea Biobank Array (also known as KoreanChip). With such initiatives, the market is expected to surge in the region.
KoreanChip has been customized for the Korean population and is likely to display findings from GWAS of blood biochemical characteristics. KoreanChip had over 833,000 markers, including over 247,000 rare-frequency or functional variations estimated from over 2,500 Korean sequencing data sets.
In Japan, the Biometric Authentication is Used to Enhance the Consumer Payment System!
Attributes |
Details |
Japan Market Size (2033) |
US$ 176 million |
Japan Market Absolute Dollar Growth (US$ million/billion) |
US$ 95.1 million |
Japan is a very profitable human identification market, with a revenue growth rate of 8.1% and a projected value of US$ 176 million throughout the forecast period. The Publication of Human Genetics is the official journal of the Japan Society of Human Genetics, publishing high-quality original research papers, brief communications, reviews, correspondences, and editorials on all aspects of human genetics and genomics. It is the main genetics journal in the Asia-Pacific market.
Japanese key players have a global research team that includes social, political, cognitive, personality, and cross-cultural psychologists. They are focusing on issues of identification with all humanity, as well as its psychological roots and societal ramifications. Their objectives include implementing research findings to improve international collaboration in tackling global challenges, peacebuilding, and human rights oriented.
Newbies are Catching Up with Key Players with Innovative Strategies: Start-up Economy
Start-up companies are contributing to the global human identification market growth, with the help of advanced technologies such as AI:
- Human - It offers emotional intelligence technology powered by AI. Its engine analyzes human facial expressions and movements in order to gain a deeper understanding of sentiments, emotions, attributes, and personalities. Based on its analysis, it assigns ratings to characteristics of behavior such as honesty, confidence, interest, passion, anxiousness, and so on. It may be used in recruiting, employee retention, financial fraud detection, customer experience analysis, security, sales forecasting, law enforcement, and other areas.
- Digital Identity - The company delivers blockchain-enabled digital identification solutions for a variety of industries. It includes EidOo, a blockchain-to-human interface that allows the blockchain and its users to communicate and interact. It offers TwinWallet, an open-source and app-based Bitcoin wallet program, for user identification. The app is accessible for both iOS and Android smartphones.
- FHID - It is a forensic human identification service provider. The company offers a technique called paragon snapshot DNA phenotyping, which assists in the identification of human remains at crime scenes. They examine the retrieved case-relevant genotypic data.
- Skeleton - It provides law enforcement with an AI-based forensic person identification program. AM/PM databases, virtual labs, statistics, reports, case files, access management tools, and skull-face overlay tools are among the services it provides. It also provides editing software, visualization software, 3D models, and scanners. It serves the law enforcement, government, and police sectors.

A unified Market Research Subscription Platform, built for today's disparate research needs.
Top Companies Revamping the Human Identification Market Space
Owing to the presence of multiple established competitors, the human identification market share is very competitive. To capitalize on market growth prospects, these firms are concentrating on strengthening their footprint through acquisitions, expansions, product approvals, and launches.
Latest Developments:
- In January 2022, a research team led by Stanford University set the first Guinness World Record for the quickest DNA sequencing technology, which was utilized to sequence the human genome in 5 hours and 2 minutes.
- In June 2021, Precision ID GlobalFiler NGS STR Panel v2 for forensic DNA analysis has been released by Thermo Fisher Scientific. The capability of the Applied Biosystems Precision ID GlobalFiler NGS STR Panel v2 is combined with that of the Converge Software 2.0 solution in this next-generation sequencing STR panel.
- In 2021, QIAGEN introduced the EZ2 Connect Instrument Line, which may accelerate the advancement of biological research, forensics, and clinical diagnostics.
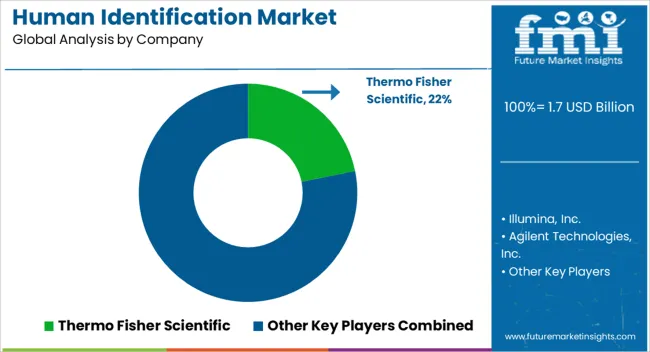
KEY MARKET PLAYERS IN THE HUMAN IDENTIFICATION MARKET
- Thermo Fisher Scientific Inc.
- Illumina Inc.
- Agilent Technologies Inc.
- QIAGEN
- Bio-Rad Laboratories Inc.
- Hamilton Company
- Ande Corporation
- Abbott Laboratories
- GE Healthcare
- Eurofins Scientific
- Laboratory Corporation of America Holdings
Key Segments Profiled in the Human Identification Market Survey
By Product Type:
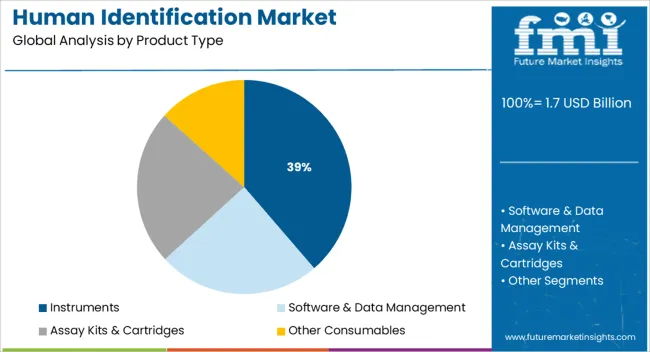
- Instruments
- Software & Data Management
- Assay Kits & Cartridges
- Other Consumables
By Technology:
- Polymerase Chain Reaction (PCR)
- Short Tandem Repeats (STR)
- Microarray Technology
- Capillary Electrophoresis
- Next Generation Sequencing (NGS)
- Nucleic Acid Extraction & Purification
- Rapid DNA Analysis
By Application:
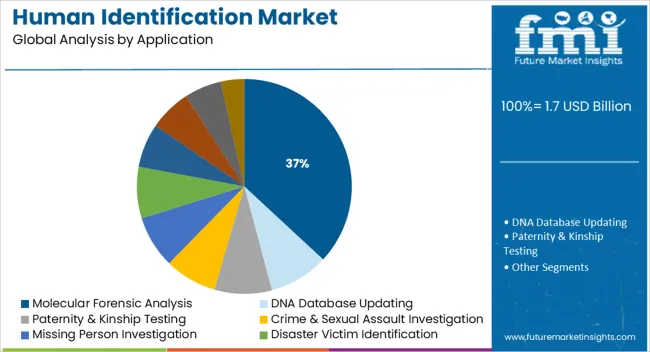
- Molecular Forensic Analysis
- DNA Database Updating
- Paternity & Kinship Testing
- Crime & Sexual Assault Investigation
- Missing Person Investigation
- Disaster Victim Identification
- Anthropology Studies
- Cell Line Identification
- Population-based Studies
- Genetic-based Studies
By End User:
- Forensic Laboratories
- Law Enforcement Agencies
- Academic & Research Labs
- Pharmaceutical & Biotech Companies
- Contract Research Organizations
- Others
By Region:
- North America
- Latin America
- Asia Pacific
- The Middle East and Africa
- Europe
Frequently Asked Questions
What is the Demand Analysis for Human Identification?
Demand for human identification is estimated to expand at a CAGR of 9.6%, through 2033.
What is a Lucrative Opportunity of the Human Identification Market?
In the next years, emerging markets are anticipated to give significant growth opportunities for market players.
What is the Adoption Potential of Human Identification?
The adoption potential of human identification is likely to reach a valuation of US$ 1.2 billion in 2023.
Table of Content
1. Executive Summary | Human Identification Market 1.1. Global Market Outlook 1.2. Demand-side Trends 1.3. Supply-side Trends 1.4. Technology Roadmap Analysis 1.5. Analysis and Recommendations 2. Market Overview 2.1. Market Coverage / Taxonomy 2.2. Market Definition / Scope / Limitations 3. Market Background 3.1. Market Dynamics 3.1.1. Drivers 3.1.2. Restraints 3.1.3. Opportunity 3.1.4. Trends 3.2. Scenario Forecast 3.2.1. Demand in Optimistic Scenario 3.2.2. Demand in Likely Scenario 3.2.3. Demand in Conservative Scenario 3.3. Opportunity Map Analysis 3.4. Investment Feasibility Matrix 3.5. PESTLE and Porter’s Analysis 3.6. Regulatory Landscape 3.6.1. By Key Regions 3.6.2. By Key Countries 3.7. Regional Parent Market Outlook 4. Global Market Analysis 2017 to 2022 and Forecast, 2023 to 2033 4.1. Historical Market Size Value (US$ million) Analysis, 2017 to 2022 4.2. Current and Future Market Size Value (US$ million) Projections, 2023 to 2033 4.2.1. Y-o-Y Growth Trend Analysis 4.2.2. Absolute $ Opportunity Analysis 5. Global Market Analysis 2017 to 2022 and Forecast 2023 to 2033, By Product 5.1. Introduction / Key Findings 5.2. Historical Market Size Value (US$ million) Analysis By Product, 2017 to 2022 5.3. Current and Future Market Size Value (US$ million) Analysis and Forecast By Product, 2023 to 2033 5.3.1. Instruments 5.3.1.1. DNA Collection Systems 5.3.1.2. Electrophoresis Systems 5.3.1.3. Thermal Cyclers 5.3.1.4. Rapid DNA Analysis Systems 5.3.1.5. NGS Platforms 5.3.1.6. Microarray Scanners 5.3.1.7. Others 5.3.2. Software & Data Management 5.3.2.1. Analytical Software 5.3.2.2. Data Interpretation 5.3.2.3. Data Storage 5.3.3. Assay Kits & Cartridges 5.3.3.1. DNA Sample Preparation & Extraction Kits 5.3.3.2. DNA Amplification Kits 5.3.3.3. DNA Quantification Kits 5.3.3.4. Rapid DNA Analysis Cartridges 5.3.4. Other Consumables 5.4. Y-o-Y Growth Trend Analysis By Product, 2017 to 2022 5.5. Absolute $ Opportunity Analysis By Product, 2023 to 2033 6. Global Market Analysis 2017 to 2022 and Forecast 2023 to 2033, By Technology 6.1. Introduction / Key Findings 6.2. Historical Market Size Value (US$ million) Analysis By Technology, 2017 to 2022 6.3. Current and Future Market Size Value (US$ million) Analysis and Forecast By Technology, 2023 to 2033 6.3.1. Polymerase Chain Reaction 6.3.2. Short Tandem Repeats 6.3.3. Microarray Technology 6.3.4. Capillary Electrophoresis 6.3.5. Next-Generation Sequencing 6.3.6. Nucleic Acid Extraction and Purification 6.3.7. Rapid DNA Analysis 6.4. Y-o-Y Growth Trend Analysis By Technology, 2017 to 2022 6.5. Absolute $ Opportunity Analysis By Technology, 2023 to 2033 7. Global Market Analysis 2017 to 2022 and Forecast 2023 to 2033, By Application 7.1. Introduction / Key Findings 7.2. Historical Market Size Value (US$ million) Analysis By Application, 2017 to 2022 7.3. Current and Future Market Size Value (US$ million) Analysis and Forecast By Application, 2023 to 2033 7.3.1. Molecular Forensic Analysis 7.3.2. DNA Database Updating 7.3.3. Paternity & Kinship Testing 7.3.4. Crime and Sexual Assault Investigation 7.3.5. Missing Person Investigation 7.3.6. Disaster Victim Identification 7.3.7. Anthropology Studies 7.3.8. Cell Line Identification 7.3.9. Population-based Studies 7.3.10. Genetic-based Studies 7.4. Y-o-Y Growth Trend Analysis By Application, 2017 to 2022 7.5. Absolute $ Opportunity Analysis By Application, 2023 to 2033 8. Global Market Analysis 2017 to 2022 and Forecast 2023 to 2033, By End User 8.1. Introduction / Key Findings 8.2. Historical Market Size Value (US$ million) Analysis By End User, 2017 to 2022 8.3. Current and Future Market Size Value (US$ million) Analysis and Forecast By End User, 2023 to 2033 8.3.1. Forensic Laboratories 8.3.2. Law Enforcement Agencies 8.3.3. Academic and Research Labs 8.3.4. Pharmaceutical and Biotech Companies 8.3.5. Contract Research Organizations 8.3.6. Others 8.4. Y-o-Y Growth Trend Analysis By End User, 2017 to 2022 8.5. Absolute $ Opportunity Analysis By End User, 2023 to 2033 9. Global Market Analysis 2017 to 2022 and Forecast 2023 to 2033, By Region 9.1. Introduction 9.2. Historical Market Size Value (US$ million) Analysis By Region, 2017 to 2022 9.3. Current Market Size Value (US$ million) Analysis and Forecast By Region, 2023 to 2033 9.3.1. North America 9.3.2. Latin America 9.3.3. Europe 9.3.4. East Asia 9.3.5. South Asia & Pacific 9.3.6. Middle East and Africa (MEA) 9.4. Market Attractiveness Analysis By Region 10. North America Market Analysis 2017 to 2022 and Forecast 2023 to 2033, By Country 10.1. Historical Market Size Value (US$ million) Trend Analysis By Market Taxonomy, 2017 to 2022 10.2. Market Size Value (US$ million) Forecast By Market Taxonomy, 2023 to 2033 10.2.1. By Country 10.2.1.1. United States of America 10.2.1.2. Canada 10.2.2. By Product 10.2.3. By Technology 10.2.4. By Application 10.2.5. By End User 10.3. Market Attractiveness Analysis 10.3.1. By Country 10.3.2. By Product 10.3.3. By Technology 10.3.4. By Application 10.3.5. By End User 10.4. Key Takeaways 11. Latin America Market Analysis 2017 to 2022 and Forecast 2023 to 2033, By Country 11.1. Historical Market Size Value (US$ million) Trend Analysis By Market Taxonomy, 2017 to 2022 11.2. Market Size Value (US$ million) Forecast By Market Taxonomy, 2023 to 2033 11.2.1. By Country 11.2.1.1. Brazil 11.2.1.2. Mexico 11.2.1.3. Rest of Latin America 11.2.2. By Product 11.2.3. By Technology 11.2.4. By Application 11.2.5. By End User 11.3. Market Attractiveness Analysis 11.3.1. By Country 11.3.2. By Product 11.3.3. By Technology 11.3.4. By Application 11.3.5. By End User 11.4. Key Takeaways 12. Europe Market Analysis 2017 to 2022 and Forecast 2023 to 2033, By Country 12.1. Historical Market Size Value (US$ million) Trend Analysis By Market Taxonomy, 2017 to 2022 12.2. Market Size Value (US$ million) Forecast By Market Taxonomy, 2023 to 2033 12.2.1. By Country 12.2.1.1. Germany 12.2.1.2. United Kingdom 12.2.1.3. Spain 12.2.1.4. Italy 12.2.1.5. Nordic Countries 12.2.1.6. BENELUX 12.2.1.7. Rest of Europe 12.2.2. By Product 12.2.3. By Technology 12.2.4. By Application 12.2.5. By End User 12.3. Market Attractiveness Analysis 12.3.1. By Country 12.3.2. By Product 12.3.3. By Technology 12.3.4. By Application 12.3.5. By End User 12.4. Key Takeaways 13. East Asia Market Analysis 2017 to 2022 and Forecast 2023 to 2033, By Country 13.1. Historical Market Size Value (US$ million) Trend Analysis By Market Taxonomy, 2017 to 2022 13.2. Market Size Value (US$ million) Forecast By Market Taxonomy, 2023 to 2033 13.2.1. By Country 13.2.1.1. China 13.2.1.2. Japan 13.2.1.3. South Korea 13.2.2. By Product 13.2.3. By Technology 13.2.4. By Application 13.2.5. By End User 13.3. Market Attractiveness Analysis 13.3.1. By Country 13.3.2. By Product 13.3.3. By Technology 13.3.4. By Application 13.3.5. By End User 13.4. Key Takeaways 14. South Asia & Pacific Market Analysis 2017 to 2022 and Forecast 2023 to 2033, By Country 14.1. Historical Market Size Value (US$ million) Trend Analysis By Market Taxonomy, 2017 to 2022 14.2. Market Size Value (US$ million) Forecast By Market Taxonomy, 2023 to 2033 14.2.1. By Country 14.2.1.1. India 14.2.1.2. Australia and New Zealand (AnZ) 14.2.1.3. Malaysia 14.2.1.4. Thailand 14.2.1.5. Rest of South Asia & Pacific 14.2.2. By Product 14.2.3. By Technology 14.2.4. By Application 14.2.5. By End User 14.3. Market Attractiveness Analysis 14.3.1. By Country 14.3.2. By Product 14.3.3. By Technology 14.3.4. By Application 14.3.5. By End User 14.4. Key Takeaways 15. MEA Market Analysis 2017 to 2022 and Forecast 2023 to 2033, By Country 15.1. Historical Market Size Value (US$ million) Trend Analysis By Market Taxonomy, 2017 to 2022 15.2. Market Size Value (US$ million) Forecast By Market Taxonomy, 2023 to 2033 15.2.1. By Country 15.2.1.1. GCC Countries 15.2.1.2. South Africa 15.2.1.3. Rest of MEA 15.2.2. By Product 15.2.3. By Technology 15.2.4. By Application 15.2.5. By End User 15.3. Market Attractiveness Analysis 15.3.1. By Country 15.3.2. By Product 15.3.3. By Technology 15.3.4. By Application 15.3.5. By End User 15.4. Key Takeaways 16. Key Countries Market Analysis 16.1. United States of America 16.1.1. Pricing Analysis 16.1.2. Market Share Analysis, 2022 16.1.2.1. By Product 16.1.2.2. By Technology 16.1.2.3. By Application 16.1.2.4. By End User 16.2. Canada 16.2.1. Pricing Analysis 16.2.2. Market Share Analysis, 2022 16.2.2.1. By Product 16.2.2.2. By Technology 16.2.2.3. By Application 16.2.2.4. By End User 16.3. Brazil 16.3.1. Pricing Analysis 16.3.2. Market Share Analysis, 2022 16.3.2.1. By Product 16.3.2.2. By Technology 16.3.2.3. By Application 16.3.2.4. By End User 16.4. Mexico 16.4.1. Pricing Analysis 16.4.2. Market Share Analysis, 2022 16.4.2.1. By Product 16.4.2.2. By Technology 16.4.2.3. By Application 16.4.2.4. By End User 16.5. Germany 16.5.1. Pricing Analysis 16.5.2. Market Share Analysis, 2022 16.5.2.1. By Product 16.5.2.2. By Technology 16.5.2.3. By Application 16.5.2.4. By End User 16.6. United Kingdom 16.6.1. Pricing Analysis 16.6.2. Market Share Analysis, 2022 16.6.2.1. By Product 16.6.2.2. By Technology 16.6.2.3. By Application 16.6.2.4. By End User 16.7. Spain 16.7.1. Pricing Analysis 16.7.2. Market Share Analysis, 2022 16.7.2.1. By Product 16.7.2.2. By Technology 16.7.2.3. By Application 16.7.2.4. By End User 16.8. Italy 16.8.1. Pricing Analysis 16.8.2. Market Share Analysis, 2022 16.8.2.1. By Product 16.8.2.2. By Technology 16.8.2.3. By Application 16.8.2.4. By End User 16.9. Nordic Countries 16.9.1. Pricing Analysis 16.9.2. Market Share Analysis, 2022 16.9.2.1. By Product 16.9.2.2. By Technology 16.9.2.3. By Application 16.9.2.4. By End User 16.10. BENELUX 16.10.1. Pricing Analysis 16.10.2. Market Share Analysis, 2022 16.10.2.1. By Product 16.10.2.2. By Technology 16.10.2.3. By Application 16.10.2.4. By End User 16.11. China 16.11.1. Pricing Analysis 16.11.2. Market Share Analysis, 2022 16.11.2.1. By Product 16.11.2.2. By Technology 16.11.2.3. By Application 16.11.2.4. By End User 16.12. Japan 16.12.1. Pricing Analysis 16.12.2. Market Share Analysis, 2022 16.12.2.1. By Product 16.12.2.2. By Technology 16.12.2.3. By Application 16.12.2.4. By End User 16.13. South Korea 16.13.1. Pricing Analysis 16.13.2. Market Share Analysis, 2022 16.13.2.1. By Product 16.13.2.2. By Technology 16.13.2.3. By Application 16.13.2.4. By End User 16.14. India 16.14.1. Pricing Analysis 16.14.2. Market Share Analysis, 2022 16.14.2.1. By Product 16.14.2.2. By Technology 16.14.2.3. By Application 16.14.2.4. By End User 16.15. Australia and New Zealand (AnZ) 16.15.1. Pricing Analysis 16.15.2. Market Share Analysis, 2022 16.15.2.1. By Product 16.15.2.2. By Technology 16.15.2.3. By Application 16.15.2.4. By End User 16.16. Malaysia 16.16.1. Pricing Analysis 16.16.2. Market Share Analysis, 2022 16.16.2.1. By Product 16.16.2.2. By Technology 16.16.2.3. By Application 16.16.2.4. By End User 16.17. Thailand 16.17.1. Pricing Analysis 16.17.2. Market Share Analysis, 2022 16.17.2.1. By Product 16.17.2.2. By Technology 16.17.2.3. By Application 16.17.2.4. By End User 16.18. GCC Countries 16.18.1. Pricing Analysis 16.18.2. Market Share Analysis, 2022 16.18.2.1. By Product 16.18.2.2. By Technology 16.18.2.3. By Application 16.18.2.4. By End User 16.19. South Africa 16.19.1. Pricing Analysis 16.19.2. Market Share Analysis, 2022 16.19.2.1. By Product 16.19.2.2. By Technology 16.19.2.3. By Application 16.19.2.4. By End User 17. Market Structure Analysis 17.1. Competition Dashboard 17.2. Competition Benchmarking 17.3. Market Share Analysis of Top Players 17.3.1. By Regional 17.3.2. By Product 17.3.3. By Technology 17.3.4. By Application 17.3.5. By End User 18. Competition Analysis 18.1. Competition Deep Dive 18.1.1. Thermo Fisher Scientific 18.1.1.1. Overview 18.1.1.2. Product Portfolio 18.1.1.3. Profitability by Market Segments 18.1.1.4. Sales Footprint 18.1.1.5. Strategy Overview 18.1.1.5.1. Marketing Strategy 18.1.2. Illumina, Inc. 18.1.2.1. Overview 18.1.2.2. Product Portfolio 18.1.2.3. Profitability by Market Segments 18.1.2.4. Sales Footprint 18.1.2.5. Strategy Overview 18.1.2.5.1. Marketing Strategy 18.1.3. Agilent Technologies, Inc. 18.1.3.1. Overview 18.1.3.2. Product Portfolio 18.1.3.3. Profitability by Market Segments 18.1.3.4. Sales Footprint 18.1.3.5. Strategy Overview 18.1.3.5.1. Marketing Strategy 18.1.4. QIAGEN 18.1.4.1. Overview 18.1.4.2. Product Portfolio 18.1.4.3. Profitability by Market Segments 18.1.4.4. Sales Footprint 18.1.4.5. Strategy Overview 18.1.4.5.1. Marketing Strategy 18.1.5. Bio-Rad Laboratories, Inc. 18.1.5.1. Overview 18.1.5.2. Product Portfolio 18.1.5.3. Profitability by Market Segments 18.1.5.4. Sales Footprint 18.1.5.5. Strategy Overview 18.1.5.5.1. Marketing Strategy 18.1.6. Hamilton Company 18.1.6.1. Overview 18.1.6.2. Product Portfolio 18.1.6.3. Profitability by Market Segments 18.1.6.4. Sales Footprint 18.1.6.5. Strategy Overview 18.1.6.5.1. Marketing Strategy 18.1.7. Ande Corporation 18.1.7.1. Overview 18.1.7.2. Product Portfolio 18.1.7.3. Profitability by Market Segments 18.1.7.4. Sales Footprint 18.1.7.5. Strategy Overview 18.1.7.5.1. Marketing Strategy 18.1.8. Abbott Laboratories 18.1.8.1. Overview 18.1.8.2. Product Portfolio 18.1.8.3. Profitability by Market Segments 18.1.8.4. Sales Footprint 18.1.8.5. Strategy Overview 18.1.8.5.1. Marketing Strategy 18.1.9. GE Healthcare 18.1.9.1. Overview 18.1.9.2. Product Portfolio 18.1.9.3. Profitability by Market Segments 18.1.9.4. Sales Footprint 18.1.9.5. Strategy Overview 18.1.9.5.1. Marketing Strategy 18.1.10. Thermo Fisher Scientific Inc. 18.1.10.1. Overview 18.1.10.2. Product Portfolio 18.1.10.3. Profitability by Market Segments 18.1.10.4. Sales Footprint 18.1.10.5. Strategy Overview 18.1.10.5.1. Marketing Strategy 18.1.11. Eurofins Scientific 18.1.11.1. Overview 18.1.11.2. Product Portfolio 18.1.11.3. Profitability by Market Segments 18.1.11.4. Sales Footprint 18.1.11.5. Strategy Overview 18.1.11.5.1. Marketing Strategy 18.1.12. Laboratory Corporation of America Holdings 18.1.12.1. Overview 18.1.12.2. Product Portfolio 18.1.12.3. Profitability by Market Segments 18.1.12.4. Sales Footprint 18.1.12.5. Strategy Overview 18.1.12.5.1. Marketing Strategy 19. Assumptions & Acronyms Used 20. Research Methodology
Let us know your requirement to get
100% FREE customization
List of Tables
Table 1: Global Market Value (US$ million) Forecast by Region, 2017 to 2033 Table 2: Global Market Value (US$ million) Forecast by Product, 2017 to 2033 Table 3: Global Market Value (US$ million) Forecast by Technology, 2017 to 2033 Table 4: Global Market Value (US$ million) Forecast by Application, 2017 to 2033 Table 5: Global Market Value (US$ million) Forecast by End User, 2017 to 2033 Table 6: North America Market Value (US$ million) Forecast by Country, 2017 to 2033 Table 7: North America Market Value (US$ million) Forecast by Product, 2017 to 2033 Table 8: North America Market Value (US$ million) Forecast by Technology, 2017 to 2033 Table 9: North America Market Value (US$ million) Forecast by Application, 2017 to 2033 Table 10: North America Market Value (US$ million) Forecast by End User, 2017 to 2033 Table 11: Latin America Market Value (US$ million) Forecast by Country, 2017 to 2033 Table 12: Latin America Market Value (US$ million) Forecast by Product, 2017 to 2033 Table 13: Latin America Market Value (US$ million) Forecast by Technology, 2017 to 2033 Table 14: Latin America Market Value (US$ million) Forecast by Application, 2017 to 2033 Table 15: Latin America Market Value (US$ million) Forecast by End User, 2017 to 2033 Table 16: Europe Market Value (US$ million) Forecast by Country, 2017 to 2033 Table 17: Europe Market Value (US$ million) Forecast by Product, 2017 to 2033 Table 18: Europe Market Value (US$ million) Forecast by Technology, 2017 to 2033 Table 19: Europe Market Value (US$ million) Forecast by Application, 2017 to 2033 Table 20: Europe Market Value (US$ million) Forecast by End User, 2017 to 2033 Table 21: East Asia Market Value (US$ million) Forecast by Country, 2017 to 2033 Table 22: East Asia Market Value (US$ million) Forecast by Product, 2017 to 2033 Table 23: East Asia Market Value (US$ million) Forecast by Technology, 2017 to 2033 Table 24: East Asia Market Value (US$ million) Forecast by Application, 2017 to 2033 Table 25: East Asia Market Value (US$ million) Forecast by End User, 2017 to 2033 Table 26: South Asia & Pacific Market Value (US$ million) Forecast by Country, 2017 to 2033 Table 27: South Asia & Pacific Market Value (US$ million) Forecast by Product, 2017 to 2033 Table 28: South Asia & Pacific Market Value (US$ million) Forecast by Technology, 2017 to 2033 Table 29: South Asia & Pacific Market Value (US$ million) Forecast by Application, 2017 to 2033 Table 30: South Asia & Pacific Market Value (US$ million) Forecast by End User, 2017 to 2033 Table 31: MEA Market Value (US$ million) Forecast by Country, 2017 to 2033 Table 32: MEA Market Value (US$ million) Forecast by Product, 2017 to 2033 Table 33: MEA Market Value (US$ million) Forecast by Technology, 2017 to 2033 Table 34: MEA Market Value (US$ million) Forecast by Application, 2017 to 2033 Table 35: MEA Market Value (US$ million) Forecast by End User, 2017 to 2033
Find your sweet spots for generating winning opportunities in this market.
Talk to AnalystList of Charts
Figure 1: Global Market Value (US$ million) by Product, 2023 to 2033 Figure 2: Global Market Value (US$ million) by Technology, 2023 to 2033 Figure 3: Global Market Value (US$ million) by Application, 2023 to 2033 Figure 4: Global Market Value (US$ million) by End User, 2023 to 2033 Figure 5: Global Market Value (US$ million) by Region, 2023 to 2033 Figure 6: Global Market Value (US$ million) Analysis by Region, 2017 to 2033 Figure 7: Global Market Value Share (%) and BPS Analysis by Region, 2023 to 2033 Figure 8: Global Market Y-o-Y Growth (%) Projections by Region, 2023 to 2033 Figure 9: Global Market Value (US$ million) Analysis by Product, 2017 to 2033 Figure 10: Global Market Value Share (%) and BPS Analysis by Product, 2023 to 2033 Figure 11: Global Market Y-o-Y Growth (%) Projections by Product, 2023 to 2033 Figure 12: Global Market Value (US$ million) Analysis by Technology, 2017 to 2033 Figure 13: Global Market Value Share (%) and BPS Analysis by Technology, 2023 to 2033 Figure 14: Global Market Y-o-Y Growth (%) Projections by Technology, 2023 to 2033 Figure 15: Global Market Value (US$ million) Analysis by Application, 2017 to 2033 Figure 16: Global Market Value Share (%) and BPS Analysis by Application, 2023 to 2033 Figure 17: Global Market Y-o-Y Growth (%) Projections by Application, 2023 to 2033 Figure 18: Global Market Value (US$ million) Analysis by End User, 2017 to 2033 Figure 19: Global Market Value Share (%) and BPS Analysis by End User, 2023 to 2033 Figure 20: Global Market Y-o-Y Growth (%) Projections by End User, 2023 to 2033 Figure 21: Global Market Attractiveness by Product, 2023 to 2033 Figure 22: Global Market Attractiveness by Technology, 2023 to 2033 Figure 23: Global Market Attractiveness by Application, 2023 to 2033 Figure 24: Global Market Attractiveness by End User, 2023 to 2033 Figure 25: Global Market Attractiveness by Region, 2023 to 2033 Figure 26: North America Market Value (US$ million) by Product, 2023 to 2033 Figure 27: North America Market Value (US$ million) by Technology, 2023 to 2033 Figure 28: North America Market Value (US$ million) by Application, 2023 to 2033 Figure 29: North America Market Value (US$ million) by End User, 2023 to 2033 Figure 30: North America Market Value (US$ million) by Country, 2023 to 2033 Figure 31: North America Market Value (US$ million) Analysis by Country, 2017 to 2033 Figure 32: North America Market Value Share (%) and BPS Analysis by Country, 2023 to 2033 Figure 33: North America Market Y-o-Y Growth (%) Projections by Country, 2023 to 2033 Figure 34: North America Market Value (US$ million) Analysis by Product, 2017 to 2033 Figure 35: North America Market Value Share (%) and BPS Analysis by Product, 2023 to 2033 Figure 36: North America Market Y-o-Y Growth (%) Projections by Product, 2023 to 2033 Figure 37: North America Market Value (US$ million) Analysis by Technology, 2017 to 2033 Figure 38: North America Market Value Share (%) and BPS Analysis by Technology, 2023 to 2033 Figure 39: North America Market Y-o-Y Growth (%) Projections by Technology, 2023 to 2033 Figure 40: North America Market Value (US$ million) Analysis by Application, 2017 to 2033 Figure 41: North America Market Value Share (%) and BPS Analysis by Application, 2023 to 2033 Figure 42: North America Market Y-o-Y Growth (%) Projections by Application, 2023 to 2033 Figure 43: North America Market Value (US$ million) Analysis by End User, 2017 to 2033 Figure 44: North America Market Value Share (%) and BPS Analysis by End User, 2023 to 2033 Figure 45: North America Market Y-o-Y Growth (%) Projections by End User, 2023 to 2033 Figure 46: North America Market Attractiveness by Product, 2023 to 2033 Figure 47: North America Market Attractiveness by Technology, 2023 to 2033 Figure 48: North America Market Attractiveness by Application, 2023 to 2033 Figure 49: North America Market Attractiveness by End User, 2023 to 2033 Figure 50: North America Market Attractiveness by Country, 2023 to 2033 Figure 51: Latin America Market Value (US$ million) by Product, 2023 to 2033 Figure 52: Latin America Market Value (US$ million) by Technology, 2023 to 2033 Figure 53: Latin America Market Value (US$ million) by Application, 2023 to 2033 Figure 54: Latin America Market Value (US$ million) by End User, 2023 to 2033 Figure 55: Latin America Market Value (US$ million) by Country, 2023 to 2033 Figure 56: Latin America Market Value (US$ million) Analysis by Country, 2017 to 2033 Figure 57: Latin America Market Value Share (%) and BPS Analysis by Country, 2023 to 2033 Figure 58: Latin America Market Y-o-Y Growth (%) Projections by Country, 2023 to 2033 Figure 59: Latin America Market Value (US$ million) Analysis by Product, 2017 to 2033 Figure 60: Latin America Market Value Share (%) and BPS Analysis by Product, 2023 to 2033 Figure 61: Latin America Market Y-o-Y Growth (%) Projections by Product, 2023 to 2033 Figure 62: Latin America Market Value (US$ million) Analysis by Technology, 2017 to 2033 Figure 63: Latin America Market Value Share (%) and BPS Analysis by Technology, 2023 to 2033 Figure 64: Latin America Market Y-o-Y Growth (%) Projections by Technology, 2023 to 2033 Figure 65: Latin America Market Value (US$ million) Analysis by Application, 2017 to 2033 Figure 66: Latin America Market Value Share (%) and BPS Analysis by Application, 2023 to 2033 Figure 67: Latin America Market Y-o-Y Growth (%) Projections by Application, 2023 to 2033 Figure 68: Latin America Market Value (US$ million) Analysis by End User, 2017 to 2033 Figure 69: Latin America Market Value Share (%) and BPS Analysis by End User, 2023 to 2033 Figure 70: Latin America Market Y-o-Y Growth (%) Projections by End User, 2023 to 2033 Figure 71: Latin America Market Attractiveness by Product, 2023 to 2033 Figure 72: Latin America Market Attractiveness by Technology, 2023 to 2033 Figure 73: Latin America Market Attractiveness by Application, 2023 to 2033 Figure 74: Latin America Market Attractiveness by End User, 2023 to 2033 Figure 75: Latin America Market Attractiveness by Country, 2023 to 2033 Figure 76: Europe Market Value (US$ million) by Product, 2023 to 2033 Figure 77: Europe Market Value (US$ million) by Technology, 2023 to 2033 Figure 78: Europe Market Value (US$ million) by Application, 2023 to 2033 Figure 79: Europe Market Value (US$ million) by End User, 2023 to 2033 Figure 80: Europe Market Value (US$ million) by Country, 2023 to 2033 Figure 81: Europe Market Value (US$ million) Analysis by Country, 2017 to 2033 Figure 82: Europe Market Value Share (%) and BPS Analysis by Country, 2023 to 2033 Figure 83: Europe Market Y-o-Y Growth (%) Projections by Country, 2023 to 2033 Figure 84: Europe Market Value (US$ million) Analysis by Product, 2017 to 2033 Figure 85: Europe Market Value Share (%) and BPS Analysis by Product, 2023 to 2033 Figure 86: Europe Market Y-o-Y Growth (%) Projections by Product, 2023 to 2033 Figure 87: Europe Market Value (US$ million) Analysis by Technology, 2017 to 2033 Figure 88: Europe Market Value Share (%) and BPS Analysis by Technology, 2023 to 2033 Figure 89: Europe Market Y-o-Y Growth (%) Projections by Technology, 2023 to 2033 Figure 90: Europe Market Value (US$ million) Analysis by Application, 2017 to 2033 Figure 91: Europe Market Value Share (%) and BPS Analysis by Application, 2023 to 2033 Figure 92: Europe Market Y-o-Y Growth (%) Projections by Application, 2023 to 2033 Figure 93: Europe Market Value (US$ million) Analysis by End User, 2017 to 2033 Figure 94: Europe Market Value Share (%) and BPS Analysis by End User, 2023 to 2033 Figure 95: Europe Market Y-o-Y Growth (%) Projections by End User, 2023 to 2033 Figure 96: Europe Market Attractiveness by Product, 2023 to 2033 Figure 97: Europe Market Attractiveness by Technology, 2023 to 2033 Figure 98: Europe Market Attractiveness by Application, 2023 to 2033 Figure 99: Europe Market Attractiveness by End User, 2023 to 2033 Figure 100: Europe Market Attractiveness by Country, 2023 to 2033 Figure 101: East Asia Market Value (US$ million) by Product, 2023 to 2033 Figure 102: East Asia Market Value (US$ million) by Technology, 2023 to 2033 Figure 103: East Asia Market Value (US$ million) by Application, 2023 to 2033 Figure 104: East Asia Market Value (US$ million) by End User, 2023 to 2033 Figure 105: East Asia Market Value (US$ million) by Country, 2023 to 2033 Figure 106: East Asia Market Value (US$ million) Analysis by Country, 2017 to 2033 Figure 107: East Asia Market Value Share (%) and BPS Analysis by Country, 2023 to 2033 Figure 108: East Asia Market Y-o-Y Growth (%) Projections by Country, 2023 to 2033 Figure 109: East Asia Market Value (US$ million) Analysis by Product, 2017 to 2033 Figure 110: East Asia Market Value Share (%) and BPS Analysis by Product, 2023 to 2033 Figure 111: East Asia Market Y-o-Y Growth (%) Projections by Product, 2023 to 2033 Figure 112: East Asia Market Value (US$ million) Analysis by Technology, 2017 to 2033 Figure 113: East Asia Market Value Share (%) and BPS Analysis by Technology, 2023 to 2033 Figure 114: East Asia Market Y-o-Y Growth (%) Projections by Technology, 2023 to 2033 Figure 115: East Asia Market Value (US$ million) Analysis by Application, 2017 to 2033 Figure 116: East Asia Market Value Share (%) and BPS Analysis by Application, 2023 to 2033 Figure 117: East Asia Market Y-o-Y Growth (%) Projections by Application, 2023 to 2033 Figure 118: East Asia Market Value (US$ million) Analysis by End User, 2017 to 2033 Figure 119: East Asia Market Value Share (%) and BPS Analysis by End User, 2023 to 2033 Figure 120: East Asia Market Y-o-Y Growth (%) Projections by End User, 2023 to 2033 Figure 121: East Asia Market Attractiveness by Product, 2023 to 2033 Figure 122: East Asia Market Attractiveness by Technology, 2023 to 2033 Figure 123: East Asia Market Attractiveness by Application, 2023 to 2033 Figure 124: East Asia Market Attractiveness by End User, 2023 to 2033 Figure 125: East Asia Market Attractiveness by Country, 2023 to 2033 Figure 126: South Asia & Pacific Market Value (US$ million) by Product, 2023 to 2033 Figure 127: South Asia & Pacific Market Value (US$ million) by Technology, 2023 to 2033 Figure 128: South Asia & Pacific Market Value (US$ million) by Application, 2023 to 2033 Figure 129: South Asia & Pacific Market Value (US$ million) by End User, 2023 to 2033 Figure 130: South Asia & Pacific Market Value (US$ million) by Country, 2023 to 2033 Figure 131: South Asia & Pacific Market Value (US$ million) Analysis by Country, 2017 to 2033 Figure 132: South Asia & Pacific Market Value Share (%) and BPS Analysis by Country, 2023 to 2033 Figure 133: South Asia & Pacific Market Y-o-Y Growth (%) Projections by Country, 2023 to 2033 Figure 134: South Asia & Pacific Market Value (US$ million) Analysis by Product, 2017 to 2033 Figure 135: South Asia & Pacific Market Value Share (%) and BPS Analysis by Product, 2023 to 2033 Figure 136: South Asia & Pacific Market Y-o-Y Growth (%) Projections by Product, 2023 to 2033 Figure 137: South Asia & Pacific Market Value (US$ million) Analysis by Technology, 2017 to 2033 Figure 138: South Asia & Pacific Market Value Share (%) and BPS Analysis by Technology, 2023 to 2033 Figure 139: South Asia & Pacific Market Y-o-Y Growth (%) Projections by Technology, 2023 to 2033 Figure 140: South Asia & Pacific Market Value (US$ million) Analysis by Application, 2017 to 2033 Figure 141: South Asia & Pacific Market Value Share (%) and BPS Analysis by Application, 2023 to 2033 Figure 142: South Asia & Pacific Market Y-o-Y Growth (%) Projections by Application, 2023 to 2033 Figure 143: South Asia & Pacific Market Value (US$ million) Analysis by End User, 2017 to 2033 Figure 144: South Asia & Pacific Market Value Share (%) and BPS Analysis by End User, 2023 to 2033 Figure 145: South Asia & Pacific Market Y-o-Y Growth (%) Projections by End User, 2023 to 2033 Figure 146: South Asia & Pacific Market Attractiveness by Product, 2023 to 2033 Figure 147: South Asia & Pacific Market Attractiveness by Technology, 2023 to 2033 Figure 148: South Asia & Pacific Market Attractiveness by Application, 2023 to 2033 Figure 149: South Asia & Pacific Market Attractiveness by End User, 2023 to 2033 Figure 150: South Asia & Pacific Market Attractiveness by Country, 2023 to 2033 Figure 151: MEA Market Value (US$ million) by Product, 2023 to 2033 Figure 152: MEA Market Value (US$ million) by Technology, 2023 to 2033 Figure 153: MEA Market Value (US$ million) by Application, 2023 to 2033 Figure 154: MEA Market Value (US$ million) by End User, 2023 to 2033 Figure 155: MEA Market Value (US$ million) by Country, 2023 to 2033 Figure 156: MEA Market Value (US$ million) Analysis by Country, 2017 to 2033 Figure 157: MEA Market Value Share (%) and BPS Analysis by Country, 2023 to 2033 Figure 158: MEA Market Y-o-Y Growth (%) Projections by Country, 2023 to 2033 Figure 159: MEA Market Value (US$ million) Analysis by Product, 2017 to 2033 Figure 160: MEA Market Value Share (%) and BPS Analysis by Product, 2023 to 2033 Figure 161: MEA Market Y-o-Y Growth (%) Projections by Product, 2023 to 2033 Figure 162: MEA Market Value (US$ million) Analysis by Technology, 2017 to 2033 Figure 163: MEA Market Value Share (%) and BPS Analysis by Technology, 2023 to 2033 Figure 164: MEA Market Y-o-Y Growth (%) Projections by Technology, 2023 to 2033 Figure 165: MEA Market Value (US$ million) Analysis by Application, 2017 to 2033 Figure 166: MEA Market Value Share (%) and BPS Analysis by Application, 2023 to 2033 Figure 167: MEA Market Y-o-Y Growth (%) Projections by Application, 2023 to 2033 Figure 168: MEA Market Value (US$ million) Analysis by End User, 2017 to 2033 Figure 169: MEA Market Value Share (%) and BPS Analysis by End User, 2023 to 2033 Figure 170: MEA Market Y-o-Y Growth (%) Projections by End User, 2023 to 2033 Figure 171: MEA Market Attractiveness by Product, 2023 to 2033 Figure 172: MEA Market Attractiveness by Technology, 2023 to 2033 Figure 173: MEA Market Attractiveness by Application, 2023 to 2033 Figure 174: MEA Market Attractiveness by End User, 2023 to 2033 Figure 175: MEA Market Attractiveness by Country, 2023 to 2033
Need specific information?
Request CustomizationExplore Technology Insights
View Reports