The hydrocephalus shunt market is expected to expand steadily from USD 556.4 million in 2025 to USD 705.4 million by 2035, progressing at a CAGR of 2.4%. Market growth reflects a balance of technological improvements, clinical adoption, and gradual penetration in emerging regions. Despite its relatively modest CAGR, the market maintains reliable demand due to the necessity of shunt-based therapies for hydrocephalus patients globally.
By 2030, the market is projected to reach nearly USD 634.2 million, highlighting steady mid-term growth. This progression reflects sustained global demand as hydrocephalus shunts remain essential in standard treatment protocols. Although expansion is modest, technology-driven innovations and gradual adoption in emerging regions support market resilience. Over 2025 to 2035, the sector is poised to achieve an absolute growth of about USD 149.0 million, underscoring consistent patient reliance on shunt-based therapies and incremental advances that enhance effectiveness, safety, and long-term outcomes worldwide.
Leading companies such as Medtronic plc, Johnson & Johnson Services, Inc., B. Braun Melsungen AG, Sophysa SA, and Integra LifeSciences Corporation are consolidating their positions by strengthening product portfolios and advancing next‑generation shunt technologies. Their focus includes programmable valves, pressure regulation mechanisms, and catheter designs that minimize complications, enabling stronger market penetration across both developed healthcare systems and emerging regions. By investing in innovation, reliability, and cost‑effective solutions, these players are enhancing access for patients while capturing growth opportunities in a highly specialized neurosurgical device segment.
The market holds a critical position in the neurosurgical device sector, capturing demand primarily from ventriculoperitoneal procedures, which account for over 93% of all interventions due to their reliability and clinical effectiveness. Hydrocephalus valves, representing more than 85% of product usage, remain central to patient care for regulating cerebrospinal fluid levels and preventing complications. This sector contributes substantially to the broader neurosurgical devices landscape, driven by consistent treatment need, advancements in valve technology, and increasing access to neurosurgery in emerging healthcare markets.
The market is evolving with programmable valves, anti-siphon mechanisms, and biocompatible catheter materials that enhance precision, reduce revision rates, and improve long-term patient outcomes. Companies are strengthening their portfolios with smarter, minimally invasive shunt systems, aiming to minimize complications such as infections or blockages. Strategic collaborations with hospitals, neurosurgical institutes, and regional healthcare providers are reshaping accessibility and positioning advanced hydrocephalus shunt systems as essential solutions for pediatric and adult hydrocephalus treatment worldwide.
Neurosurgeons evaluate hydrocephalus shunt specifications based on valve pressure regulation accuracy, catheter flexibility characteristics, and infection resistance properties when establishing treatment protocols for pediatric patients, normal pressure hydrocephalus cases, and post-traumatic cerebrospinal fluid accumulation requiring reliable drainage systems.
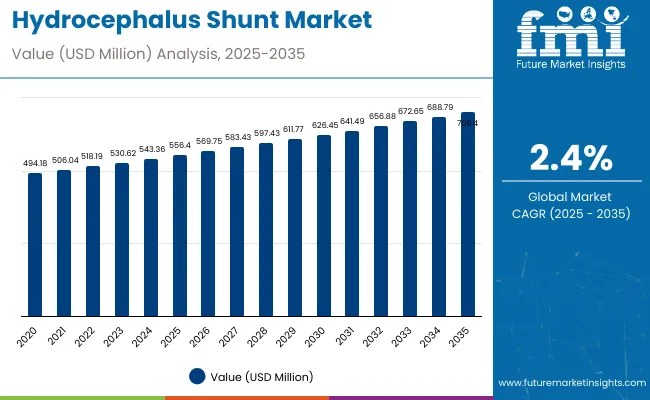
| Metric | Value |
|---|---|
| Estimated Value in 2025 (E) | USD 556.4 million |
| Forecast Value in 2035 (F) | USD 705.4 million |
| Forecast CAGR (2025 to 2035) | 2.4% |
The hydrocephalus shunt market is growing due to the rising prevalence of hydrocephalus across pediatric, adult, and geriatric populations and the continued reliance on shunt-based procedures as the gold standard treatment. Demand is reinforced by advancements in programmable valves, anti-siphon mechanisms, and biocompatible catheter materials, which reduce complications and improve long-term patient outcomes.
Increasing diagnosis rates in emerging markets such as India and China, supported by expanding healthcare infrastructure and rising neurosurgical access, are also driving adoption. In mature markets like the USA, Europe, and Japan, steady demand is sustained by technological innovation and replacement surgeries for existing patients.
Key market players are enhancing competitiveness by focusing on next-generation programmable shunt systems, reliability improvements, and strategic collaborations with hospitals and neurosurgical institutes to expand treatment access. Strong emphasis on safety, durability, and regulatory compliance ensures trust among physicians and patients.
The market is segmented by product type, procedure type, age group, and region. By product type, the market is bifurcated into hydrocephalus valves (fixed pressure valves and adjustable pressure valves) and hydrocephalus catheters (standard catheters and antimicrobial catheters).
Based on procedure type, the market is divided into ventriculoperitoneal, ventriculoatrial, lumboperitoneal, and ventriculopleural. In terms of age group, the market is bifurcated into pediatric and adult. Regionally, the market is classified into North America, Latin America, Western Europe, Eastern Europe, South Asia and Pacific, East Asia, and the Middle East & Africa.
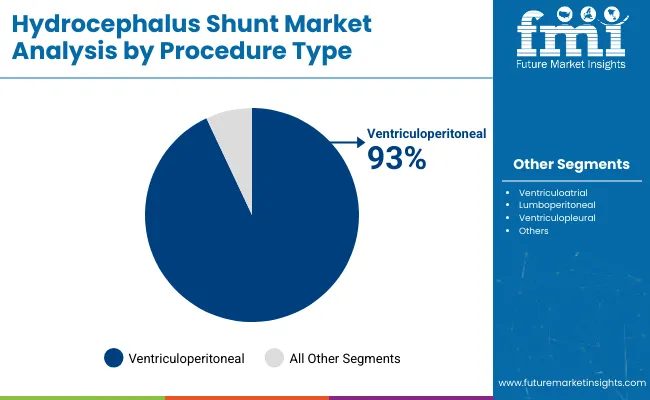
The most lucrative segment in the market is the ventriculoperitoneal (VP) shunt procedure type, dominating the market with a substantial share exceeding 93%. This segment's prominence stems from its wide clinical acceptance as the standard treatment for hydrocephalus, effectively diverting excess cerebrospinal fluid from the brain to the peritoneal cavity. Growth is driven by the increasing incidence of hydrocephalus in both pediatric and elderly populations, along with technological advancements such as programmable and adjustable valves that improve patient outcomes and reduce complications.
The preference for minimally invasive surgical techniques and rising awareness about neurological disorders further reinforce the VP shunt segment’s dominance. Other procedure types like ventriculoatrial, lumboperitoneal, and ventriculopleural shunts account for much smaller shares and are typically reserved for specific clinical cases. Overall, the VP shunt segment’s combination of clinical efficacy, technological innovation, and widespread adoption makes it the most lucrative and fastest-growing segment in the hydrocephalus shunt market.
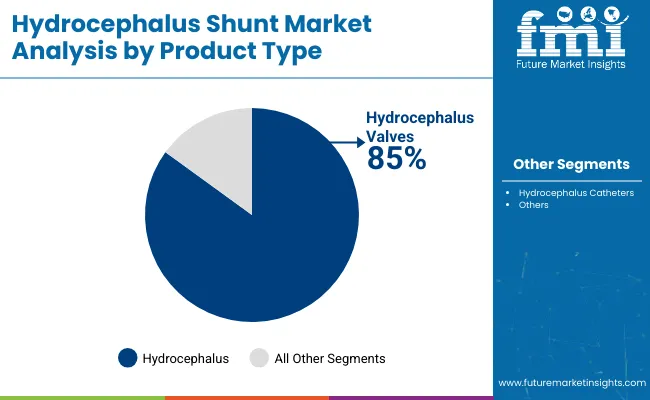
The hydrocephalus valves segment dominates the hydrocephalus shunt market, holding 85% market share in 2025, making it the most lucrative product type. This segment includes fixed pressure valves and adjustable pressure valves, with adjustable valves gaining traction due to their flexibility in regulating cerebrospinal fluid flow tailored to patient needs. Valves are critical components for controlling fluid drainage and minimizing complications. The catheters segment accounts for the remaining share and consists of standard catheters and antimicrobial catheters, the latter designed to reduce infection risks and improve patient outcomes.
The dominance of the valves segment is driven by technological innovations such as programmable valves and remote monitoring, which enhance efficacy and reduce revision surgeries. Leading companies are investing heavily in R&D for advanced valves to capture market growth. The valves’ greater contribution to overall market revenue reflects their complexity, higher cost, and clinical importance compared to catheters, which, while essential, generate relatively lower revenue per unit.
The hydrocephalus shunt market from 2025 to 2035 is driven by increasing patient diagnosis rates, rising prevalence of hydrocephalus among pediatric and elderly populations, and expanding healthcare infrastructure globally. Technological advancements such as programmable valves, anti-siphon mechanisms, and antimicrobial catheter designs are improving safety and efficacy, encouraging wider adoption. Increasing access in emerging regions like India and China fuels market expansion.
Health Awareness and Clinical Innovation Boost Hydrocephalus Shunt Market Growth
Increasing awareness among healthcare professionals and patients about hydrocephalus, coupled with improvements in early diagnosis through advanced imaging technologies such as MRI and CT scans, are key drivers of the hydrocephalus shunt market. Innovative technologies, particularly programmable and adjustable pressure shunts, improve patient outcomes by allowing customized cerebrospinal fluid regulation and reducing complications. Rising adoption of minimally invasive surgical techniques further supports market expansion.
Innovation and Sustainability Expanding Hydrocephalus Shunt Market Opportunities
Innovation in hydrocephalus shunt technology is broadening market opportunities beyond traditional device segments. Advances include programmable and pressure-adjustable valves, antimicrobial and biocompatible catheter materials, and smart shunt systems that improve patient monitoring and reduce complications. These innovations cater to personalized treatment needs and enhance long-term patient outcomes. Manufacturers are also focusing on sustainable practices, including eco-friendly manufacturing processes and materials. Emphasis on regulatory compliance, quality certifications, and durability standards appeals to healthcare providers and patients alike.
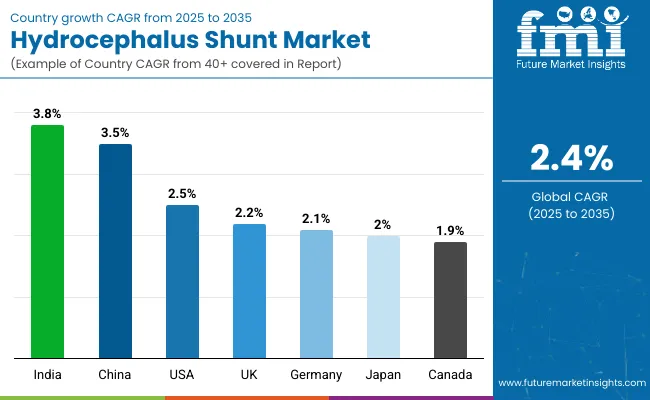
| Countries | CAGR (2025 to 2035) |
|---|---|
| India | 3.8% |
| China | 3.5% |
| United States | 2.5% |
| United Kingdom | 2.2% |
| Germany | 2.1% |
| Japan | 2.0% |
| Canada | 1.9% |
The growth rates of countries in the market vary significantly. India leads with a CAGR of 3.8% for 2025-2035, driven by expanding healthcare infrastructure and rising diagnosis rates. China follows closely with a 3.5% CAGR, supported by urbanization and government healthcare investments. The USA grows at about 2.5%, reflecting its mature market and technological leadership.
The UK and Germany have moderate growth rates near 2.2% and 2.1%, respectively, driven by established healthcare systems. Japan’s market grows at 2.0%, influenced by an aging population, while Canada shows the slowest growth at 1.9%, due to a stable but mature healthcare structure. Emerging markets show stronger growth potential compared to developed ones.
The report covers an in-depth analysis of 40+ countries; seven top-performing OECD countries are highlighted below.
Demand for hydrocephalus shunt in India is expected to grow steadily with a CAGR of 3.8% from 2025 to 2035. This growth is supported by expanding healthcare infrastructure and increasing diagnosis rates of hydrocephalus. Government health initiatives and improving neurosurgical facilities are facilitating access to advanced shunt devices. The pediatric population is a significant contributor to demand, while rising awareness and insurance coverage enhance patient reach. Local manufacturing and strategic partnerships with global players reduce costs and improve technology adoption. Accessibility in tier 2 and 3 cities continues to strengthen, fostering sustained growth in this emerging market.
Revenue from hydrocephalus shunt in China is projected to expand at a CAGR of around 3.5% during 2025 to 2035. Key drivers include urbanization, aging demographics, and increased diagnosis of neurological disorders. Investments in healthcare infrastructure and reimbursement policies are supporting widespread adoption of advanced shunt systems. The growing number of specialized hospitals and local manufacturing reduces barriers to access while fostering integration of innovative programmable valves. Additionally, government programs emphasize early diagnosis and treatment, further boosting growth. Collaborative efforts between domestic and international manufacturers enhance market penetration and technology transfer.
Revenue from hydrocephalus shunts in the USA, with a CAGR of about 2.5% from 2025 to 2035, remains the largest and most technologically advanced globally. High healthcare spending and early diagnosis contribute to robust demand. There is significant adoption of programmable valves that improve treatment outcomes and reduce complications. Research institutions leading clinical trials accelerate innovation, while insurance coverage facilitates patient access. The aging population and increasing neurological disorder rates sustain steady market growth. Collaborations between manufacturers and hospitals drive continuous product improvements and market expansion.
The hydrocephalus shunt market in the UK is expected to grow at a CAGR near 2.2% from 2025 to 2035. This growth is supported by the National Health Service (NHS) initiatives focusing on improved neurological care access and early screening. Increasing clinical adoption of MRI-compatible and advanced programmable shunts enhances market potential. Outpatient surgeries and digital health solutions optimize patient management. Additionally, government grants for training and collaborative research with industry partners strengthen innovation adoption. Enhanced patient and physician awareness ensures better diagnosis and treatment adherence.
Demand for hydrocephalus shunts in Germany is growing at a CAGR of 2.1% over 2025 to 2035, with a focus on advanced neurosurgical devices and programmable valves. High healthcare expenditure and insurance coverage support frequent adoption. Innovations such as AI-assisted surgical planning and biodegradable catheter materials are gaining traction. Multi-center clinical collaborations speed product development. Hospitals have robust infrastructures to support complex neurological surgeries. Rigorous patient monitoring and rehabilitation programs sustain demand. Government-funded programs encourage continuous research and innovation.
Demand for hydrocephalus shunt in Japan shows steady growth with a CAGR of around 2.0% for 2025 to 2035, driven by its aging demographics. Normal pressure hydrocephalus common in elderly patients drives demand. Advanced MRI-compatible and pressure-sensing valves dominate usage. Government support for R&D and early intervention promotes market expansion. Hospitals emphasize minimally invasive procedures for better recovery. Clinical awareness and patient education strengthen diagnosis rates. Industry collaborations accelerate technology diffusion and customized treatment options.
Revenue from hydrocephalus shunts in Canada is expected to grow at a CAGR of about 1.9% from 2025 to 2035, supported by a well-established public healthcare network. Increasing deployment of programmable valve technologies and expanded provincial neurological care centers fuel growth. Government policies prioritize equitable access and postoperative monitoring programs. Research funding encourages product development and clinical trials. Collaboration between healthcare providers enhances patient care and revision surgery rates decrease. The expanding homecare segment aids in long-term patient management.
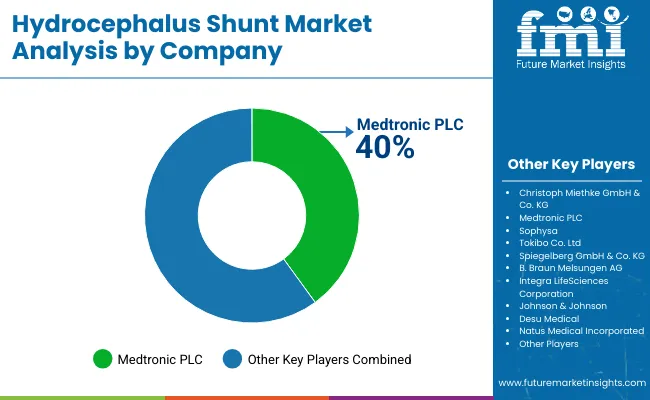
The Hydrocephalus Shunt Market is expanding steadily as the prevalence of neurological disorders, traumatic brain injuries, and congenital hydrocephalus continues to rise worldwide. Key industry players such as Medtronic plc and Johnson & Johnson Services Inc. are leading innovation in programmable and flow-regulating shunt systems that enhance cerebrospinal fluid (CSF) management and reduce complications.
B. Braun Melsungen AG focuses on precision-engineered catheter materials and infection-resistant coatings, addressing one of the major challenges in shunt implantation — infection control. Sophysa SA has established a strong presence in Europe with its advanced adjustable pressure valve technologies, which provide improved patient comfort and adaptability to changing intracranial pressure conditions.
Integra LifeSciences Corporation continues to invest in neurosurgical device portfolios and digital monitoring solutions, strengthening its footprint in both developed and emerging healthcare markets. The growing emphasis on minimally invasive neurosurgical procedures and long-term patient management systems is propelling technological advancements across the market.
| Items | Values |
|---|---|
| Quantitative Units (2025) | USD 556.4 million |
| Product Type | Hydrocephalus Valves (Fixed Pressure Valves, Adjustable Pressure Valves), Hydrocephalus Catheters (Standard Catheters, Antimicrobial Catheters) |
| Procedure Type | Ventriculoperitoneal , Ventriculoatrial , Lumboperitoneal , Ventriculopleural |
| Age Group | Pediatric, Adult, Geriatric |
| Key Growth Regions | North America, Latin America, Europe, the Middle East and Africa, East Asia, South Asia |
| Countries Covered | United States, Canada, United Kingdom, Germany, France, China, Japan, South Korea, Brazil, Australia, and 40+ countries |
| Key Companies Profiled | Medtronic plc, Johnson & Johnson Services Inc., B. Braun Melsungen AG, Sophysa SA, Integra LifeSciences Corporation |
| Additional Attributes | Dollar sales by product and procedure type, adoption of programmable valves and antimicrobial catheters, expansion of healthcare infrastructure, advances in minimally invasive procedures, rising hydrocephalus prevalence, and growing pediatric patient base |
The global hydrocephalus shunt market is estimated to be valued at USD 556.4 million in 2025.
The market size for hydrocephalus shunt is projected to reach USD 705.4 million by 2035.
The hydrocephalus shunt market is expected to grow at a 2.4% CAGR between 2025 and 2035.
The hydrocephalus valves segment is projected to lead in the hydrocephalus shunt market with 85% market share in 2025.
In terms of procedure type, ventriculoperitoneal shunts are expected to command 93% share in the hydrocephalus shunt market in 2025.


Full Research Suite comprises of:
Market outlook & trends analysis
Interviews & case studies
Strategic recommendations
Vendor profiles & capabilities analysis
5-year forecasts
8 regions and 60+ country-level data splits
Market segment data splits
12 months of continuous data updates
DELIVERED AS:
PDF EXCEL ONLINE
Shunt Voltage References Market
Shunt Reactor Market Growth – Trends & Forecast 2020 to 2030
Fixed Shunt Reactor Market Size and Share Forecast Outlook 2025 to 2035
Variable Shunt Reactor Market Size and Share Forecast Outlook 2025 to 2035
Three Phase Shunt Reactor Market Size and Share Forecast Outlook 2025 to 2035
Interatrial Shunt Market
Controllable Shunt Reactor for UHV Market Size and Share Forecast Outlook 2025 to 2035
Oil Immersed Shunt Reactor Market Size and Share Forecast Outlook 2025 to 2035
Single Phase Shunt Reactor Market Size and Share Forecast Outlook 2025 to 2035
Utility Based Shunt Reactor Market Size and Share Forecast Outlook 2025 to 2035
Air Core Fixed Shunt Reactor Market Size and Share Forecast Outlook 2025 to 2035
Renewable Based Shunt Reactor Market Size and Share Forecast Outlook 2025 to 2035
Air Core Variable Shunt Reactor Market Size and Share Forecast Outlook 2025 to 2035
Single Phase Variable Shunt Reactor Market Size and Share Forecast Outlook 2025 to 2035

Thank you!
You will receive an email from our Business Development Manager. Please be sure to check your SPAM/JUNK folder too.
Chat With
MaRIA