The Indigo Carmine Market is estimated to be valued at USD 54.0 billion in 2025 and is projected to reach USD 86.3 billion by 2035, registering a compound annual growth rate (CAGR) of 4.8% over the forecast period.
The indigo carmine market is currently advancing due to rising demand for synthetic colorants in food and pharmaceutical formulations that require stability, high solubility, and visual consistency. Increasing adoption by confectionery and packaged food manufacturers has sustained market momentum, especially in regions with high consumption of ready-to-eat products.
Regulatory approvals in key markets and the affordability of indigo carmine compared to natural alternatives have played a critical role in maintaining its position. Enhanced manufacturing practices are ensuring lower impurity levels and higher compliance with food-grade and pharmaceutical-grade specifications.
Additionally, the market is seeing growing integration into industrial applications such as diagnostic reagents and textile dyes, further broadening its end-use potential. As consumer preferences shift toward vibrant, consistent product aesthetics and as global food processing scales up, the market for indigo carmine is expected to continue expanding steadily, with opportunities emerging across customized blends, powdered formats, and bulk-use supply models.
The market is segmented by Type and Application and region. By Type, the market is divided into Type I, Type II, and Type III. In terms of Application, the market is classified into Candy/ Confectionery, Dairy, Beverage, Bakery, Snacks, and Cereals, Sauces, Soups, and Dressings, Fruit Preparations/ Fillings, Meat, Poultry, Fish, and Eggs, Potatoes, Pasta, and Rice, Pet Food, Seasonings, and Others. Regionally, the market is classified into North America, Latin America, Western Europe, Eastern Europe, Balkan & Baltic Countries, Russia & Belarus, Central Asia, East Asia, South Asia & Pacific, and the Middle East & Africa.
The market is segmented by Type and Application and region. By Type, the market is divided into Type I, Type II, and Type III. In terms of Application, the market is classified into Candy/ Confectionery, Dairy, Beverage, Bakery, Snacks, and Cereals, Sauces, Soups, and Dressings, Fruit Preparations/ Fillings, Meat, Poultry, Fish, and Eggs, Potatoes, Pasta, and Rice, Pet Food, Seasonings, and Others. Regionally, the market is classified into North America, Latin America, Western Europe, Eastern Europe, Balkan & Baltic Countries, Russia & Belarus, Central Asia, East Asia, South Asia & Pacific, and the Middle East & Africa.
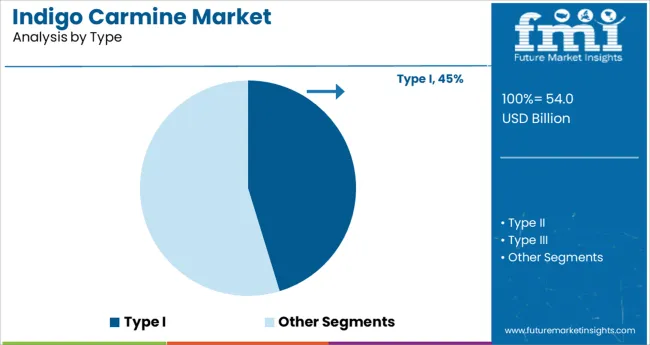
Within the type category, Type I indigo carmine is expected to contribute 45.3% of the total revenue share in 2025, making it the leading segment. This dominance is driven by its high purity, consistent dye strength, and compatibility with a broad spectrum of food and pharmaceutical applications.
Type I variants offer better solubility in aqueous solutions and are preferred in applications where stringent quality and safety standards are enforced. Manufacturers have prioritized Type I formulations due to their ease of incorporation in automated production systems and compliance with established regulatory norms in North America and Europe. Its stable performance under varying pH levels and heat conditions has reinforced its role in high-volume commercial uses.
Additionally, lower manufacturing variability and reduced risk of contamination have made Type I a preferred option for long-term supplier contracts, contributing to its sustained leadership in the global indigo carmine market.
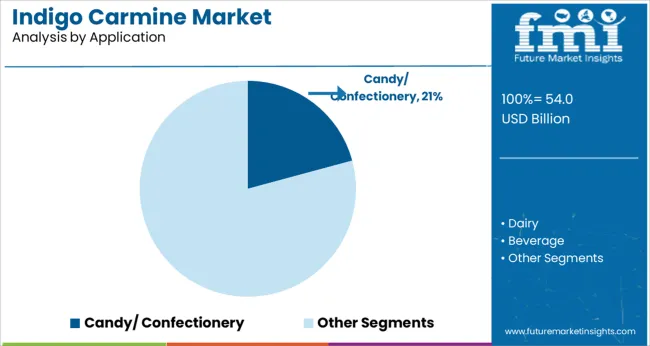
The candy and confectionery segment is anticipated to represent 20.8% of the total application-based revenue share in 2025, positioning it as a leading subsegment. This leadership is supported by the widespread use of indigo carmine to deliver vibrant and consistent blue coloring in a range of products such as hard candies, gummies, and coated sweets.
Its ability to maintain hue stability across processing, packaging, and shelf-life stages has made it a reliable solution for high-output confectionery lines. Additionally, regulatory approvals and low toxicity profiles have made it suitable for use in children's products, where vivid visual appeal is often essential.
As consumer preferences continue to shift toward visually striking and multi-colored treats, confectionery manufacturers have increasingly relied on indigo carmine as a core component in their coloring strategies. Its compatibility with other synthetic and natural dyes for blend formulations has further expanded its use across seasonal and novelty candy products, securing its strong position within this market segment.
The global indigo carmine sales are projected to grow at a CAGR of 4.8% between 2025 and 2035, in comparison to the 3.2% CAGR registered from 2020 to 2024. The rising adoption of indigo carmine as a food coloring additive in the food and beverage industry is a key factor driving growth in the global indigo carmine market.
Over the years, indigo carmine, also called indigotin and brilliant indigo, has become one of the commonly used food coloring additives in the food and beverage industry on account of its low cost, easy availability, and several other benefits. It is a more vibrant coloring agent than other available natural colorings and adds much greater stability to the product. Rising applications of indigo carmine in food and beverages are expected to push the demand for indigo carmine over the assessment period.
Indigo carmine is used in coloring frozen, convenience, ready-to-eat, and processed foods, carbonated drinks, and alcoholic beverages as well as juices, sauces, etc. Thus, increasing consumption of these products along with growing demand for exotic-looking food dishes and increasing importance to food appeal preferences will propel sales of indigo carmine during the forecast period.
Food and beverage manufacturers utilize indigo carmine to make food more attractive, enhance the naturally occurring color, provide color to colorless food, and allow the consumer to identify the product by sight.
Similarly, the rising usage of indigo carmine across industries like pharmaceuticals, household cleaning products, medical pieces of equipment, stamp dyes, and cosmetics is expected to aid the growth of the indigo carmine market. Indigo Carmine is being increasingly used for diagnostic purposes in the healthcare industry.
Indigo Carmine appears to cause allergic and intolerance reactions. Also, misconceptions about synthetic food colorants among consumers are key restraints to the market. Indigo Carmine, even though is a water-soluble non-azo colorant, its water solubility is not that good, hence it has found lesser application in liquid food items. Indigo Carmine lacks nutritional content. Also, the snowballing consumption of natural food colors by big food processing industries might impact the indigo carmine revenue.
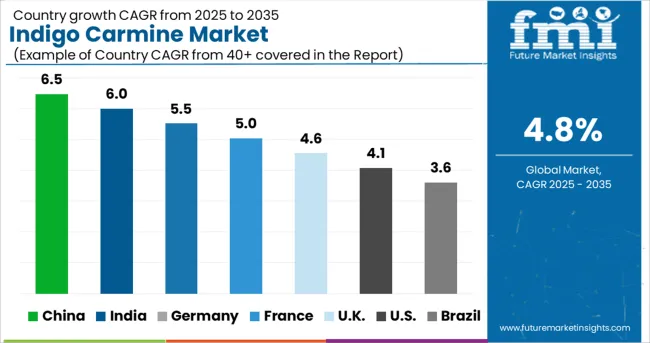
Rising Adoption of Indigo Carmine as a Diagnostic Dye Creating Opportunities in the USA Market
As per FMI, the USA indigo carmine market was valued at USD 51.5 Million in 2024 and is likely to expand at a relatively higher CAGR during the assessment period. Demand for indigo carmine in the USA market is driven by rapid adoption from the healthcare and food & beverage industries.
With changing lifestyles and rapid economic growth, there has been a sharp rise in the consumption of foods like bakeries, snacks and cereals, beverages, and fruit fillings across the USA during the last few years. As indigo carmine is being increasingly used in these products, the surge in their production and sales will stimulate growth in the global indigo carmine market.
Similarly, the rising usage of indigo carmine as a diagnostic dye in the healthcare industry is playing a key role in propelling growth in the USA indigo carmine market.
Additionally, factors such as the growing popularity of affordable synthetic food colorants, expansion of food manufacturing industries, and heavy presence of leading indigo carmine manufacturers are likely to expand the indigo carmine market size in the USA during the forecast period.
Application of Indigo Carmine in the Food and Beverage Industry Driving Growth in the China Market
The total sales of indigo carmine reached USD 3.3 Million in China in 2024 and are further slated to grow at a CAGR of 4.2% during the forecast period (2025 to 2035). This can be attributed to the rising usage of indigo carmine in applications like beverages, bakeries, snacks, confectioneries, dairy, fruit preparations, sauces, soups, dressings, pet food, etc.
Similarly, the growing popularity of synthetic food colorants due to their easy availability and cost-effectiveness, the presence of lax government regulations, and the growth of various food industries, such as meat processing, bakery & confectionery, pet food industry, and functional food products will favor the growth of the indigo carmine market in the country during the forecast period.
Demand for Indigo Carmine to Remain High in Beverages Segment
By application, the beverages segment holds the largest share of 24.7% of the global indigo carmine market and is likely to continue its dominance during the forthcoming years. This can be attributed to the rising usage of indigo carmine as a food coloring agent in a wide range of beverages.
On the other hand, the bakery, snacks, and cereals segment is expected to accelerate with a CAGR of 4% through the course of the assessment period.
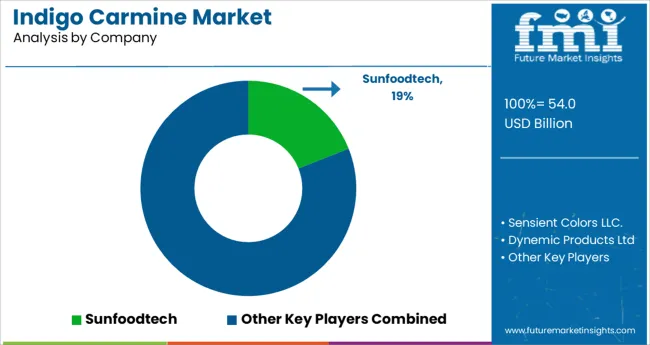
Many regional market players contribute to the global Indigo Carmine market. Indigo carmine firms have been working on improving their miscibility to attract end-user industries and consumers. Some of the prominent players identified in the global Indigo Carmine market include Sensient Colors LLC, Tianjin Baishi Chemical Co., Ltd., Asim Products, Sunfoodtech, Beijing Hengye Zhongyuan Chemical Co., Ltd. GNT International B.V., GFS Chemicals Inc, Dynamic Products Ltd., Sigma-Aldrich Co. LLC., Shanghai Dyestuffs Research Institute Co. Ltd., and TNC Chemicals Philippines Incorporated.
| Attributes | Details |
|---|---|
| Anticipated Growth Rate (2025 to 2035) | 4.8% |
| Estimated Market Size (2025) | USD 46.9 Million |
| Projected Market Size (2035) | USD 77.4 Million |
| Forecast Period | 2025 to 2035 |
| Historical Data Available for | 2020 to 2024 |
| Market Analysis | million for Value and MT for Volume |
| Key Regions Covered | North America; Latin America; Europe; Middle East and Africa; and India; Asia Pacific |
| Key Countries Covered | USA, Canada, Mexico, Brazil, Peru, Argentina, UK, China, India, Japan, Germany, Italy, France, South Africa, South Korea, Australia, and GCC Countries |
| Key Segments Covered | Type, Application, and Region |
| Key Companies Profiled | Sunfoodtech; Sensient Colors LLC.; Dynamic Products Ltd; Chinasun Specialty Products Co., Ltd; Tianjin Baishi Chemical Co., Ltd.; Beijing Hengye Zhongyuan Chemical Co., Ltd.; Wenzhou Dongsheng Chemical Reagent Factory; Shanghai Baiyan Industrial Co., Ltd.; Emco Dyestuff Private Limited; Denim Colourchem Pvt Ltd; Neelikon Food Dyes & Chemicals Ltd; Kelco Chemicals Co., Ltd.; Dintech Chemical Co., Ltd.; Gogia Chemical Industries Pvt. Ltd.; Asim Products; Others |
| Report Coverage | Market Forecast, Drivers, Restraints, Opportunities and Threats Analysis, Company Share Analysis, Competition Intelligence, Market Dynamics and Challenges, and Strategic Growth Initiatives |
The global indigo carmine market is estimated to be valued at USD 54.0 billion in 2025.
It is projected to reach USD 86.3 billion by 2035.
The market is expected to grow at a 4.8% CAGR between 2025 and 2035.
The key product types are type i, type ii and type iii.
candy/ confectionery segment is expected to dominate with a 20.8% industry share in 2025.


Full Research Suite comprises of:
Market outlook & trends analysis
Interviews & case studies
Strategic recommendations
Vendor profiles & capabilities analysis
5-year forecasts
8 regions and 60+ country-level data splits
Market segment data splits
12 months of continuous data updates
DELIVERED AS:
PDF EXCEL ONLINE
Carmine Color Market Size and Share Forecast Outlook 2025 to 2035
Carmine Market Size and Share Forecast Outlook 2025 to 2035
Carmine Alternatives Market Size and Share Forecast Outlook 2025 to 2035

Thank you!
You will receive an email from our Business Development Manager. Please be sure to check your SPAM/JUNK folder too.
Chat With
MaRIA