Carmine Color Market
Carmine Color Market by Nature, Application & Region | Forecast 2023 to 2033
The increased popularity of Natural Color in the Food and Beverages Industry along with the Wide Range of Applications helps the Carmine Color Market thrive. FMI Taps the Data
Carmine Color Market Outlook (2023 to 2033)
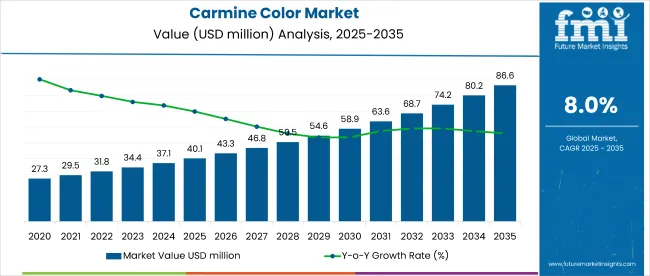
The carmine color market is expected to expand its roots at a steady CAGR of 8.0% during the forecast period. The market is likely to hold a revenue of US$ 37 million in 2023 while it is anticipated to cross a value of US$ 78.7 million by 2033.
The research report on the carmine color market states that the long range of applications includes food and beverages, pharmaceuticals, chemistry, and other artificial products. Majorly used in meat products and seafood, carmine is also used in alcoholic and non-alcoholic drinks as a colorant. Furthermore, the restored food and beverages industry along with the expanding pharmaceutical and biotechnology sector is expected to have a strong positive impact on the market. Obtained from cochineal (a red dyestuff extracted through dead female scale insects), carmine color has been a successful colorant when it comes to acting as an additive in cosmetics, specifically relating to eye makeup. This long range of applications has made the market dynamic and transformative. The different formations and concentrations of carmine such as water-soluble carmine liquid carmine, lacquer carmine, and oil-soluble carmine have different applications. The rapidly rising food export is also flourishing the demand for carmine color.
Carmine color market analysis explains that the advanced extracting techniques coupled with the high demand for liquor and other beverages carrying natural colors are flourishing the market growth. Alongside this, the great staining power of carmine color makes it an exclusive option for coloring artificial flowers and other cosmetic products. Moreover, the carmine lake is used in a wide variety of food applications due to its excellent light and temperature stability. Apart from these, carmine powder and liquid have other applications. The new and innovative business ideas and growing awareness around natural colors are pushing companies to adopt the carmine color as an option.
Attributes | Details |
---|---|
Carmine Color Market CAGR (2023 to 2033) | 8.0% |
Carmine Color Market Size (2023) | US$ 37 million |
Carmine Color Market Size (2033) | US$ 78.7 million |
Don't pay for what you don't need
Customize your report by selecting specific countries or regions and save 30%!
How is the Future Outlook (2023 to 2033) for Carmine Color Market in Comparison to the Historical Pattern (2018 to 2022)?
Short-term Growth (2023 to 2026): The expanding food and beverage chains along with the application of carmine in soft drinks, cider vinegar, yogurt, baked goods, and dairy products are fuelling the market growth. Furthermore, the higher demand for convenient food and seasoning is also pushing manufacturers to adopt the carmine color. With these wide ranges of applications, the market is expected to hold US$ 37 million in 2023 while it is anticipated to reach US$ 46.61 million by 2026.
Mid-term Growth (2026 to 2029): The higher penetration of sustainability in the food and beverage industry coupled with increasing health consciousness among end users is expected to garner market growth during this period. Alongside this, the use of carmine colorant in enhancing the food aesthetic is likely to contribute to the market’s upward trajectory. This takes a market value from US$ 46.61 million in 2026 to a value of US$ 60.40 million in 2029.
Long-term Growth (2029 to 2033): The transformative carmine color market is yet to expand at its fullest. This period is likely to witness that as the demand for organic additives is expected to rise. Thus, the market is anticipated to thrive at a slightly lower CAGR of 8.0% between 2023 and 2033.
What Growth Drivers Flourish in the Market?
The rapidly growing drugs and cosmetics industry along with the restored food and beverage industry is flourishing the demand for the carmine color market. Furthermore, the increasing demand for fun food and enhanced supply chains have contributed to the market growth.
The organic carmine color options based on solubility are targeting different verticals including confectioneries and innovative food spaces are garnering market growth. High-quality, natural, and organic food options are flourishing in market growth. Alongside this, natural colors such as carmine enhance the appearance of food products.
These colors are used in bakery and confectionery items for aesthetic or artistic purposes, and they improve the quality and extend the shelf life of bakery and confectionery products. The sales of carmine are getting fueled through the higher sales of packaged food and certain medicines.
What are the Major Restraints in the Carmine Color Market?
Some of the major restraints for the carmine color market are the vegan and animal rights movements as the color is extracted through the killing of certain female bugs. The frequent approvals and ban of color in certain regions are also limiting the growth rate of the market. For example, food manufacturers who are offering halal and kosher certification on their products are avoiding the use of carmine color in their products. Companies launching carmine color alternatives in the market are also affecting the market adversely.
Comparative View
Carmine Color Market:
Attributes | Carmine Color Market |
---|---|
CAGR (2023 to 2033) | 8.0% |
Market Value (2033) | US$ 78.7 million |
Growth Factor | The higher demand for natural colors in food and beverages, meat and seafood, and confectionery food products are collectively increasing the demand for carmine color. |
Opportunity | Various solubility types of carmine and its usage in the pharmaceutical and biotechnology industry as a vitamin and acid source are also creating new opportunities for the market. |
Key Trends | The extended research and development programs and innovative food aesthetic experiments set up the growth trends for the market. |
Annatto Food Colors Market:
Attributes | Annatto Food Colors Market |
---|---|
CAGR (2023 to 2033) | 6.0% |
Market Value (2033) | US$ 383.72 million |
Growth Factor | The restoration of the food and beverages industry along with the enhanced aesthetics and coloring in meat and poultry products are expected to flourish the demand for annatto food colors across the regions. |
Opportunity | The increased demand for organic and natural food colors along with the increased health awareness and wide range of industries covered by the market is bringing new opportunities for the market. |
Key Trends | The increased demand for clean-label products along with the increasing focus on healthy lifestyles is setting up growth trends. |
Natural Food Colors Market:
Attributes | Natural Food Colors Market |
---|---|
CAGR (2023 to 2033) | 7.2% |
Market Value (2033) | US$ 3.3 billion |
Growth Factor | The higher demand for anthocyanins and other natural colors along with the higher food and beverages industry consumption is garnering the market growth. |
Opportunity | The increased number of food brands that claim to use natural colors and flavors for their food items is creating new opportunities for the market. |
Key Trends | Rising awareness of the potential adverse effects of synthetic food colors is setting up growth trends for the market. |
Get the data you need at a Fraction of the cost
Personalize your report by choosing insights you need
and save 40%!
Country-wise Insights
Region/Country | Revenue Share % (2022) |
---|---|
United States | 35.7% |
Germany | 5.1% |
Japan | 6.5% |
Australia | 4.2% |
Why is the United States Considered a Carmine Color Market Leader?
Increasing Demand from the Bakery & Confectionery Sector is Boosting Sales of Red Carmine Color
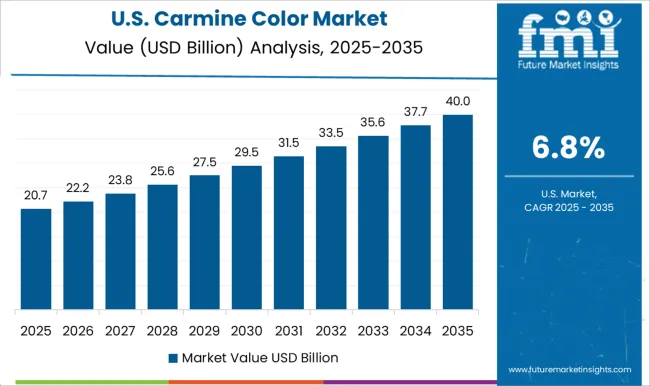
The United States carmine color market leads in terms of market share in the North American region. The region is expected to hold a market share of 26.1% in 2023. The regional growth is attributed to the increasing consumption and sales of processed foods in the region
Rapidly rising per capita income and enhanced lifestyle are also pushing end users to add natural and organic food products to their diets. This is compelling manufacturers to use organic ingredients in processed food products, which in turn is spurring demand for natural colors and flavors.
How does India perform in the Market?
Growing Demand for Ready-to-eat Food Packages along with Rising Food Innovation is garnering the Regional Growth
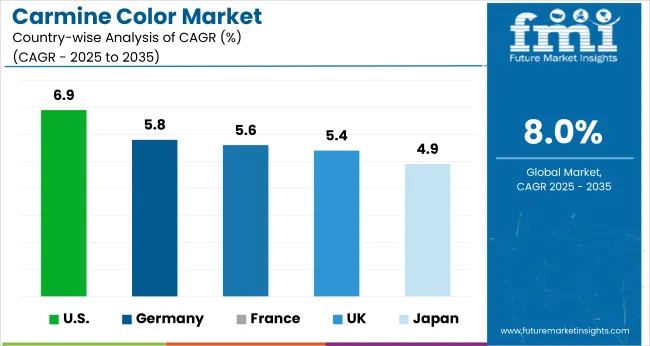
The Indian carmine color market thrives at a CAGR of 10.8% between 2023 and 2033. Though the market held a share of US$ 1.1 million in 2022. The ongoing growth trajectory is attributed to the transformed consumer preference for high-quality food products. This is flourishing the sales of natural ingredients in the region. International manufacturers and producers are investing in research and development to create distinctive and innovative high-quality products. Furthermore, cutting-edge food technology is expected to maintain high-quality standards. The increasing number of confectioneries and nonvegetarians in the country is also helping the market thrive in the region.
What makes Germany another significant market for Carmine Color Market?
Increasing Preference for Organic Pet Food is expected to fuel the Carmine Color Sales
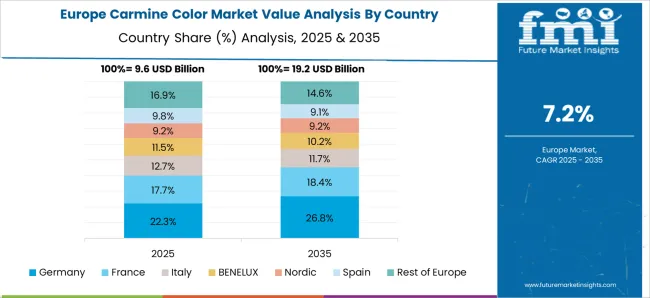
The German market held a market share of 5.1% in 2022. The growth is attributed to the increasing pet ownership that has led to high demand for premium pet food. Consumers are willing to pay extra to provide their pets with the highest quality food. Also, the health consciousness among people around natural and organic colors is fueling the demand for carmine colors in the region.
Category-Wise Landscape
Category | By Nature |
---|---|
Leading Segment | Conventional |
Market Share (2022) | 90.8% |
Category | By Application |
---|---|
Leading Segment | Meat, Poultry, Fish, and Eggs |
Market Share (2022) | 24.8% |
Higher Affordability and Increased Consumption is Flourishing the demand for Conventional Nature Type
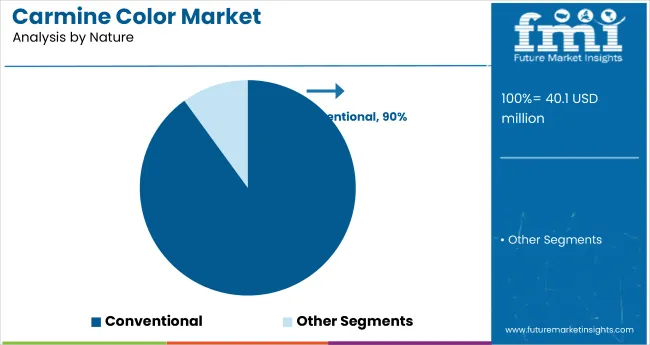
Based on nature type, conventional lead as it held a major market share of 90.8% in 2022. The growth of this segment is due to cheaper prices and higher consumption. The segment is expected to reach US$ 70.5 million by 2032. The segment is used as a dye for summer wear clothes printing along with other food-based applications.
Growing Preference for Semi-Synthetic Lipids due to the Higher Consumption
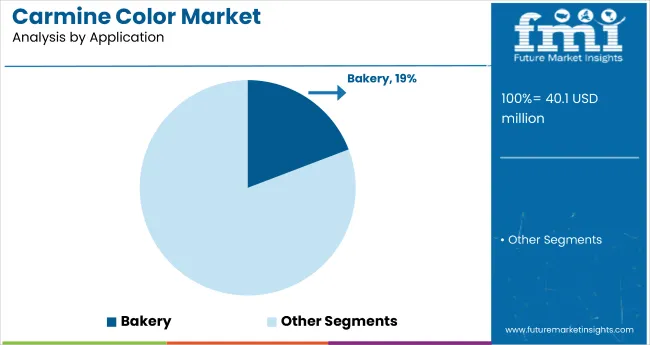
Based on application, the meat, poultry, fish, and eggs segment lead as it held a market share of 24.8% in 2022. The growth is attributed to the higher consumption as carmine color is used in meat casings, egg & egg substitutes, fish/seafood, jerky, meat substitute, and processed meat & poultry.
Competition Scenario
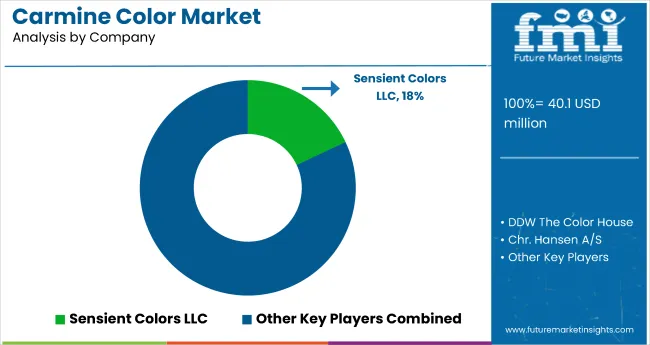
The key players in the market focus on providing 100% natural carmine color. Alongside this, the research and development of color and its different versions for various applications are also elements that key companies focus on. Leading players operating in the carmine color market are investing in the expansion of production facilities to cater to a growing consumer pool.
How can Carmine Color Vendors Providers Scale their Businesses in the Market?
Market players in the market are working on three major strategies.
- Key players focus on marketing their products as highly natural and organic products.
- Producing application and consumer-relevant carmine colors.
- The companies also collaborate and merge to expand their color portfolio.
Market Developments
- DuPont Natural Colors, which has been a part of DuPont's Nutrition & Biosciences group, is now acquired by DDW. The acquisition is expected to enable DDW, which is a manufacturer of natural color solutions for the food and beverage industry, to increase its global presence while also providing technical and manufacturing capabilities.
- DDW The Color House has introduced a whole range of red colors that are extracted through beet, radish, elderberry, black carrot, and carmine
Key Players
- DDW The Color House
- Archer Daniels Midland Company
- McCormick & Company
- Chr.Hansen A/S
- Naturex S.A.
- Riken Vitamin Co., Ltd.
- Döhler Group
- Kalsec Inc.
- Sensient Colors LLC
- BioconColors
Key Segments Covered
By Nature:
- Organic
- Conventional
By Application:
- Beverage
- Bakery, Snacks, & Cereal
- Candy / Confectionery
- Dairy
- Fruit Preparations / Fillings
- Meat, Poultry, Fish, & Eggs
- Potatoes, Pasta, & Rice
- Sauces, Soups, & Dressings
- Seasonings
- Pet Food
Key Regions Covered
- North America
- UNITED STATES
- Canada
- Latin America
- Brazil
- Mexico
- Rest of Latin America
- Europe
- Germany
- United Kingdom
- France
- Spain
- Russia
- Rest of Europe
- Japan
- Asia Pacific Excluding Japan
- China
- India
- Malaysia
- Singapore
- Australia
- Rest of Asia Pacific Excluding Japan (APEJ)
- Middle East and Africa(MEA)
- GCC Countries
- Israel
- South Africa
- Rest of Middle East Asia (MEA)
Frequently Asked Questions
How Big is the Carmine Color Market?
The carmine color market size is valued at US$ 437 million in 2023.
What is the Growth Forecast for the Carmine Color Market?
The carmine color market is projected to thrive at 8.0% CAGR through 2033.
How Big will be the Carmine Color Market by 2033?
The carmine color market is predicted to surpass US$ 78.7 million by 2033.
What is the Leading Application in the Carmine Color Market?
The meat, poultry, fish, and eggs segment leads with an acquired 24.8% of the carmine color market share in 2022.
What was Japan’s Carmine Color Market Revenue Share in 2022?
Japan occupied 6.5% of the carmine color market revenue share in 2022.
Table of Content
1. Executive Summary | Carmine Color Market 1.1. Global Market Outlook 1.2. Demand-side Trends 1.3. Supply-side Trends 1.4. Technology Roadmap Analysis 1.5. Analysis and Recommendations 2. Market Overview 2.1. Market Coverage / Taxonomy 2.2. Market Definition / Scope / Limitations 3. Market Background 3.1. Market Dynamics 3.1.1. Drivers 3.1.2. Restraints 3.1.3. Opportunity 3.1.4. Trends 3.2. Scenario Forecast 3.2.1. Demand in Optimistic Scenario 3.2.2. Demand in Likely Scenario 3.2.3. Demand in Conservative Scenario 3.3. Opportunity Map Analysis 3.4. Product Life Cycle Analysis 3.5. Supply Chain Analysis 3.5.1. Supply Side Participants and their Roles 3.5.1.1. Producers 3.5.1.2. Mid-Level Participants (Traders/ Agents/ Brokers) 3.5.1.3. Wholesalers and Distributors 3.5.2. Value Added and Value Created at Node in the Supply Chain 3.5.3. List of Raw Material Suppliers 3.5.4. List of Existing and Potential Buyers 3.6. Investment Feasibility Matrix 3.7. Value Chain Analysis 3.7.1. Profit Margin Analysis 3.7.2. Wholesalers and Distributors 3.7.3. Retailers 3.8. PESTLE and Porter’s Analysis 3.9. Regulatory Landscape 3.9.1. By Key Regions 3.9.2. By Key Countries 3.10. Regional Parent Market Outlook 3.11. Production and Consumption Statistics 3.12. Import and Export Statistics 4. Global Market Analysis 2018 to 2022 and Forecast, 2023 to 2033 4.1. Historical Market Size Value (US$ Million) & Volume (MT) Analysis, 2018 to 2022 4.2. Current and Future Market Size Value (US$ Million) & Volume (MT) Projections, 2023 to 2033 4.2.1. Y-o-Y Growth Trend Analysis 4.2.2. Absolute $ Opportunity Analysis 5. Global Market Analysis 2018 to 2022 and Forecast 2023 to 2033, By Nature 5.1. Introduction / Key Findings 5.2. Historical Market Size Value (US$ Million) & Volume (MT) Analysis By Nature, 2018 to 2022 5.3. Current and Future Market Size Value (US$ Million) & Volume (MT) Analysis and Forecast By Nature, 2023 to 2033 5.3.1. Organic 5.3.2. Conventional 5.4. Y-o-Y Growth Trend Analysis By Nature, 2018 to 2022 5.5. Absolute $ Opportunity Analysis By Nature, 2023 to 2033 6. Global Market Analysis 2018 to 2022 and Forecast 2023 to 2033, By Application 6.1. Introduction / Key Findings 6.2. Historical Market Size Value (US$ Million) & Volume (MT) Analysis By Application, 2018 to 2022 6.3. Current and Future Market Size Value (US$ Million) & Volume (MT) Analysis and Forecast By Application, 2023 to 2033 6.3.1. Beverage 6.3.2. Bakery 6.3.3. Snacks 6.3.4. Cereal 6.3.5. Candy 6.3.6. Dairy 6.3.7. Fruit Preparations 6.3.8. Meat 6.3.9. Poultry 6.3.10. others 6.4. Y-o-Y Growth Trend Analysis By Application, 2018 to 2022 6.5. Absolute $ Opportunity Analysis By Application, 2023 to 2033 7. Global Market Analysis 2018 to 2022 and Forecast 2023 to 2033, By Region 7.1. Introduction 7.2. Historical Market Size Value (US$ Million) & Volume (MT) Analysis By Region, 2018 to 2022 7.3. Current Market Size Value (US$ Million) & Volume (MT) Analysis and Forecast By Region, 2023 to 2033 7.3.1. North America 7.3.2. Latin America 7.3.3. Europe 7.3.4. Asia Pacific 7.3.5. Middle East and Africa(MEA) 7.4. Market Attractiveness Analysis By Region 8. North America Market Analysis 2018 to 2022 and Forecast 2023 to 2033, By Country 8.1. Historical Market Size Value (US$ Million) & Volume (MT) Trend Analysis By Market Taxonomy, 2018 to 2022 8.2. Market Size Value (US$ Million) & Volume (MT) Forecast By Market Taxonomy, 2023 to 2033 8.2.1. By Country 8.2.1.1. The USA 8.2.1.2. Canada 8.2.2. By Nature 8.2.3. By Application 8.3. Market Attractiveness Analysis 8.3.1. By Country 8.3.2. By Nature 8.3.3. By Application 8.4. Key Takeaways 9. Latin America Market Analysis 2018 to 2022 and Forecast 2023 to 2033, By Country 9.1. Historical Market Size Value (US$ Million) & Volume (MT) Trend Analysis By Market Taxonomy, 2018 to 2022 9.2. Market Size Value (US$ Million) & Volume (MT) Forecast By Market Taxonomy, 2023 to 2033 9.2.1. By Country 9.2.1.1. Brazil 9.2.1.2. Mexico 9.2.1.3. Rest of Latin America 9.2.2. By Nature 9.2.3. By Application 9.3. Market Attractiveness Analysis 9.3.1. By Country 9.3.2. By Nature 9.3.3. By Application 9.4. Key Takeaways 10. Europe Market Analysis 2018 to 2022 and Forecast 2023 to 2033, By Country 10.1. Historical Market Size Value (US$ Million) & Volume (MT) Trend Analysis By Market Taxonomy, 2018 to 2022 10.2. Market Size Value (US$ Million) & Volume (MT) Forecast By Market Taxonomy, 2023 to 2033 10.2.1. By Country 10.2.1.1. Germany 10.2.1.2. United Kingdom 10.2.1.3. France 10.2.1.4. Spain 10.2.1.5. Italy 10.2.1.6. Rest of Europe 10.2.2. By Nature 10.2.3. By Application 10.3. Market Attractiveness Analysis 10.3.1. By Country 10.3.2. By Nature 10.3.3. By Application 10.4. Key Takeaways 11. Asia Pacific Market Analysis 2018 to 2022 and Forecast 2023 to 2033, By Country 11.1. Historical Market Size Value (US$ Million) & Volume (MT) Trend Analysis By Market Taxonomy, 2018 to 2022 11.2. Market Size Value (US$ Million) & Volume (MT) Forecast By Market Taxonomy, 2023 to 2033 11.2.1. By Country 11.2.1.1. China 11.2.1.2. Japan 11.2.1.3. South Korea 11.2.1.4. Singapore 11.2.1.5. Thailand 11.2.1.6. Indonesia 11.2.1.7. Australia 11.2.1.8. New Zealand 11.2.1.9. Rest of Asia Pacific 11.2.2. By Nature 11.2.3. By Application 11.3. Market Attractiveness Analysis 11.3.1. By Country 11.3.2. By Nature 11.3.3. By Application 11.4. Key Takeaways 12. MEA Market Analysis 2018 to 2022 and Forecast 2023 to 2033, By Country 12.1. Historical Market Size Value (US$ Million) & Volume (MT) Trend Analysis By Market Taxonomy, 2018 to 2022 12.2. Market Size Value (US$ Million) & Volume (MT) Forecast By Market Taxonomy, 2023 to 2033 12.2.1. By Country 12.2.1.1. GCC Countries 12.2.1.2. South Africa 12.2.1.3. Israel 12.2.1.4. Rest of Middle East and Africa(MEA) 12.2.2. By Nature 12.2.3. By Application 12.3. Market Attractiveness Analysis 12.3.1. By Country 12.3.2. By Nature 12.3.3. By Application 12.4. Key Takeaways 13. Key Countries Market Analysis 13.1. USA 13.1.1. Pricing Analysis 13.1.2. Market Share Analysis, 2022 13.1.2.1. By Nature 13.1.2.2. By Application 13.2. Canada 13.2.1. Pricing Analysis 13.2.2. Market Share Analysis, 2022 13.2.2.1. By Nature 13.2.2.2. By Application 13.3. Brazil 13.3.1. Pricing Analysis 13.3.2. Market Share Analysis, 2022 13.3.2.1. By Nature 13.3.2.2. By Application 13.4. Mexico 13.4.1. Pricing Analysis 13.4.2. Market Share Analysis, 2022 13.4.2.1. By Nature 13.4.2.2. By Application 13.5. Germany 13.5.1. Pricing Analysis 13.5.2. Market Share Analysis, 2022 13.5.2.1. By Nature 13.5.2.2. By Application 13.6. United Kingdom 13.6.1. Pricing Analysis 13.6.2. Market Share Analysis, 2022 13.6.2.1. By Nature 13.6.2.2. By Application 13.7. France 13.7.1. Pricing Analysis 13.7.2. Market Share Analysis, 2022 13.7.2.1. By Nature 13.7.2.2. By Application 13.8. Spain 13.8.1. Pricing Analysis 13.8.2. Market Share Analysis, 2022 13.8.2.1. By Nature 13.8.2.2. By Application 13.9. Italy 13.9.1. Pricing Analysis 13.9.2. Market Share Analysis, 2022 13.9.2.1. By Nature 13.9.2.2. By Application 13.10. China 13.10.1. Pricing Analysis 13.10.2. Market Share Analysis, 2022 13.10.2.1. By Nature 13.10.2.2. By Application 13.11. Japan 13.11.1. Pricing Analysis 13.11.2. Market Share Analysis, 2022 13.11.2.1. By Nature 13.11.2.2. By Application 13.12. South Korea 13.12.1. Pricing Analysis 13.12.2. Market Share Analysis, 2022 13.12.2.1. By Nature 13.12.2.2. By Application 13.13. Singapore 13.13.1. Pricing Analysis 13.13.2. Market Share Analysis, 2022 13.13.2.1. By Nature 13.13.2.2. By Application 13.14. Thailand 13.14.1. Pricing Analysis 13.14.2. Market Share Analysis, 2022 13.14.2.1. By Nature 13.14.2.2. By Application 13.15. Indonesia 13.15.1. Pricing Analysis 13.15.2. Market Share Analysis, 2022 13.15.2.1. By Nature 13.15.2.2. By Application 13.16. Australia 13.16.1. Pricing Analysis 13.16.2. Market Share Analysis, 2022 13.16.2.1. By Nature 13.16.2.2. By Application 13.17. New Zealand 13.17.1. Pricing Analysis 13.17.2. Market Share Analysis, 2022 13.17.2.1. By Nature 13.17.2.2. By Application 13.18. GCC Countries 13.18.1. Pricing Analysis 13.18.2. Market Share Analysis, 2022 13.18.2.1. By Nature 13.18.2.2. By Application 13.19. South Africa 13.19.1. Pricing Analysis 13.19.2. Market Share Analysis, 2022 13.19.2.1. By Nature 13.19.2.2. By Application 13.20. Israel 13.20.1. Pricing Analysis 13.20.2. Market Share Analysis, 2022 13.20.2.1. By Nature 13.20.2.2. By Application 14. Market Structure Analysis 14.1. Competition Dashboard 14.2. Competition Benchmarking 14.3. Market Share Analysis of Top Players 14.3.1. By Regional 14.3.2. By Nature 14.3.3. By Application 15. Competition Analysis 15.1. Competition Deep Dive 15.1.1. DDW The Color House 15.1.1.1. Overview 15.1.1.2. Product Portfolio 15.1.1.3. Profitability by Market Segments 15.1.1.4. Sales Footprint 15.1.1.5. Strategy Overview 15.1.1.5.1. Marketing Strategy 15.1.1.5.2. Product Strategy 15.1.1.5.3. Channel Strategy 15.1.2. Archer Daniels Midland Company 15.1.2.1. Overview 15.1.2.2. Product Portfolio 15.1.2.3. Profitability by Market Segments 15.1.2.4. Sales Footprint 15.1.2.5. Strategy Overview 15.1.2.5.1. Marketing Strategy 15.1.2.5.2. Product Strategy 15.1.2.5.3. Channel Strategy 15.1.3. McCormick & Company 15.1.3.1. Overview 15.1.3.2. Product Portfolio 15.1.3.3. Profitability by Market Segments 15.1.3.4. Sales Footprint 15.1.3.5. Strategy Overview 15.1.3.5.1. Marketing Strategy 15.1.3.5.2. Product Strategy 15.1.3.5.3. Channel Strategy 15.1.4. Chr.Hansen A/S 15.1.4.1. Overview 15.1.4.2. Product Portfolio 15.1.4.3. Profitability by Market Segments 15.1.4.4. Sales Footprint 15.1.4.5. Strategy Overview 15.1.4.5.1. Marketing Strategy 15.1.4.5.2. Product Strategy 15.1.4.5.3. Channel Strategy 15.1.5. Naturex S.A. 15.1.5.1. Overview 15.1.5.2. Product Portfolio 15.1.5.3. Profitability by Market Segments 15.1.5.4. Sales Footprint 15.1.5.5. Strategy Overview 15.1.5.5.1. Marketing Strategy 15.1.5.5.2. Product Strategy 15.1.5.5.3. Channel Strategy 15.1.6. Riken Vitamin Co., Ltd. 15.1.6.1. Overview 15.1.6.2. Product Portfolio 15.1.6.3. Profitability by Market Segments 15.1.6.4. Sales Footprint 15.1.6.5. Strategy Overview 15.1.6.5.1. Marketing Strategy 15.1.6.5.2. Product Strategy 15.1.6.5.3. Channel Strategy 15.1.7. Döhler Group 15.1.7.1. Overview 15.1.7.2. Product Portfolio 15.1.7.3. Profitability by Market Segments 15.1.7.4. Sales Footprint 15.1.7.5. Strategy Overview 15.1.7.5.1. Marketing Strategy 15.1.7.5.2. Product Strategy 15.1.7.5.3. Channel Strategy 15.1.8. Kalsec Inc. 15.1.8.1. Overview 15.1.8.2. Product Portfolio 15.1.8.3. Profitability by Market Segments 15.1.8.4. Sales Footprint 15.1.8.5. Strategy Overview 15.1.8.5.1. Marketing Strategy 15.1.8.5.2. Product Strategy 15.1.8.5.3. Channel Strategy 15.1.9. Sensient Colors LLC 15.1.9.1. Overview 15.1.9.2. Product Portfolio 15.1.9.3. Profitability by Market Segments 15.1.9.4. Sales Footprint 15.1.9.5. Strategy Overview 15.1.9.5.1. Marketing Strategy 15.1.9.5.2. Product Strategy 15.1.9.5.3. Channel Strategy 15.1.10. BioconColors 15.1.10.1. Overview 15.1.10.2. Product Portfolio 15.1.10.3. Profitability by Market Segments 15.1.10.4. Sales Footprint 15.1.10.5. Strategy Overview 15.1.10.5.1. Marketing Strategy 15.1.10.5.2. Product Strategy 15.1.10.5.3. Channel Strategy 16. Assumptions & Acronyms Used 17. Research Methodology
Don't pay for what you don't need
Customize your report by selecting specific countries or regions and save 30%!
List of Tables
Table 1: Global Market Value (US$ Million) Forecast by Region, 2018 to 2033 Table 2: Global Market Volume (MT) Forecast by Region, 2018 to 2033 Table 3: Global Market Value (US$ Million) Forecast by Nature, 2018 to 2033 Table 4: Global Market Volume (MT) Forecast by Nature, 2018 to 2033 Table 5: Global Market Value (US$ Million) Forecast by Application, 2018 to 2033 Table 6: Global Market Volume (MT) Forecast by Application, 2018 to 2033 Table 7: North America Market Value (US$ Million) Forecast by Country, 2018 to 2033 Table 8: North America Market Volume (MT) Forecast by Country, 2018 to 2033 Table 9: North America Market Value (US$ Million) Forecast by Nature, 2018 to 2033 Table 10: North America Market Volume (MT) Forecast by Nature, 2018 to 2033 Table 11: North America Market Value (US$ Million) Forecast by Application, 2018 to 2033 Table 12: North America Market Volume (MT) Forecast by Application, 2018 to 2033 Table 13: Latin America Market Value (US$ Million) Forecast by Country, 2018 to 2033 Table 14: Latin America Market Volume (MT) Forecast by Country, 2018 to 2033 Table 15: Latin America Market Value (US$ Million) Forecast by Nature, 2018 to 2033 Table 16: Latin America Market Volume (MT) Forecast by Nature, 2018 to 2033 Table 17: Latin America Market Value (US$ Million) Forecast by Application, 2018 to 2033 Table 18: Latin America Market Volume (MT) Forecast by Application, 2018 to 2033 Table 19: Europe Market Value (US$ Million) Forecast by Country, 2018 to 2033 Table 20: Europe Market Volume (MT) Forecast by Country, 2018 to 2033 Table 21: Europe Market Value (US$ Million) Forecast by Nature, 2018 to 2033 Table 22: Europe Market Volume (MT) Forecast by Nature, 2018 to 2033 Table 23: Europe Market Value (US$ Million) Forecast by Application, 2018 to 2033 Table 24: Europe Market Volume (MT) Forecast by Application, 2018 to 2033 Table 25: Asia Pacific Market Value (US$ Million) Forecast by Country, 2018 to 2033 Table 26: Asia Pacific Market Volume (MT) Forecast by Country, 2018 to 2033 Table 27: Asia Pacific Market Value (US$ Million) Forecast by Nature, 2018 to 2033 Table 28: Asia Pacific Market Volume (MT) Forecast by Nature, 2018 to 2033 Table 29: Asia Pacific Market Value (US$ Million) Forecast by Application, 2018 to 2033 Table 30: Asia Pacific Market Volume (MT) Forecast by Application, 2018 to 2033 Table 31: MEA Market Value (US$ Million) Forecast by Country, 2018 to 2033 Table 32: MEA Market Volume (MT) Forecast by Country, 2018 to 2033 Table 33: MEA Market Value (US$ Million) Forecast by Nature, 2018 to 2033 Table 34: MEA Market Volume (MT) Forecast by Nature, 2018 to 2033 Table 35: MEA Market Value (US$ Million) Forecast by Application, 2018 to 2033 Table 36: MEA Market Volume (MT) Forecast by Application, 2018 to 2033
List of Charts
Figure 1: Global Market Value (US$ Million) by Nature, 2023 to 2033 Figure 2: Global Market Value (US$ Million) by Application, 2023 to 2033 Figure 3: Global Market Value (US$ Million) by Region, 2023 to 2033 Figure 4: Global Market Value (US$ Million) Analysis by Region, 2018 to 2033 Figure 5: Global Market Volume (MT) Analysis by Region, 2018 to 2033 Figure 6: Global Market Value Share (%) and BPS Analysis by Region, 2023 to 2033 Figure 7: Global Market Y-o-Y Growth (%) Projections by Region, 2023 to 2033 Figure 8: Global Market Value (US$ Million) Analysis by Nature, 2018 to 2033 Figure 9: Global Market Volume (MT) Analysis by Nature, 2018 to 2033 Figure 10: Global Market Value Share (%) and BPS Analysis by Nature, 2023 to 2033 Figure 11: Global Market Y-o-Y Growth (%) Projections by Nature, 2023 to 2033 Figure 12: Global Market Value (US$ Million) Analysis by Application, 2018 to 2033 Figure 13: Global Market Volume (MT) Analysis by Application, 2018 to 2033 Figure 14: Global Market Value Share (%) and BPS Analysis by Application, 2023 to 2033 Figure 15: Global Market Y-o-Y Growth (%) Projections by Application, 2023 to 2033 Figure 16: Global Market Attractiveness by Nature, 2023 to 2033 Figure 17: Global Market Attractiveness by Application, 2023 to 2033 Figure 18: Global Market Attractiveness by Region, 2023 to 2033 Figure 19: North America Market Value (US$ Million) by Nature, 2023 to 2033 Figure 20: North America Market Value (US$ Million) by Application, 2023 to 2033 Figure 21: North America Market Value (US$ Million) by Country, 2023 to 2033 Figure 22: North America Market Value (US$ Million) Analysis by Country, 2018 to 2033 Figure 23: North America Market Volume (MT) Analysis by Country, 2018 to 2033 Figure 24: North America Market Value Share (%) and BPS Analysis by Country, 2023 to 2033 Figure 25: North America Market Y-o-Y Growth (%) Projections by Country, 2023 to 2033 Figure 26: North America Market Value (US$ Million) Analysis by Nature, 2018 to 2033 Figure 27: North America Market Volume (MT) Analysis by Nature, 2018 to 2033 Figure 28: North America Market Value Share (%) and BPS Analysis by Nature, 2023 to 2033 Figure 29: North America Market Y-o-Y Growth (%) Projections by Nature, 2023 to 2033 Figure 30: North America Market Value (US$ Million) Analysis by Application, 2018 to 2033 Figure 31: North America Market Volume (MT) Analysis by Application, 2018 to 2033 Figure 32: North America Market Value Share (%) and BPS Analysis by Application, 2023 to 2033 Figure 33: North America Market Y-o-Y Growth (%) Projections by Application, 2023 to 2033 Figure 34: North America Market Attractiveness by Nature, 2023 to 2033 Figure 35: North America Market Attractiveness by Application, 2023 to 2033 Figure 36: North America Market Attractiveness by Country, 2023 to 2033 Figure 37: Latin America Market Value (US$ Million) by Nature, 2023 to 2033 Figure 38: Latin America Market Value (US$ Million) by Application, 2023 to 2033 Figure 39: Latin America Market Value (US$ Million) by Country, 2023 to 2033 Figure 40: Latin America Market Value (US$ Million) Analysis by Country, 2018 to 2033 Figure 41: Latin America Market Volume (MT) Analysis by Country, 2018 to 2033 Figure 42: Latin America Market Value Share (%) and BPS Analysis by Country, 2023 to 2033 Figure 43: Latin America Market Y-o-Y Growth (%) Projections by Country, 2023 to 2033 Figure 44: Latin America Market Value (US$ Million) Analysis by Nature, 2018 to 2033 Figure 45: Latin America Market Volume (MT) Analysis by Nature, 2018 to 2033 Figure 46: Latin America Market Value Share (%) and BPS Analysis by Nature, 2023 to 2033 Figure 47: Latin America Market Y-o-Y Growth (%) Projections by Nature, 2023 to 2033 Figure 48: Latin America Market Value (US$ Million) Analysis by Application, 2018 to 2033 Figure 49: Latin America Market Volume (MT) Analysis by Application, 2018 to 2033 Figure 50: Latin America Market Value Share (%) and BPS Analysis by Application, 2023 to 2033 Figure 51: Latin America Market Y-o-Y Growth (%) Projections by Application, 2023 to 2033 Figure 52: Latin America Market Attractiveness by Nature, 2023 to 2033 Figure 53: Latin America Market Attractiveness by Application, 2023 to 2033 Figure 54: Latin America Market Attractiveness by Country, 2023 to 2033 Figure 55: Europe Market Value (US$ Million) by Nature, 2023 to 2033 Figure 56: Europe Market Value (US$ Million) by Application, 2023 to 2033 Figure 57: Europe Market Value (US$ Million) by Country, 2023 to 2033 Figure 58: Europe Market Value (US$ Million) Analysis by Country, 2018 to 2033 Figure 59: Europe Market Volume (MT) Analysis by Country, 2018 to 2033 Figure 60: Europe Market Value Share (%) and BPS Analysis by Country, 2023 to 2033 Figure 61: Europe Market Y-o-Y Growth (%) Projections by Country, 2023 to 2033 Figure 62: Europe Market Value (US$ Million) Analysis by Nature, 2018 to 2033 Figure 63: Europe Market Volume (MT) Analysis by Nature, 2018 to 2033 Figure 64: Europe Market Value Share (%) and BPS Analysis by Nature, 2023 to 2033 Figure 65: Europe Market Y-o-Y Growth (%) Projections by Nature, 2023 to 2033 Figure 66: Europe Market Value (US$ Million) Analysis by Application, 2018 to 2033 Figure 67: Europe Market Volume (MT) Analysis by Application, 2018 to 2033 Figure 68: Europe Market Value Share (%) and BPS Analysis by Application, 2023 to 2033 Figure 69: Europe Market Y-o-Y Growth (%) Projections by Application, 2023 to 2033 Figure 70: Europe Market Attractiveness by Nature, 2023 to 2033 Figure 71: Europe Market Attractiveness by Application, 2023 to 2033 Figure 72: Europe Market Attractiveness by Country, 2023 to 2033 Figure 73: Asia Pacific Market Value (US$ Million) by Nature, 2023 to 2033 Figure 74: Asia Pacific Market Value (US$ Million) by Application, 2023 to 2033 Figure 75: Asia Pacific Market Value (US$ Million) by Country, 2023 to 2033 Figure 76: Asia Pacific Market Value (US$ Million) Analysis by Country, 2018 to 2033 Figure 77: Asia Pacific Market Volume (MT) Analysis by Country, 2018 to 2033 Figure 78: Asia Pacific Market Value Share (%) and BPS Analysis by Country, 2023 to 2033 Figure 79: Asia Pacific Market Y-o-Y Growth (%) Projections by Country, 2023 to 2033 Figure 80: Asia Pacific Market Value (US$ Million) Analysis by Nature, 2018 to 2033 Figure 81: Asia Pacific Market Volume (MT) Analysis by Nature, 2018 to 2033 Figure 82: Asia Pacific Market Value Share (%) and BPS Analysis by Nature, 2023 to 2033 Figure 83: Asia Pacific Market Y-o-Y Growth (%) Projections by Nature, 2023 to 2033 Figure 84: Asia Pacific Market Value (US$ Million) Analysis by Application, 2018 to 2033 Figure 85: Asia Pacific Market Volume (MT) Analysis by Application, 2018 to 2033 Figure 86: Asia Pacific Market Value Share (%) and BPS Analysis by Application, 2023 to 2033 Figure 87: Asia Pacific Market Y-o-Y Growth (%) Projections by Application, 2023 to 2033 Figure 88: Asia Pacific Market Attractiveness by Nature, 2023 to 2033 Figure 89: Asia Pacific Market Attractiveness by Application, 2023 to 2033 Figure 90: Asia Pacific Market Attractiveness by Country, 2023 to 2033 Figure 91: MEA Market Value (US$ Million) by Nature, 2023 to 2033 Figure 92: MEA Market Value (US$ Million) by Application, 2023 to 2033 Figure 93: MEA Market Value (US$ Million) by Country, 2023 to 2033 Figure 94: MEA Market Value (US$ Million) Analysis by Country, 2018 to 2033 Figure 95: MEA Market Volume (MT) Analysis by Country, 2018 to 2033 Figure 96: MEA Market Value Share (%) and BPS Analysis by Country, 2023 to 2033 Figure 97: MEA Market Y-o-Y Growth (%) Projections by Country, 2023 to 2033 Figure 98: MEA Market Value (US$ Million) Analysis by Nature, 2018 to 2033 Figure 99: MEA Market Volume (MT) Analysis by Nature, 2018 to 2033 Figure 100: MEA Market Value Share (%) and BPS Analysis by Nature, 2023 to 2033 Figure 101: MEA Market Y-o-Y Growth (%) Projections by Nature, 2023 to 2033 Figure 102: MEA Market Value (US$ Million) Analysis by Application, 2018 to 2033 Figure 103: MEA Market Volume (MT) Analysis by Application, 2018 to 2033 Figure 104: MEA Market Value Share (%) and BPS Analysis by Application, 2023 to 2033 Figure 105: MEA Market Y-o-Y Growth (%) Projections by Application, 2023 to 2033 Figure 106: MEA Market Attractiveness by Nature, 2023 to 2033 Figure 107: MEA Market Attractiveness by Application, 2023 to 2033 Figure 108: MEA Market Attractiveness by Country, 2023 to 2033
Recommendations
Explore Food and Beverage Insights
View Reports