
- Market Size (2026)
- USD 2.4 Bn
- Forecast (2036)
- USD 4.5 Bn
- CAGR (2026 to 2036)
- 6.5%
How big is the Kefir Market in 2026?
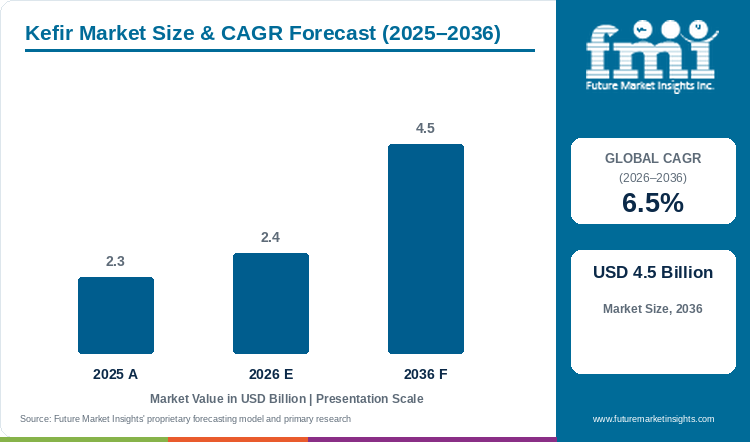
The Kefir Market is projected to reach USD 4.5 billion by 2036 from USD 2.4 billion in 2026, a CAGR of 6.5% over the period. The market was valued at USD 2.3 billion in 2025. Kefir is outgrowing drinking milk, which continues to contract in mature dairy markets. In Germany, sour milk and kefir production rose 5.7% in 2025 while drinking milk output fell 2.6%. Large dairy groups are following the same shift in demand, and Danone reported double-digit growth for its kefir ranges in Europe in the first half of 2026.
Growth differs because consumers buy kefir as a functional food and not as a commodity staple. The Dietary Guidelines for Americans 2025 to 2030 cite kefir among fermented foods that support a diverse gut microbiome. The clinical base is still developing. A 2026 review of 28 human trials found possible gut and metabolic benefits but judged the evidence limited because recipes and doses vary widely.
That evidence limit is the main constraint on growth, since it restricts the health claims brands can make. US labelling adds a second limit, as dairy products labelled healthy now face a strict cap on added sugar. Repeat purchase will therefore depend on mild taste, low added sugar and clearly declared protein.
Key Market Trends & Insights
- Ownership of kefir brands is consolidating into larger dairy groups. In December 2025 Horizon Family Brands acquired Maple Hill Creamery, an organic dairy brand with a kefir line. Consolidation gives acquired brands wider distribution, while independent specialists face better-funded rivals for chilled shelf space.
- Kefir is extending from drinks into spoonable formats that sit in the yogurt fixture. Biotiful Gut Health now sells a Greek Recipe Kefir and a Kefir Protein Yogurt in the United Kingdom. Spoonable lines give kefir brands access to a much larger chilled category, which raises the revenue potential of each listing.
- Protein content is becoming a purchase criterion across fermented milk. Japan's Agriculture and Livestock Industries Corporation linked a 2.8% rise in July 2026 fermented milk output to large packs and high-protein products. Suppliers that declare protein per serving hold an advantage in category resets against plain drinking milk.
Regional Highlights
- In Western Europe, kefir is gaining space inside the yogurt aisle. Müller described kefir as the fastest-growing segment of the UK yoghurt category when it agreed to buy Biotiful Gut Health in April 2025. As a result, kefir now competes for facings within the yogurt budget as an established subcategory.
- In East Asia, falling drinking milk demand is pushing dairies towards fermented products. Japanese drinking milk output fell 2.9% in July 2026 for a twelfth consecutive month. USDA staff in Seoul expect Korean milk production to fall to 1.93 million tons in 2026 as fresh milk consumption keeps declining.
Kefir Market Size and Forecast
Table 1: Kefir Market Size and Forecast
| Market size and forecast | Value |
|---|---|
| Market size in 2025 | USD 2.3 billion |
| Estimated market size in 2026 | USD 2.4 billion |
| Projected market size by 2036 | USD 4.5 billion |
| CAGR from 2026 to 2036 | 6.5% |
Source: Future Market Insights analysis of the kefir market, 2026.
Analyst Perspective
“Kefir demand is driven by repeat purchase. Trial comes from gut-health positioning, and retention depends on mild taste and clearly declared protein. Supplier differentiation rests on stable taste and carbonation across the full shelf life and on lactose-free and lower-sugar ranges. The main qualification risk is cold-chain discipline, because product that warms in transit continues to ferment and can be rejected by retailers before its date.”
- Nandini Roy Choudhury, Principal Analyst at Future Market Insights
How is the Kefir Market segmented?
- By product type: Milk Kefir, Water Kefir, and Plant-based Kefir. Spoonable kefir sold next to yogurt overlaps with the yogurt market that FMI tracks separately.
- By nature: Conventional and Organic.
- By flavor: Plain and Flavored.
- By distribution channel: Supermarkets and Hypermarkets, Convenience Stores, Specialty Stores, Online Retail, and Foodservice.
- By region: North America, Latin America, Western Europe, Eastern Europe, East Asia, South Asia and Pacific, and Middle East and Africa.
Why does Milk Kefir lead by Product Type in the Kefir Market in 2026?
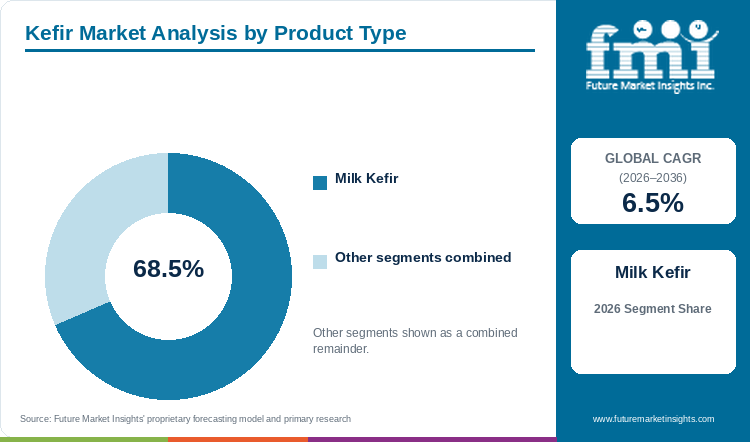
Milk Kefir holds 68.5% of the Kefir Market by product type in 2026.
Milk kefir leads because it runs on the milk supply, fermentation lines and chilled routes that dairies already operate. Processors are steering milk towards cultured products as drinking milk declines. In Japan, J-Milk expects fermented milk output to rise 0.3% in fiscal 2026 even as total raw milk output falls 1.2%. Milk kefir fits those existing cultured lines directly, which lowers the volume a dairy needs before a kefir range becomes profitable.
Water Kefir and Plant-based Kefir together hold the remaining 31.5% by product type. Plant-based kefir draws on the same bases used in the plant-based yogurt market. Both formats require sourcing and fermentation outside the core dairy supply chain, which limits their scale relative to milk kefir.
Table 2: Product Type, 2026 Share
| Leading Share | 2026 market share |
|---|---|
| Milk Kefir | 68.5% |
| All Other Segments Combined Share | 31.5% |
Source: Future Market Insights analysis of the kefir market, 2026.
Why does Flavored Kefir lead by Flavor in the Kefir Market in 2026?
Flavored Kefir accounts for 58.8% of the Kefir Market by flavor in 2026.
Fruit flavors lead because they temper the sourness that deters many first-time buyers. Emmi launched its Swiss kefir range in Classic, Strawberry and Mango varieties and positions it on a mild taste. Flavored lines therefore serve as the recruitment route into the category.
Sugar regulation is the main constraint on this segment. Under the FDA's updated healthy claim, a dairy product may contain no more than 2.5 g of added sugar per 2/3 cup. Highly sweetened yogurt no longer qualifies, which forces flavored kefir brands to trade sweetness against front-of-pack health language.
Plain Kefir holds the remaining 41.2% by flavor. Plain variants benefit from a wider shift towards unsweetened fermented dairy. German plain yogurt production rose 2.7% in 2025, while flavored fresh products with added ingredients grew only 0.4%. Plain kefir also competes with products in the drinkable yogurt market for breakfast and cooking use.
Table 3: Flavor, 2026 Share
| Leading Share | 2026 market share |
|---|---|
| Flavored Kefir | 58.8% |
| All Other Segments Combined Share | 41.2% |
Source: Future Market Insights analysis of the kefir market, 2026.
Why do Supermarkets and Hypermarkets lead by Distribution Channel in the Kefir Market in 2026?
Supermarkets and Hypermarkets represent 49.8% of the Kefir Market by distribution channel in 2026.
Large grocery formats lead because kefir needs refrigerated shelf space and fast stock rotation, which they provide at national scale. They also stock the 1 kg cartons and family bottles that smaller outlets rarely list. The resulting buyer concentration gives grocers pricing power over suppliers. Lifeway Foods illustrates the exposure, since two major customers accounted for 25.0% of its net sales in the first half of 2026.
Convenience Stores, Specialty Stores, Online Retail and Foodservice together account for the remaining 50.2%. Convenience formats are gaining where small households shape demand. South Korean convenience stores returned to sales growth in 2026 after a decline a year earlier. Single-serve kefir is the format best matched to that channel.
Table 4: Distribution Channel, 2026 Share
| Leading Share | 2026 market share |
|---|---|
| Supermarkets and Hypermarkets | 49.8% |
| All Other Segments Combined Share | 50.2% |
Source: Future Market Insights analysis of the kefir market, 2026.
What are the key drivers restraints and opportunities?
Kefir revenue depends on repeat purchase by consumers who buy it for gut health and protein. Live cultures also make the product harder to store and ship than drinking milk, which raises distribution cost.
Driver
Public nutrition advice now names fermented dairy directly, which lowers the cost of educating new buyers. The US dietary guidelines for 2025 to 2030 recommend three servings of dairy a day and favour full-fat dairy with no added sugars. Organic sales point to the same health-led demand, with US organic yogurt sales up 16.6% in 2025 according to the Organic Trade Association. Sustained growth of this kind supports wider chilled facings for cultured drinks.
Restraint
Milk and packaging costs can rise faster than kefir makers are able to reprice. Lifeway Foods reported significant increases in conventional milk prices in the second quarter of 2026, while resin-based bottles and caps cost more as oil prices rose. As a result, its gross margin fell to 19.5% from 28.6% in that quarter. Smaller brands without long-term milk contracts face the same pressure with less purchasing power.
Opportunity
Lactose-free and spoonable kefir can widen the buyer base beyond regular milk drinkers. Dairies with lactose-free processing already apply it to the category, and Valio sells a lactose-free Gefilus Kefir in Finland. Spoonable formats extend the same opportunity into the yogurt fixture without a new chilled category. Revenue capture depends on keeping taste stable and price close to mainstream yogurt.
How do labelling rules and dietary guidance affect kefir product claims?
Added-sugar limits now determine which flavored kefir products can make health claims in the United States. The FDA's healthy claim sets a ceiling of 2.5 g of added sugar per 2/3 cup for dairy products. The 2025 to 2030 dietary guidelines advise consumers to apply the same limit when choosing dairy snacks. Fruit kefir sweetened with sugar or juice concentrate therefore risks losing claims that a plain version retains, which favours reformulation towards lower-sugar recipes.
Health claims must also match the clinical evidence. A 2026 review of 28 clinical studies found possible kefir benefits for gut microbiota and metabolic markers. It concluded that the strength of evidence remains limited because recipes, doses and trial designs vary widely. Claims anchored on established nutrients such as calcium and protein therefore face lower regulatory risk than strain-specific gut-health claims.
What limits reliable kefir supply and product quality?
Cold storage and plant footprint set the first limit on reliable supply. Valio states that its Gefilus Kefir must be kept below 8 °C and used within three to four days of opening. In June 2026 Valio decided to move production from its Oulu plant to three other Finnish sites by mid-2028, citing higher costs and tougher competition . Plant transfers of this kind create a risk of short supply while new lines are qualified.
Raw milk availability is the second limit, and it differs sharply by country. German milk deliveries to dairies rose 1.2% in 2025. Swiss dairy cow numbers fell 1.4% in the year to April 2026. Because fresh kefir cannot travel far without cost and quality loss, producers need regional milk sourcing that matches each sales market.
Where can kefir suppliers win additional business?
Suppliers can add business in organic, lactose-free and protein-led ranges. US sales of organic dairy and eggs rose 12.8% to USD 9.6 billion in 2025, which gives organic kefir a growing base in mainstream grocery. Kefir also competes for the health-led shoppers served by the functional dairy products market, where protein and digestive positioning is already established. Specialty grocers offer a lower-cost route to test premium formats before a national launch.
Kefir Market by Country (2026 to 2036)
Table 5: Kefir Market Country Growth Forecast
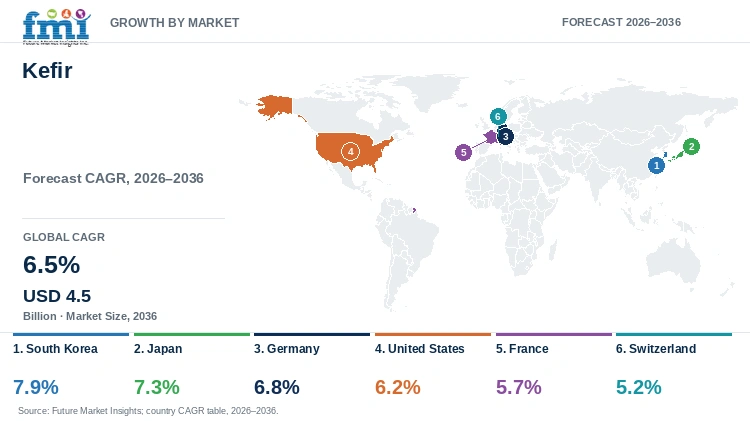
| Country | CAGR, 2026 to 2036 |
|---|---|
| South Korea | 7.9% |
| Japan | 7.3% |
| Germany | 6.8% |
| United States | 6.2% |
| France | 5.7% |
| Switzerland | 5.2% |
Source: Future Market Insights analysis of the kefir market, 2026.
South Korea
Korean dairies are losing their core drinking milk customers, which is pushing them towards adult nutrition products. USDA staff in Seoul forecast that milk production will fall to 1.93 million tons in 2026. Per capita fresh milk consumption was 25.3 kg in 2024, down 0.6 kg on the year. Low birth rates are shrinking the child population that drinks most milk, and processors are responding with protein products for adults and older consumers.
Retail demand is moving to small packs sold close to home. The same USDA report notes that convenience stores and mixed retailers have increased their share of fresh milk sales. Convenience store sales rose 3.7% in the first six months of 2026. Processed food sales in the channel rose 5.9% in September as single-person households bought ready foods. One-person households made up 36.1% of all Korean households in 2024. This household structure favours single-serve kefir bottles priced for daily purchase.
Input costs are also set to ease. Korean tariffs on milk from the United States and the European Union fall to zero in 2026. Domestic milk for processing costs KRW 882 per litre, about twice the price of imported milk. Access to lower-cost imported milk would allow local brands to price kefir closer to established yogurt drinks. Single-serve demand and cheaper inputs together support a 7.9% CAGR for Korean kefir revenue over 2026 to 2036, the fastest among the profiled countries. Established probiotic drinks already hold convenience store shelves, so new kefir lines need mild flavors and small formats to secure repeat purchase.
Japan
Fermented milk is holding volume in Japan while drinking milk shrinks. The Agriculture and Livestock Industries Corporation reported that July 2026 drinking milk output fell 2.9% to 255,734 kilolitres. Fermented milk output rose 2.8% to 93,844 kilolitres in the same month. The contrast shows processors directing a shrinking milk pool towards cultured products.
Demographics reinforce that pattern. The Statistics Bureau reported 36.24 million residents aged 65 and over in September 2026, equal to 29.6% of the population. An ageing population shifts dairy demand towards small daily servings positioned on digestion and protein, which suits compact kefir formats. Daily consumption also raises purchase frequency, so each retail listing generates more repeat revenue for the supplier.
Surplus dairy stocks add commercial pressure to move milk into value-added products. Butter stocks at the end of July 2026 were 20.7% above a year earlier, and skim milk powder stocks were 25.6% higher. Processors holding these stocks have an incentive to divert milk into fermented lines with higher unit value. Kefir starts from a small base and must compete with established yogurt drinks for each new household. At 7.3% a year between 2026 and 2036, Japanese kefir revenue growth ranks behind only South Korea among the profiled countries. Mild recipes in compact packs are the formats most likely to convert older consumers and sustain that rate.
Germany
German dairies are shifting milk from drinking milk into cultured products. The MIV reported that sour milk and kefir production rose 5.7% in 2025. Milk deliveries to dairies rose 1.2% to 32.49 million tonnes over the same year, which gave plants more raw milk to process.
Drinking milk is in structural decline. Federal statistics show that German drinking milk production fell 2.6% in 2025, the fifth consecutive annual fall. Per capita consumption dropped to 45.1 kg. Organic is the exception, with organic drinking milk production up 23.1% to a 13.2% share of all drinking milk. Organic and plain kefir draw on the same shopper base, which supports a 6.8% CAGR for German kefir revenue across 2026 to 2036.
Capacity released from drinking milk lowers the cost of entry. Dairies that already fill sour milk can add kefir on existing lines with limited new investment. Kefir is also displacing older sour milk drinks, and buttermilk output fell 6.1% in 2025. Price is the main constraint on value growth. Plain dairy in large grocery chains is sold largely on price, so shelf prices can stay low even when milk costs rise. Brands that pair organic milk with declared protein content hold more pricing power in this environment. Value growth will therefore depend on product mix and premium formats as much as on volume.
United States
Federal nutrition policy is the main demand lever in the United States. The 2025 to 2030 dietary guidelines name kefir among fermented foods and favour full-fat dairy without added sugars. That guidance gives retailers and brands an official reference for gut-health positioning, which lowers the cost of category education. It also favours plain and low-sugar recipes over sweetened lines.
Competition is set to intensify as multinational groups enter. Danone's chief executive described US kefir as very small but growing very fast and confirmed that the group would enter the category. A multinational entrant with national distribution is likely to expand total shelf space for kefir as well as compete for it. Specialist brands therefore need to secure listings and milk supply before the new capacity reaches retail. Retailers are likely to use the entry to renegotiate terms with incumbent suppliers.
Organic ownership is consolidating at the same time. The December 2025 acquisition of Maple Hill Creamery by Horizon Family Brands brought a grass-fed organic kefir line under a larger owner. Larger owners give such brands wider distribution and stronger terms with grocers. Revenue is expected to expand at 6.2% a year over 2026 to 2036 as competition increases and the revenue base enlarges. Raw milk cost remains the principal threat to supplier margins over that period, which favours suppliers with long-term milk contracts.
France
French shoppers are returning to plain fermented dairy. FranceAgriMer reported that household purchases of plain yogurt rose 6.9% by volume in 2025 while purchases of other yogurts were flat. Plain yogurt reached 82.5% of households, up 1.4 points on 2024. Total ultra-fresh dairy production grew only 0.5% over the same year.
Trade in fermented milks is expanding in both directions, which signals open retail access for foreign brands. Imports of yogurts and fermented milks rose 16.6% to 137,000 tonnes in 2025. Exports rose 8.2% to 391,000 tonnes. Kefir producers elsewhere in Europe can therefore reach French shelves through established import routes.
Local competition limits the pace of growth. Fromage blanc and petits suisses already serve the same breakfast and snack occasions, and their production rose 4.6% in 2025. Kefir revenue in France is projected to increase at a 5.7% CAGR between 2026 and 2036, the second-slowest rate among the profiled countries. A plain, mildly sour drink aligns with the shift to plain yogurt more closely than a sweet dessert format. Suppliers already serving French supermarkets can add kefir to existing chilled deliveries at low incremental cost. New entrants will need sustained promotion to secure trial. Revenue gains will rest on displacing part of existing plain yogurt spend, which keeps the national growth rate moderate.
Switzerland
Swiss dairies have more milk to process in 2026. Swiss Milk Producers reported that milk production rose 6.1% to 891,976 tonnes in the first quarter of 2026. Milk processed into yogurt rose 15.0% over the same period. Organic milk production rose 9.5%, and organic milk used for yogurt grew 11.7%.
That surplus is moving into new cultured formats. Emmi launched its lactose-free kefir range in Swiss retail in March 2026, made from Swiss milk and sold as drinks and yogurts. With first-half 2026 net sales of CHF 2.3 billion, the group has the scale to secure listings across the main grocery chains.
Market size caps the upside. Swiss kefir revenue is projected to climb 5.2% a year over 2026 to 2036, the slowest pace among the six profiled countries. Growth will come mainly from new formats and higher value per pack within existing grocery listings. Lower milk prices support margins, since the industry guide price for A-segment milk fell from 82.0 to 78.0 Swiss centimes per kg in February 2026. Herd size is a longer-term constraint, as dairy cow numbers fell 1.4% in the year to April 2026. Lactose-free kefir extends the addressable base to consumers who avoid regular milk. Suppliers with established national listings therefore hold the advantage in capturing the limited new volume.
Who are the notable companies in the Kefir Market?
Kefir competition divides into a US specialist, multinational dairy groups and national dairy processors. Lifeway Foods describes itself as the largest kefir producer in the United States. Drinkable kefir made up 88.0% of its net sales in the six months to June 2026, against 85.0% a year earlier. Its USD 50.5 million project to double Waukesha capacity is due to run at the larger scale from January 2027. The company raised selling expenses to 11.4% of net sales in the second quarter of 2026 to build brand awareness. Management reported particularly strong demand from GLP-1 users and tested premium distribution through an April 2026 smoothie partnership with Erewhon.
Danone reaches the category through Activia Kefir, which combines Activia cultures with kefir yeasts in a blend of 16 strains. Its first-half 2026 results named kefir among the platforms with strong demand in Europe. Its Alpro plant-based brand grew at a high single-digit rate in Europe over the same period. After selling its Lifeway shareholding in May 2026, Danone said it would enter the US kefir category. Eight capacity projects at four US factories since December 2025 mean capacity no longer limits its US yogurt business.
European dairy groups are also entering through acquisition and launches. Müller agreed to buy Biotiful Gut Health in April 2025 and said the brand would operate independently for the time being. Biotiful now sells kefir drinks, kefir yogurts and Greek Recipe Kefir, with claims built on calcium and vitamin B12. Emmi launched a lactose-free kefir range in Switzerland in March 2026. Valio sells lactose-free Gefilus Kefir in Finland and frames its claims around calcium and vitamin D. Valio is also moving production away from its Oulu plant.
Organic brands form a smaller third group, represented here by Maple Hill Creamery under Horizon Family Brands. Competitive advantage across all three groups rests on milk sourcing, sugar content, shelf life and delivery reliability.
Key Developments in the Kefir Market
- In March 2026, Emmi launched its Emmi Kefir range of lactose-free kefir drinks and yogurts in Swiss retail.
- On 17 June 2026, Valio decided to transfer production from its Oulu plant, where Gefilus Kefir is made, to its Riihimäki, Jyväskylä and Joensuu plants by the end of the first half of 2028.
- By 30 June 2026, Lifeway Foods had spent USD 38.9 million on a USD 50.5 million project to double capacity at its Waukesha, Wisconsin plant, with larger-scale output due from January 2027.
Key Players in the Kefir Market
- Lifeway Foods, Inc.
- Danone S.A.
- Unternehmensgruppe Theo Müller (Müller Group)
- Bio-tiful Dairy Ltd. (Biotiful Gut Health)
- Valio Ltd.
- Emmi Group
- Maple Hill Creamery (Horizon Family Brands)
Kefir Market Report Scope
Table 6: Kefir Market Report Scope
| Coverage field | Report scope |
|---|---|
| Market definition | Supplier revenue from packaged kefir drinks and kefir-based cultured products sold through retail and foodservice channels. Home fermentation cultures and kefir grains sold to consumers are excluded. |
| Product Type | Milk Kefir; Water Kefir; Plant-based Kefir |
| Nature | Conventional; Organic |
| Flavor | Plain; Flavored |
| Distribution Channel | Supermarkets and Hypermarkets; Convenience Stores; Specialty Stores; Online Retail; Foodservice |
| Regions covered | North America, Latin America, Western Europe, Eastern Europe, East Asia, South Asia and Pacific, Middle East and Africa |
| Profiled markets | South Korea, Japan, Germany, United States, France, Switzerland |
| Companies covered | Lifeway Foods, Inc.; Danone S.A.; Unternehmensgruppe Theo Müller; Bio-tiful Dairy Ltd.; Valio Ltd.; Emmi Group; Maple Hill Creamery |
| Quantitative Units | USD billion |
Source: Future Market Insights analysis of the kefir market, 2026.
Kefir Market Research Methodology
The kefir assessment draws on dairy production statistics, national retail data, dietary guidance and company disclosures. FMI measures annual supplier revenue from packaged kefir drinks and kefir-based cultured products. Segment values are classified by product type, nature, flavor and distribution channel. Country forecasts reflect local milk supply, retail channels and dietary habits over the same 2026 to 2036 period. Production volumes, retail sales and company revenue are reviewed as separate measures.
Kefir Market by Segments
Kefir Market segmented by Product Type:
- Milk Kefir
- Water Kefir
- Plant-based Kefir
Kefir Market segmented by Nature:
- Conventional
- Organic
Kefir Market segmented by Flavor:
- Plain
- Flavored
Kefir Market segmented by Distribution Channel:
- Supermarkets and Hypermarkets
- Convenience Stores
- Specialty Stores
- Online Retail
- Foodservice
Kefir Market by Region
- North America
- United States
- Canada
- Latin America
- Brazil
- Mexico
- Argentina
- Chile
- Western Europe
- Germany
- France
- United Kingdom
- Italy
- Spain
- Benelux
- Nordics
- Switzerland
- Eastern Europe
- Poland
- Czech Republic
- Romania
- Hungary
- East Asia
- Japan
- South Korea
- South Asia and Pacific
- ASEAN
- Australia and New Zealand
- Middle East and Africa
- GCC Countries
- South Africa
- Türkiye
- Israel
Research Sources and Bibliography
- [1] U.S. Department of Health and Human Services and U.S. Department of Agriculture. (2026, January). Dietary Guidelines for Americans, 2025-2030.
- [2] Milchindustrie-Verband e.V. (MIV). (2026). Herstellung ausgewählter Milchprodukte 2020-2025, accessed 4 November 2026.
- [3] Danone S.A. (2026, July 29). H1 2026 Results Conference Call Transcript. https://www.danone.com/content/dam/corp/global/danonecom/investors/en-result-center/2026/transcriptH126danone.pdf
- [4] Lifeway Foods, Inc. (2026, August). Form 10-Q for the quarterly period ended June 30, 2026. https://lifewaykefir.com/wp-content/uploads/Lifeway-10-Q-6-30-26-as-filed.pdf
- [5] Valio Ltd. (2026, June 17). Valio's production in Oulu will be transferred gradually to Riihimäki, Jyväskylä and Joensuu. https://www.valio.com/news/valios-production-in-oulu-will-be-transferred-gradually-to-riihimaki-jyvaskyla-and-joensuu-production-will-cease-within-the-next-few-years/
- [6] Danone S.A. (2026, July 29). 2026 Half-Year Results press release. https://www.danone.com/content/dam/corp/global/danonecom/investors/en-all-publications/2026/pressreleases/prdanone290726.pdf
- [7] Danone S.A. (2026, September 8). Investor conference fireside chat transcript. https://www.danone.com/content/dam/corp/global/danonecom/investors/en-investor-conferences/2026/transcriptfiresidechat080926.pdf
- [8] Unternehmensgruppe Theo Müller. (2025, April 11). Unternehmensgruppe Theo Müller acquires British yoghurt producer Biotiful Gut Health. https://www.muellergroup.com/en/the-group/news/unternehmensgruppe-theo-mueller-uebernimmt-britischen-joghurtproduzenten-biotiful-gut-health
- [9] Bio-tiful Dairy Ltd. (2026). Biotiful Gut Health home page and product range, accessed 4 November 2026. https://biotifulguthealth.com/
- [10] Emmi Group. (2026, July 29). Emmi Kefir: And everything gets easier. https://group.emmi.com/che/en/stories/brands-emmi-kefir-and-everything-gets-easier
- [11] U.S. Food and Drug Administration. (2025, March 14). Use of the "Healthy" Claim on Food Labeling. https://www.fda.gov/food/nutrition-food-labeling-and-critical-foods/use-healthy-claim-food-labeling
- [12] Fijan, S., Povalej Bržan, P., Šikić Pogačar, M., et al. (2026). Kefir Consumption and Health Effects Based on Human Clinical Trials: An Overview of Literature. Healthcare, 14(5), 652. https://pmc.ncbi.nlm.nih.gov/articles/PMC12984562/
- [13] Valio Ltd. (2026). Valio Gefilus Kefir juotava välipala maustamaton laktoositon, product page, accessed 4 November 2026. https://www.valio.fi/tuotteet/valio-gefilus-kefir-juotava-valipala-maustamaton-laktoositon/
- [14] Organic Trade Association. (2026, March 4). U.S. Organic Marketplace Achieved Significant Growth in 2025.
- [15] Agriculture and Livestock Industries Corporation (ALIC). (2026, October). Domestic supply and demand, milk and dairy products: July 2026 raw milk production level with a year earlier.
- [16] Agriculture and Livestock Industries Corporation (ALIC). (2026, July). Domestic supply and demand, milk and dairy products: April 2026 raw milk production, with J-Milk fiscal 2026 outlook. https://www.alic.go.jp/joho-c/joho05_004291.html
- [17] Statistics Bureau of Japan, Ministry of Internal Affairs and Communications. (2026, September 20). Statistical Topics No. 149: Japan's elderly population. https://www.stat.go.jp/data/topics/topi1490.html
- [18] Danone S.A. (2026, October 28). Q3 2026 Sales presentation. https://www.danone.com/content/dam/corp/global/danonecom/investors/en-result-center/2026/Q32026presentation.pdf
- [19] U.S. Department of Agriculture, Foreign Agricultural Service. (2025, November 25). Dairy and Products Annual: Korea, Republic of (KS2025-0041). https://apps.fas.usda.gov/newgainapi/api/Report/DownloadReportByFileName?fileName=Dairy+and+Products+Annual_Seoul+ATO_Korea+-+Republic+of_KS2025-0041.pdf
- [20] Ministry of Trade, Industry and Resources, Republic of Korea. (2026, July 29). Major Retailer Sales Up 7.3% in First Half of 2026 and 9.5% in June 2026. https://english.motir.go.kr/eng/article/EATCLdfa319ada/2700/view
- [21] Ministry of Trade, Industry and Resources, Republic of Korea. (2026, October 28). Major Retailer Sales Rise 4.5 Percent in September. https://english.motir.go.kr/eng/article/EATCLdfa319ada/2767/view
- [22] Ministry of Data and Statistics, Republic of Korea. (2025, December 9). 2025 Statistics of One-person Households. https://mods.go.kr/board.es?act=view&bid=11763&list_no=444034&mid=a20101000000
- [23] Bundesanstalt für Landwirtschaft und Ernährung (BLE), BMEL-Statistik. (2026). Versorgung mit Milch und Milcherzeugnissen in Deutschland, 2025 preliminary data, accessed 4 November 2026. https://www.bmel-statistik.de/ernaehrung/versorgungsbilanzen/milch-und-milcherzeugnisse
- [24] FranceAgriMer. (2026, April). Les marchés des produits laitiers, carnés et avicoles: bilan 2025 et perspectives 2026. https://www.franceagrimer.fr/sites/default/files/2026-04/BIL-VIA-LAI-Bilan2025-Perspectives2026.pdf
- [25] Schweizer Milchproduzenten SMP. (2026, May). Monatliche Marktlage zu Milch und Milchprodukten in der Schweiz, Ausgabe Mai 2026. https://milchbauern.ch/wp-content/uploads/2026/06/bericht-milch-marktlage-smp-2026-mai-de.pdf
- [26] Lifeway Foods, Inc. (2026, May 14). Lifeway Foods Announces Record-Breaking Results for the First Quarter Ended March 31, 2026. https://lifewaykefir.com/wp-content/uploads/Lifeway-Foods%C2%AE-Announces-Record-Breaking-Results-for-the-First-Quarter-Ended-March-31-2026.pdf
- [27] Horizon Family Brands. (2025, December 1). Horizon Family Brands Announces Acquisition of Maple Hill Creamery to Strengthen Leadership in Organic Dairy. https://horizonfamilybrands.com/news/acquisition-of-maple-hill-creamery/
- [28] Emmi Group. (2026). Half-year report 2026: Key figures. https://report.emmi.com/h2026/en
- [29] Danone S.A. (2026). Essential Dairy and Plant-Based products, Danone Ireland, accessed 4 November 2026. https://www.danone.com/ie/en/brands/essential-dairy-and-plant-based-products.html
- [30] Maple Hill Creamery. (2026). Products, accessed 4 November 2026. https://www.maplehill.com/products
Table of Content
- Key Takeaways
- Market Size and CAGR
- Top Growth Driver
- Fastest Growing Segment
- Leading Region
- Key Companies
- Emerging Opportunities
- Executive Summary
- Global Market Outlook
- Demand-side Trends
- Supply-side Trends
- Technology Roadmap Analysis
- Analysis and Recommendations
- Analyst Perspective (What is happening? Why now? What should investors know?)
- Key Questions Answered
- How large is the market?
- What is the CAGR?
- What are key trends?
- Which region dominates?
- Who are the leaders?
Read More...
- Market Overview
- Market Coverage / Taxonomy
- Market Definition / Scope / Limitations
- Research Methodology
- Chapter Orientation
- Analytical Lens and Working Hypotheses
- Market Structure, Signals, and Trend Drivers
- Benchmarking and Cross-market Comparability
- Market Sizing, Forecasting, and Opportunity Mapping
- Research Design and Evidence Framework
- Desk Research Programme (Secondary Evidence)
- Expert Input and Fieldwork (Primary Evidence)
- Tooling, Models, and Reference Databases
- Data Engineering and Model Build
- Quality Assurance and Audit Trail
- Market Background
- Market Dynamics (Drivers, Restraints, Opportunity, Trends)
- Scenario Forecast (Optimistic, Likely, Conservative)
- Impact Analysis
- AI Impact
- Sustainability Impact
- Regulatory Impact
- Technology Impact
- Consumer / Buyer Analysis
- Purchase Drivers
- Adoption Barriers
- Buyer Journey
- Opportunity Map Analysis
- Product Life Cycle Analysis
- Supply Chain Analysis
- Investment Feasibility Matrix
- Value Chain Analysis
- PESTLE and Porter's Analysis
- Regulatory Landscape
- Regional Parent Market Outlook
- Production and Consumption Statistics
- Import and Export Statistics
- Global Market Analysis and Forecast, 2021 to 2036
- Historical Market Size Value (USD Billion) Analysis, 2021 to 2025
- Current and Future Market Size Value (USD Billion) Projections, 2026 to 2036
- Y-o-Y Growth Trend Analysis
- Absolute $ Opportunity Analysis
- Global Market Pricing Analysis, 2021 to 2036
- Global Market Analysis and Forecast, By Product Type, 2021 to 2036
- Introduction / Key Findings
- Historical Market Size Value (USD Billion) Analysis By Product Type, 2021 to 2025
- Current and Future Market Size Value (USD Billion) Analysis and Forecast By Product Type, 2026 to 2036
- Milk Kefir
- Water Kefir
- Plant-based Kefir
- Y-o-Y Growth Trend Analysis By Product Type, 2021 to 2025
- Absolute $ Opportunity Analysis By Product Type, 2026 to 2036
- Global Market Analysis and Forecast, By Nature, 2021 to 2036
- Introduction / Key Findings
- Historical Market Size Value (USD Billion) Analysis By Nature, 2021 to 2025
- Current and Future Market Size Value (USD Billion) Analysis and Forecast By Nature, 2026 to 2036
- Conventional
- Organic
- Y-o-Y Growth Trend Analysis By Nature, 2021 to 2025
- Absolute $ Opportunity Analysis By Nature, 2026 to 2036
- Global Market Analysis and Forecast, By Flavor, 2021 to 2036
- Introduction / Key Findings
- Historical Market Size Value (USD Billion) Analysis By Flavor, 2021 to 2025
- Current and Future Market Size Value (USD Billion) Analysis and Forecast By Flavor, 2026 to 2036
- Plain
- Flavored
- Y-o-Y Growth Trend Analysis By Flavor, 2021 to 2025
- Absolute $ Opportunity Analysis By Flavor, 2026 to 2036
- Global Market Analysis and Forecast, By Distribution Channel, 2021 to 2036
- Introduction / Key Findings
- Historical Market Size Value (USD Billion) Analysis By Distribution Channel, 2021 to 2025
- Current and Future Market Size Value (USD Billion) Analysis and Forecast By Distribution Channel, 2026 to 2036
- Supermarkets and Hypermarkets
- Convenience Stores
- Specialty Stores
- Online Retail
- Foodservice
- Y-o-Y Growth Trend Analysis By Distribution Channel, 2021 to 2025
- Absolute $ Opportunity Analysis By Distribution Channel, 2026 to 2036
- Global Market Analysis and Forecast, By Region, 2021 to 2036
- Introduction
- Historical Market Size Value (USD Billion) Analysis By Region, 2021 to 2025
- Current Market Size Value (USD Billion) Analysis and Forecast By Region, 2026 to 2036
- North America
- Latin America
- Western Europe
- Eastern Europe
- East Asia
- South Asia and Pacific
- Middle East and Africa
- Market Attractiveness Analysis By Region
- North America Market Analysis and Forecast, By Country, 2021 to 2036
- Historical Market Size Value (USD Billion) Trend Analysis By Market Taxonomy, 2021 to 2025
- Market Size Value (USD Billion) Forecast By Market Taxonomy, 2026 to 2036
- By Country
- United States
- Canada
- By Product Type
- By Nature
- By Flavor
- By Distribution Channel
- By Country
- Market Attractiveness Analysis
- By Country
- By Product Type
- By Nature
- By Flavor
- By Distribution Channel
- Key Takeaways
- Latin America Market Analysis and Forecast, By Country
- Historical Market Size Value (USD Billion) Trend Analysis By Market Taxonomy, 2021 to 2025
- Market Size Value (USD Billion) Forecast By Market Taxonomy, 2026 to 2036
- By Country
- Brazil
- Mexico
- Argentina
- Chile
- By Product Type
- By Nature
- By Flavor
- By Distribution Channel
- By Country
- Market Attractiveness Analysis
- By Country
- By Product Type
- By Nature
- By Flavor
- By Distribution Channel
- Key Takeaways
- Western Europe Market Analysis and Forecast, By Country
- Historical Market Size Value (USD Billion) Trend Analysis By Market Taxonomy, 2021 to 2025
- Market Size Value (USD Billion) Forecast By Market Taxonomy, 2026 to 2036
- By Country
- Germany
- France
- United Kingdom
- Italy
- Spain
- Benelux
- Nordics
- Switzerland
- By Product Type
- By Nature
- By Flavor
- By Distribution Channel
- By Country
- Market Attractiveness Analysis
- By Country
- By Product Type
- By Nature
- By Flavor
- By Distribution Channel
- Key Takeaways
- Eastern Europe Market Analysis and Forecast, By Country
- Historical Market Size Value (USD Billion) Trend Analysis By Market Taxonomy, 2021 to 2025
- Market Size Value (USD Billion) Forecast By Market Taxonomy, 2026 to 2036
- By Country
- Poland
- Czech Republic
- Romania
- Hungary
- By Product Type
- By Nature
- By Flavor
- By Distribution Channel
- By Country
- Market Attractiveness Analysis
- By Country
- By Product Type
- By Nature
- By Flavor
- By Distribution Channel
- Key Takeaways
- East Asia Market Analysis and Forecast, By Country
- Historical Market Size Value (USD Billion) Trend Analysis By Market Taxonomy, 2021 to 2025
- Market Size Value (USD Billion) Forecast By Market Taxonomy, 2026 to 2036
- By Country
- Japan
- South Korea
- By Product Type
- By Nature
- By Flavor
- By Distribution Channel
- By Country
- Market Attractiveness Analysis
- By Country
- By Product Type
- By Nature
- By Flavor
- By Distribution Channel
- Key Takeaways
- South Asia and Pacific Market Analysis and Forecast, By Country
- Historical Market Size Value (USD Billion) Trend Analysis By Market Taxonomy, 2021 to 2025
- Market Size Value (USD Billion) Forecast By Market Taxonomy, 2026 to 2036
- By Country
- ASEAN
- Australia and New Zealand
- By Product Type
- By Nature
- By Flavor
- By Distribution Channel
- By Country
- Market Attractiveness Analysis
- By Country
- By Product Type
- By Nature
- By Flavor
- By Distribution Channel
- Key Takeaways
- Middle East and Africa Market Analysis and Forecast, By Country
- Historical Market Size Value (USD Billion) Trend Analysis By Market Taxonomy, 2021 to 2025
- Market Size Value (USD Billion) Forecast By Market Taxonomy, 2026 to 2036
- By Country
- GCC Countries
- South Africa
- Türkiye
- Israel
- By Product Type
- By Nature
- By Flavor
- By Distribution Channel
- By Country
- Market Attractiveness Analysis
- By Country
- By Product Type
- By Nature
- By Flavor
- By Distribution Channel
- Key Takeaways
- Key Countries Market Analysis
- United States
- Pricing Analysis
- Market Share Analysis, 2025
- By Product Type
- By Nature
- By Flavor
- By Distribution Channel
- Canada
- Pricing Analysis
- Market Share Analysis, 2025
- By Product Type
- By Nature
- By Flavor
- By Distribution Channel
- Mexico
- Pricing Analysis
- Market Share Analysis, 2025
- By Product Type
- By Nature
- By Flavor
- By Distribution Channel
- Brazil
- Pricing Analysis
- Market Share Analysis, 2025
- By Product Type
- By Nature
- By Flavor
- By Distribution Channel
- Chile
- Pricing Analysis
- Market Share Analysis, 2025
- By Product Type
- By Nature
- By Flavor
- By Distribution Channel
- Germany
- Pricing Analysis
- Market Share Analysis, 2025
- By Product Type
- By Nature
- By Flavor
- By Distribution Channel
- United Kingdom
- Pricing Analysis
- Market Share Analysis, 2025
- By Product Type
- By Nature
- By Flavor
- By Distribution Channel
- Italy
- Pricing Analysis
- Market Share Analysis, 2025
- By Product Type
- By Nature
- By Flavor
- By Distribution Channel
- Spain
- Pricing Analysis
- Market Share Analysis, 2025
- By Product Type
- By Nature
- By Flavor
- By Distribution Channel
- France
- Pricing Analysis
- Market Share Analysis, 2025
- By Product Type
- By Nature
- By Flavor
- By Distribution Channel
- ASEAN
- Pricing Analysis
- Market Share Analysis, 2025
- By Product Type
- By Nature
- By Flavor
- By Distribution Channel
- Australia and New Zealand
- Pricing Analysis
- Market Share Analysis, 2025
- By Product Type
- By Nature
- By Flavor
- By Distribution Channel
- Japan
- Pricing Analysis
- Market Share Analysis, 2025
- By Product Type
- By Nature
- By Flavor
- By Distribution Channel
- South Korea
- Pricing Analysis
- Market Share Analysis, 2025
- By Product Type
- By Nature
- By Flavor
- By Distribution Channel
- Poland
- Pricing Analysis
- Market Share Analysis, 2025
- By Product Type
- By Nature
- By Flavor
- By Distribution Channel
- Hungary
- Pricing Analysis
- Market Share Analysis, 2025
- By Product Type
- By Nature
- By Flavor
- By Distribution Channel
- Türkiye
- Pricing Analysis
- Market Share Analysis, 2025
- By Product Type
- By Nature
- By Flavor
- By Distribution Channel
- South Africa
- Pricing Analysis
- Market Share Analysis, 2025
- By Product Type
- By Nature
- By Flavor
- By Distribution Channel
- Switzerland
- Pricing Analysis
- Market Share Analysis, 2025
- By Product Type
- By Nature
- By Flavor
- By Distribution Channel
- United States
- Market Structure Analysis
- Competition Dashboard
- Competition Benchmarking
- Market Share Analysis of Top Players
- By Regional
- By Product Type
- By Nature
- By Flavor
- By Distribution Channel
- Emerging Startups
- Innovation Benchmarking
- Competition Analysis
- Competition Deep Dive
- Lifeway Foods, Inc.
- Overview
- Product Portfolio
- Profitability by Market Segments
- Sales Footprint
- Strategy Overview
- Marketing Strategy
- Product Strategy
- Channel Strategy
- Danone S.A.
- Unternehmensgruppe Theo Müller
- Emmi Group
- Valio Ltd.
- Unternehmensgruppe Theo Müller (Müller Group)
- Bio-tiful Dairy Ltd. (Biotiful Gut Health)
- Maple Hill Creamery (Horizon Family Brands)
- Lifeway Foods, Inc.
- Case Studies
- Success Stories
- Recent Developments
- Competition Deep Dive
- Assumptions & Acronyms Used
List of Tables
- Table 1: Global Market Value (USD Billion) Forecast by Region, 2021 to 2036
- Table 2: Global Market Value (USD Billion) Forecast by Product Type, 2021 to 2036
- Table 3: Global Market Value (USD Billion) Forecast by Nature, 2021 to 2036
- Table 4: Global Market Value (USD Billion) Forecast by Flavor, 2021 to 2036
- Table 5: Global Market Value (USD Billion) Forecast by Distribution Channel, 2021 to 2036
- Table 6: North America Market Value (USD Billion) Forecast by Country, 2021 to 2036
- Table 7: North America Market Value (USD Billion) Forecast by Product Type, 2021 to 2036
- Table 8: North America Market Value (USD Billion) Forecast by Nature, 2021 to 2036
- Table 9: North America Market Value (USD Billion) Forecast by Flavor, 2021 to 2036
- Table 10: North America Market Value (USD Billion) Forecast by Distribution Channel, 2021 to 2036
- Table 11: Latin America Market Value (USD Billion) Forecast by Country, 2021 to 2036
- Table 12: Latin America Market Value (USD Billion) Forecast by Product Type, 2021 to 2036
- Table 13: Latin America Market Value (USD Billion) Forecast by Nature, 2021 to 2036
- Table 14: Latin America Market Value (USD Billion) Forecast by Flavor, 2021 to 2036
- Table 15: Latin America Market Value (USD Billion) Forecast by Distribution Channel, 2021 to 2036
- Table 16: Western Europe Market Value (USD Billion) Forecast by Country, 2021 to 2036
- Table 17: Western Europe Market Value (USD Billion) Forecast by Product Type, 2021 to 2036
- Table 18: Western Europe Market Value (USD Billion) Forecast by Nature, 2021 to 2036
- Table 19: Western Europe Market Value (USD Billion) Forecast by Flavor, 2021 to 2036
- Table 20: Western Europe Market Value (USD Billion) Forecast by Distribution Channel, 2021 to 2036
- Table 21: Eastern Europe Market Value (USD Billion) Forecast by Country, 2021 to 2036
- Table 22: Eastern Europe Market Value (USD Billion) Forecast by Product Type, 2021 to 2036
- Table 23: Eastern Europe Market Value (USD Billion) Forecast by Nature, 2021 to 2036
- Table 24: Eastern Europe Market Value (USD Billion) Forecast by Flavor, 2021 to 2036
- Table 25: Eastern Europe Market Value (USD Billion) Forecast by Distribution Channel, 2021 to 2036
- Table 26: East Asia Market Value (USD Billion) Forecast by Country, 2021 to 2036
- Table 27: East Asia Market Value (USD Billion) Forecast by Product Type, 2021 to 2036
- Table 28: East Asia Market Value (USD Billion) Forecast by Nature, 2021 to 2036
- Table 29: East Asia Market Value (USD Billion) Forecast by Flavor, 2021 to 2036
- Table 30: East Asia Market Value (USD Billion) Forecast by Distribution Channel, 2021 to 2036
- Table 31: South Asia and Pacific Market Value (USD Billion) Forecast by Country, 2021 to 2036
- Table 32: South Asia and Pacific Market Value (USD Billion) Forecast by Product Type, 2021 to 2036
- Table 33: South Asia and Pacific Market Value (USD Billion) Forecast by Nature, 2021 to 2036
- Table 34: South Asia and Pacific Market Value (USD Billion) Forecast by Flavor, 2021 to 2036
- Table 35: South Asia and Pacific Market Value (USD Billion) Forecast by Distribution Channel, 2021 to 2036
- Table 36: Middle East and Africa Market Value (USD Billion) Forecast by Country, 2021 to 2036
- Table 37: Middle East and Africa Market Value (USD Billion) Forecast by Product Type, 2021 to 2036
- Table 38: Middle East and Africa Market Value (USD Billion) Forecast by Nature, 2021 to 2036
- Table 39: Middle East and Africa Market Value (USD Billion) Forecast by Flavor, 2021 to 2036
- Table 40: Middle East and Africa Market Value (USD Billion) Forecast by Distribution Channel, 2021 to 2036
List of Figures
- Figure 1: Global Market Pricing Analysis
- Figure 2: Global Market Value (USD Billion) Forecast 2021-2036
- Figure 3: Global Market Value Share and BPS Analysis by Product Type, 2026 and 2036
- Figure 4: Global Market Y-o-Y Growth Comparison by Product Type, 2026-2036
- Figure 5: Global Market Attractiveness Analysis by Product Type
- Figure 6: Global Market Value Share and BPS Analysis by Nature, 2026 and 2036
- Figure 7: Global Market Y-o-Y Growth Comparison by Nature, 2026-2036
- Figure 8: Global Market Attractiveness Analysis by Nature
- Figure 9: Global Market Value Share and BPS Analysis by Flavor, 2026 and 2036
- Figure 10: Global Market Y-o-Y Growth Comparison by Flavor, 2026-2036
- Figure 11: Global Market Attractiveness Analysis by Flavor
- Figure 12: Global Market Value Share and BPS Analysis by Distribution Channel, 2026 and 2036
- Figure 13: Global Market Y-o-Y Growth Comparison by Distribution Channel, 2026-2036
- Figure 14: Global Market Attractiveness Analysis by Distribution Channel
- Figure 15: Global Market Value (USD Billion) Share and BPS Analysis by Region, 2026 and 2036
- Figure 16: Global Market Y-o-Y Growth Comparison by Region, 2026-2036
- Figure 17: Global Market Attractiveness Analysis by Region
- Figure 18: North America Market Incremental Dollar Opportunity, 2026-2036
- Figure 19: Latin America Market Incremental Dollar Opportunity, 2026-2036
- Figure 20: Western Europe Market Incremental Dollar Opportunity, 2026-2036
- Figure 21: Eastern Europe Market Incremental Dollar Opportunity, 2026-2036
- Figure 22: East Asia Market Incremental Dollar Opportunity, 2026-2036
- Figure 23: South Asia and Pacific Market Incremental Dollar Opportunity, 2026-2036
- Figure 24: Middle East and Africa Market Incremental Dollar Opportunity, 2026-2036
- Figure 25: North America Market Value Share and BPS Analysis by Country, 2026 and 2036
- Figure 26: North America Market Value Share and BPS Analysis by Product Type, 2026 and 2036
- Figure 27: North America Market Y-o-Y Growth Comparison by Product Type, 2026-2036
- Figure 28: North America Market Attractiveness Analysis by Product Type
- Figure 29: North America Market Value Share and BPS Analysis by Nature, 2026 and 2036
- Figure 30: North America Market Y-o-Y Growth Comparison by Nature, 2026-2036
- Figure 31: North America Market Attractiveness Analysis by Nature
- Figure 32: North America Market Value Share and BPS Analysis by Flavor, 2026 and 2036
- Figure 33: North America Market Y-o-Y Growth Comparison by Flavor, 2026-2036
- Figure 34: North America Market Attractiveness Analysis by Flavor
- Figure 35: North America Market Value Share and BPS Analysis by Distribution Channel, 2026 and 2036
- Figure 36: North America Market Y-o-Y Growth Comparison by Distribution Channel, 2026-2036
- Figure 37: North America Market Attractiveness Analysis by Distribution Channel
- Figure 38: Latin America Market Value Share and BPS Analysis by Country, 2026 and 2036
- Figure 39: Latin America Market Value Share and BPS Analysis by Product Type, 2026 and 2036
- Figure 40: Latin America Market Y-o-Y Growth Comparison by Product Type, 2026-2036
- Figure 41: Latin America Market Attractiveness Analysis by Product Type
- Figure 42: Latin America Market Value Share and BPS Analysis by Nature, 2026 and 2036
- Figure 43: Latin America Market Y-o-Y Growth Comparison by Nature, 2026-2036
- Figure 44: Latin America Market Attractiveness Analysis by Nature
- Figure 45: Latin America Market Value Share and BPS Analysis by Flavor, 2026 and 2036
- Figure 46: Latin America Market Y-o-Y Growth Comparison by Flavor, 2026-2036
- Figure 47: Latin America Market Attractiveness Analysis by Flavor
- Figure 48: Latin America Market Value Share and BPS Analysis by Distribution Channel, 2026 and 2036
- Figure 49: Latin America Market Y-o-Y Growth Comparison by Distribution Channel, 2026-2036
- Figure 50: Latin America Market Attractiveness Analysis by Distribution Channel
- Figure 51: Western Europe Market Value Share and BPS Analysis by Country, 2026 and 2036
- Figure 52: Western Europe Market Value Share and BPS Analysis by Product Type, 2026 and 2036
- Figure 53: Western Europe Market Y-o-Y Growth Comparison by Product Type, 2026-2036
- Figure 54: Western Europe Market Attractiveness Analysis by Product Type
- Figure 55: Western Europe Market Value Share and BPS Analysis by Nature, 2026 and 2036
- Figure 56: Western Europe Market Y-o-Y Growth Comparison by Nature, 2026-2036
- Figure 57: Western Europe Market Attractiveness Analysis by Nature
- Figure 58: Western Europe Market Value Share and BPS Analysis by Flavor, 2026 and 2036
- Figure 59: Western Europe Market Y-o-Y Growth Comparison by Flavor, 2026-2036
- Figure 60: Western Europe Market Attractiveness Analysis by Flavor
- Figure 61: Western Europe Market Value Share and BPS Analysis by Distribution Channel, 2026 and 2036
- Figure 62: Western Europe Market Y-o-Y Growth Comparison by Distribution Channel, 2026-2036
- Figure 63: Western Europe Market Attractiveness Analysis by Distribution Channel
- Figure 64: Eastern Europe Market Value Share and BPS Analysis by Country, 2026 and 2036
- Figure 65: Eastern Europe Market Value Share and BPS Analysis by Product Type, 2026 and 2036
- Figure 66: Eastern Europe Market Y-o-Y Growth Comparison by Product Type, 2026-2036
- Figure 67: Eastern Europe Market Attractiveness Analysis by Product Type
- Figure 68: Eastern Europe Market Value Share and BPS Analysis by Nature, 2026 and 2036
- Figure 69: Eastern Europe Market Y-o-Y Growth Comparison by Nature, 2026-2036
- Figure 70: Eastern Europe Market Attractiveness Analysis by Nature
- Figure 71: Eastern Europe Market Value Share and BPS Analysis by Flavor, 2026 and 2036
- Figure 72: Eastern Europe Market Y-o-Y Growth Comparison by Flavor, 2026-2036
- Figure 73: Eastern Europe Market Attractiveness Analysis by Flavor
- Figure 74: Eastern Europe Market Value Share and BPS Analysis by Distribution Channel, 2026 and 2036
- Figure 75: Eastern Europe Market Y-o-Y Growth Comparison by Distribution Channel, 2026-2036
- Figure 76: Eastern Europe Market Attractiveness Analysis by Distribution Channel
- Figure 77: East Asia Market Value Share and BPS Analysis by Country, 2026 and 2036
- Figure 78: East Asia Market Value Share and BPS Analysis by Product Type, 2026 and 2036
- Figure 79: East Asia Market Y-o-Y Growth Comparison by Product Type, 2026-2036
- Figure 80: East Asia Market Attractiveness Analysis by Product Type
- Figure 81: East Asia Market Value Share and BPS Analysis by Nature, 2026 and 2036
- Figure 82: East Asia Market Y-o-Y Growth Comparison by Nature, 2026-2036
- Figure 83: East Asia Market Attractiveness Analysis by Nature
- Figure 84: East Asia Market Value Share and BPS Analysis by Flavor, 2026 and 2036
- Figure 85: East Asia Market Y-o-Y Growth Comparison by Flavor, 2026-2036
- Figure 86: East Asia Market Attractiveness Analysis by Flavor
- Figure 87: East Asia Market Value Share and BPS Analysis by Distribution Channel, 2026 and 2036
- Figure 88: East Asia Market Y-o-Y Growth Comparison by Distribution Channel, 2026-2036
- Figure 89: East Asia Market Attractiveness Analysis by Distribution Channel
- Figure 90: South Asia and Pacific Market Value Share and BPS Analysis by Country, 2026 and 2036
- Figure 91: South Asia and Pacific Market Value Share and BPS Analysis by Product Type, 2026 and 2036
- Figure 92: South Asia and Pacific Market Y-o-Y Growth Comparison by Product Type, 2026-2036
- Figure 93: South Asia and Pacific Market Attractiveness Analysis by Product Type
- Figure 94: South Asia and Pacific Market Value Share and BPS Analysis by Nature, 2026 and 2036
- Figure 95: South Asia and Pacific Market Y-o-Y Growth Comparison by Nature, 2026-2036
- Figure 96: South Asia and Pacific Market Attractiveness Analysis by Nature
- Figure 97: South Asia and Pacific Market Value Share and BPS Analysis by Flavor, 2026 and 2036
- Figure 98: South Asia and Pacific Market Y-o-Y Growth Comparison by Flavor, 2026-2036
- Figure 99: South Asia and Pacific Market Attractiveness Analysis by Flavor
- Figure 100: South Asia and Pacific Market Value Share and BPS Analysis by Distribution Channel, 2026 and 2036
- Figure 101: South Asia and Pacific Market Y-o-Y Growth Comparison by Distribution Channel, 2026-2036
- Figure 102: South Asia and Pacific Market Attractiveness Analysis by Distribution Channel
- Figure 103: Middle East and Africa Market Value Share and BPS Analysis by Country, 2026 and 2036
- Figure 104: Middle East and Africa Market Value Share and BPS Analysis by Product Type, 2026 and 2036
- Figure 105: Middle East and Africa Market Y-o-Y Growth Comparison by Product Type, 2026-2036
- Figure 106: Middle East and Africa Market Attractiveness Analysis by Product Type
- Figure 107: Middle East and Africa Market Value Share and BPS Analysis by Nature, 2026 and 2036
- Figure 108: Middle East and Africa Market Y-o-Y Growth Comparison by Nature, 2026-2036
- Figure 109: Middle East and Africa Market Attractiveness Analysis by Nature
- Figure 110: Middle East and Africa Market Value Share and BPS Analysis by Flavor, 2026 and 2036
- Figure 111: Middle East and Africa Market Y-o-Y Growth Comparison by Flavor, 2026-2036
- Figure 112: Middle East and Africa Market Attractiveness Analysis by Flavor
- Figure 113: Middle East and Africa Market Value Share and BPS Analysis by Distribution Channel, 2026 and 2036
- Figure 114: Middle East and Africa Market Y-o-Y Growth Comparison by Distribution Channel, 2026-2036
- Figure 115: Middle East and Africa Market Attractiveness Analysis by Distribution Channel
- Figure 116: Global Market - Tier Structure Analysis
- Figure 117: Global Market - Company Share Analysis
Frequently Asked Questions
How big is the Kefir Market in 2026?
FMI estimates the market at USD 2.4 billion in 2026, up from USD 2.3 billion in 2025. It is projected to reach USD 4.5 billion by 2036 at a 6.5% CAGR.
Which product type leads the Kefir Market in 2026?
Milk Kefir leads by product type with 68.5% in 2026. Water Kefir and Plant-based Kefir together hold 31.5%.
Which flavor and distribution channel lead in 2026?
Flavored Kefir holds 58.8% by flavor. Supermarkets and Hypermarkets hold 49.8% by distribution channel in FMI's 2026 assessment.
Which country is forecast to grow fastest through 2036?
South Korea has the highest forecast CAGR at 7.9% during 2026 to 2036, followed by Japan at 7.3%. These are FMI forecasts and are not rates reported by the cited public bodies.
How do added-sugar rules affect flavored kefir?
They limit the health claims that sweetened products can make. Under the FDA's updated healthy claim, a dairy product may contain no more than 2.5 g of added sugar per 2/3 cup [11].
Preview the report firsthand - request a free sample
Get SampleGet the brochure for pricing and purchase details.
Get PDF
