The global kegs market is valued at USD 6.4 billion in 2025 and is slated to reach USD 11.7 billion by 2035, recording an absolute increase of USD 5.3 billion over the forecast period. This translates into a total growth of 82.8%, with the market forecast to expand at a CAGR of 6.2% between 2025 and 2035. Based on Future Market Insights (FMI)’s verified data on biopolymer, flexible, and rigid packaging adoption, the market size is expected to grow by nearly 1.83X during the same period, supported by increasing demand for draft beverage systems in commercial establishments, growing adoption of returnable packaging solutions in brewery operations, and rising preference for bulk beverage dispensing systems across beer distribution, craft brewing, and hospitality service applications.
Between 2025 and 2030, the kegs market is projected to expand from USD 6.4 billion to USD 8.7 billion, resulting in a value increase of USD 2.3 billion, which represents 43.4% of the total forecast growth for the decade. This phase of development will be shaped by increasing craft brewery establishment rates requiring flexible keg solutions, rising adoption of stainless steel kegs with enhanced durability characteristics, and growing demand for smart kegs with integrated tracking capabilities. Beverage distributors are expanding their keg fleet management capabilities to address the growing demand for efficient returnable packaging systems, draft beverage quality preservation, and specialty beverage distribution requirements.
Technological innovation is adding new layers of momentum to the market. Smart kegs with IoT-enabled features such as temperature monitoring, fill-level sensing, tracking tags, and real-time fleet visibility are gaining widespread acceptance. These technologies help beverage producers reduce losses, optimize refill cycles, and improve supply-chain efficiency. At the same time, advancements in cleaning, sanitizing, and filling equipment are improving hygiene standards and reducing downtime in breweries and beverage processing plants.
Material innovations are further reshaping competitive dynamics. While stainless-steel kegs remain the industry standard due to their durability and long service life, lightweight plastic and composite kegs are gaining traction in export-oriented markets where producers require cost-efficient, one-way shipping solutions. These newer keg formats offer reduced handling weight, improved safety, and lower transport costs, making them increasingly attractive for international shipments.
Advancements in keg manufacturing and management technologies are influencing competitive dynamics. Smart kegs equipped with tracking tags, IoT sensors, and temperature monitors are gaining traction for improving fleet management, reducing loss rates, and optimizing refill cycles. Breweries and beverage companies benefit from improved visibility into keg locations, handling conditions, and usage patterns. Developments in keg cleaning, sanitizing, and filling equipment further enhance hygiene and efficiency across beverage processing plants.
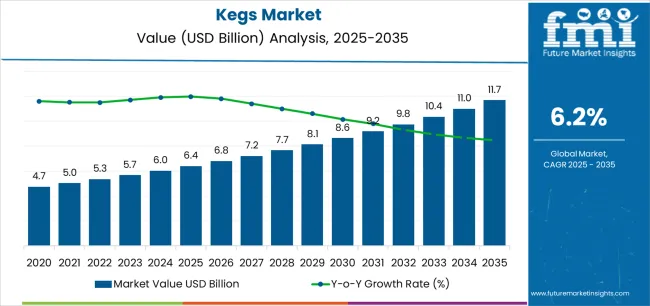
| Metric | Value |
|---|---|
| Estimated Value in (2025E) | USD 6.4 billion |
| Forecast Value in (2035F) | USD 11.7 billion |
| Forecast CAGR (2025 to 2035) | 6.2% |
The kegs market is largely influenced by several key parent markets, with the alcoholic beverages market being the largest contributor, accounting for about 40-45%. Kegs are extensively used in the brewing industry to package and transport beer, cider, and other carbonated drinks, offering significant advantages in maintaining product quality and ensuring efficient distribution. As the popularity of craft beers and draft beer consumption grows, so does the demand for durable and reusable kegs. The food and beverage packaging market contributes approximately 15-20%, with kegs also being used for non-alcoholic beverages such as soft drinks, juices, and kombucha.
Kegs provide a cost-effective solution for bulk packaging and delivery while maintaining the quality and freshness of the product. The industrial packaging market adds around 10-15%, as kegs are utilized for transporting various chemicals, liquids, and industrial products that require safe containment and handling during transit. The event and hospitality industry accounts for about 10-12%, where kegs are essential for efficiently serving beverages at large gatherings, festivals, and bars, where volume and quick distribution are critical. The reusable packaging market contributes about 8-10%, driven by the growing preference for reusable kegs over single-use containers, aligning with efforts to reduce waste and improve efficiency.
Market expansion is being supported by the increasing global demand for draft beverage consumption and the corresponding need for packaging systems that can provide superior product preservation and dispensing performance while enabling efficient logistics and returnable packaging economics across various commercial beverage distribution applications. Modern breweries and beverage producers are increasingly focused on implementing keg systems that can maintain product quality, prevent flavor degradation, and provide consistent dispensing performance throughout complex distribution networks and extended storage periods. Kegs' proven ability to deliver exceptional beverage protection against oxidation, enable efficient bulk transportation, and support returnable packaging models make them essential packaging formats for contemporary beverage industry operations.
The growing emphasis on beverage quality preservation and distribution efficiency is driving demand for kegs that can support high-volume filling operations, improve product shelf life, and enable automated handling formats. Manufacturers' preference for packaging that combines effective preservation with operational efficiency and environmental responsibility is creating opportunities for innovative keg implementations. The rising influence of craft brewing culture and specialty beverage markets is also contributing to increased demand for kegs that can provide quality maintenance, brand differentiation, and reliable performance across diverse beverage types and serving environments.
The kegs market is poised for rapid growth and transformation. As industries across brewing, beverage production, wine making, and hospitality services seek packaging that delivers exceptional product preservation, dispensing reliability, and logistical efficiency, kegs are gaining prominence not just as commodity containers but as strategic enablers of beverage quality and commercial success.
Rising craft brewery establishment rates in North America and expanding hospitality sectors globally amplify demand, while manufacturers are leveraging innovations in lightweight materials, smart tracking technologies, and automated handling systems.
Pathways like IoT-enabled smart kegs, composite material innovations, and application-specific customization promise strong margin uplift, especially in premium segments. Geographic expansion and vertical integration will capture volume, particularly where local brewing capabilities and distribution network efficiency are critical. Regulatory pressures around packaging reuse requirements, deposit return systems, beverage safety standards, and quality preservation give structural support.
The market is segmented by material type, capacity, beverage type, end-use, distribution channel, and region. By material type, the market is divided into stainless steel, plastic/polymer, and others. By capacity, it covers up to 20 liters, 20-30 liters, 30-50 liters, and above 50 liters. By beverage type, the market is segmented into beer & ale, wine, soft drinks & soda, coffee & cold brew, and others. The end-use includes breweries & beverage producers, bars & restaurants, stadiums & events, and others. By distribution channel, it is categorized into direct sales, distributors, and rental/pooling services. Regionally, the market is divided into North America, Europe, East Asia, South Asia & Pacific, Latin America, and the Middle East & Africa.
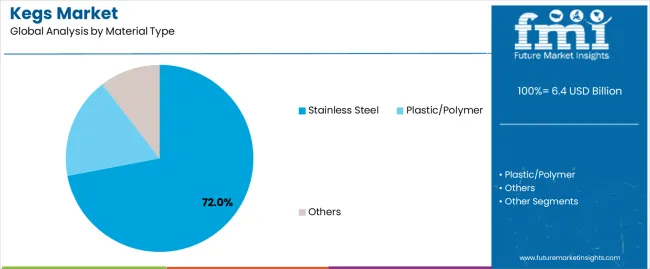
The stainless steel segment is projected to account for 72% of the kegs market in 2025, reaffirming its position as the leading material category. Breweries and beverage producers increasingly utilize stainless steel kegs for their superior durability when subjected to repeated cleaning cycles, excellent pressure resistance characteristics, and long service life in applications ranging from craft beer distribution to commercial beverage dispensing. Stainless steel keg technology's advanced welding capabilities and consistent quality standards directly address the industrial requirements for reliable beverage containment in high-pressure carbonated applications.
This material segment forms the foundation of modern beverage distribution operations, as it represents the keg type with the greatest longevity and established market acceptance across multiple beverage categories and commercial sectors. Manufacturer investments in automated welding technologies and surface treatment processes continue to strengthen adoption among breweries and beverage distributors. With companies prioritizing asset longevity and total cost of ownership, stainless steel kegs align with both operational reliability requirements and economic efficiency objectives, making them the central component of comprehensive beverage packaging strategies.
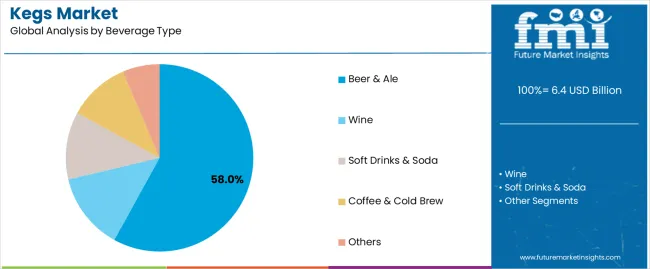
Beer & ale applications are projected to represent 58% of keg demand in 2025, underscoring their critical role as the primary industrial consumers of draft packaging systems for brewery operations, pub distribution, and commercial beverage service. Breweries prefer kegs for their exceptional carbonation retention capabilities, product freshness preservation, and ability to maintain flavor profiles while ensuring consistent draft quality. Positioned as essential packaging formats for modern brewing operations, kegs offer both quality advantages and logistical benefits.
The segment is supported by continuous innovation in keg valve technologies and the growing availability of specialized designs that enable improved cleaning efficiency with enhanced dispensing performance and extended product shelf life. Craft breweries are investing in keg fleet expansion to support growing taproom sales and distribution reach. As craft beer culture becomes more prevalent and consumer preference for draft beverages increases, beer & ale applications will continue to dominate the end-use market while supporting advanced keg utilization and quality preservation strategies.
The kegs market is advancing rapidly due to increasing demand for draft beverage systems and growing adoption of returnable packaging solutions that provide superior product preservation and quality maintenance while enabling efficient bulk distribution across diverse brewery and hospitality applications. The market faces challenges, including high initial capital investment requirements, keg fleet management complexities, and the need for specialized cleaning and maintenance infrastructure. Innovation in lightweight materials and smart tracking technologies continues to influence product development and market expansion patterns.
The growing adoption of RFID tags, GPS tracking modules, and IoT-enabled monitoring systems is enabling manufacturers to produce smart kegs with superior fleet management capabilities, real-time location tracking, and predictive maintenance functionalities. Advanced tracking systems provide improved asset utilization while allowing more efficient inventory management and consistent performance monitoring across various distribution networks and service locations. Breweries are increasingly recognizing the competitive advantages of smart keg capabilities for loss prevention and operational optimization.
Modern keg manufacturers are incorporating automated valve designs, quick-connect fittings, and sensor-compatible features to enhance cleaning efficiency, enable rapid filling operations, and deliver value-added solutions to brewery and beverage production customers. These technologies improve production throughput while enabling new operational capabilities, including CIP (Clean-in-Place) compatibility, automated quality verification, and reduced contamination risk. Advanced automation integration also allows manufacturers to support large-scale production operations and quality assurance beyond traditional manual handling approaches.
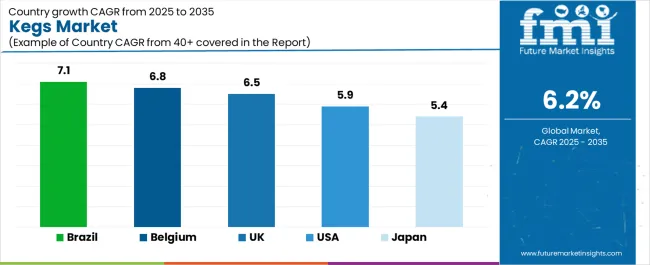
| Country | CAGR (2025–2035) |
|---|---|
| Germany | 7.8% |
| China | 8.4% |
| USA | 5.9% |
| UK | 6.5% |
| Brazil | 7.1% |
| Japan | 5.4% |
| Belgium | 6.8% |
The kegs market is experiencing strong growth globally, with China leading at an 8.4% CAGR through 2035, driven by the expanding craft brewing sector, growing beer consumption, and significant investment in brewery infrastructure development. Germany follows at 7.8%, supported by strong brewing tradition, increasing export beer production, and growing premium draft beverage capabilities. Brazil records 7.1%, focusing on expanding beer market and growing hospitality sector development. Belgium shows growth at 6.8%, emphasizing specialty beer production and craft brewing excellence. The UK demonstrates 6.5% growth, prioritizing pub industry modernization and draft beverage innovation. The USA exhibits 5.9% growth, supported by established craft brewery ecosystem and growing draft beverage consumption. Japan shows 5.4% growth, emphasizing precision brewing and quality keg production.
The report covers an in-depth analysis of 40+ countries, with top-performing countries highlighted below.
Revenue from kegs in China is projected to exhibit exceptional growth with a CAGR of 8.4% through 2035, driven by rapidly expanding craft brewery establishments and growing draft beer consumption supported by urbanization trends and rising disposable incomes. The country's strong position in beverage production and increasing investment in brewery infrastructure are creating substantial demand for modern keg solutions. Major brewery chains and craft beer producers are establishing comprehensive keg fleet capabilities to serve both domestic consumption demand and growing export markets.
Demand for kegs in Germany is expanding at a CAGR of 7.8%, supported by the country's renowned brewing industry, expanding export beer production, and increasing adoption of advanced keg technologies. The country's brewing heritage and growing emphasis on quality standards are driving requirements for sophisticated keg fleet management capabilities. International brewery groups and regional craft producers are establishing extensive keg infrastructure to address the growing demand for premium draft beverages.
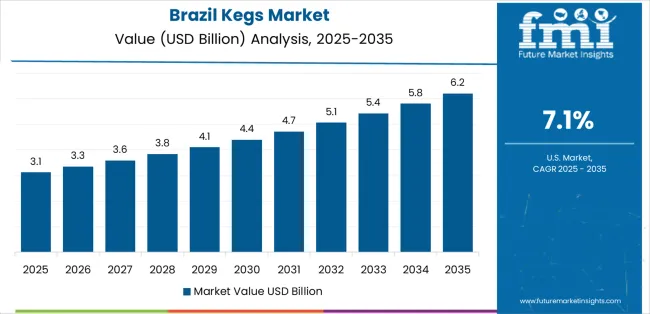
Revenue from kegs in Brazil is growing at a CAGR of 7.1%, driven by the country's expanding beer consumption, growing bar and restaurant sector, and increasing investment in brewery capacity development. Brazil's large consumer base and vibrant hospitality culture are supporting demand for keg systems across multiple distribution segments. Manufacturers are establishing comprehensive production capabilities to serve the growing domestic market and regional distribution opportunities.
Demand for kegs in Belgium is expected to expand at a CAGR of 6.8%, supported by the country's specialty beer tradition, advanced brewing capabilities, and strategic focus on premium draft beverages. Belgium's brewing excellence and export market strength are driving demand for kegs in craft beer production, abbey beer distribution, and specialty beverage applications. Manufacturers are investing in comprehensive quality systems to serve both domestic specialty brewers and international export markets.
Revenue from kegs in the UK is expanding at a CAGR of 6.5%, supported by the country's established pub culture, strong emphasis on cask and keg ale traditions, and robust demand for draft beverage systems in hospitality applications. The nation's extensive pub network and evolving consumer preferences are driving sophisticated keg system adoption throughout the beverage supply chain. Leading manufacturers and technology providers are investing extensively in one-way kegs and smart tracking solutions to serve both traditional and craft market segments.
Demand for kegs in the USA is growing at a CAGR of 5.9%, driven by the country's mature craft brewery sector, extensive draft beverage infrastructure, and strong position in brewing innovation. America's established keg distribution networks and commitment to beverage variety are supporting investment in advanced keg technologies throughout major brewing regions. Industry leaders are establishing comprehensive fleet management systems to serve diverse brewery sizes and distribution requirements.
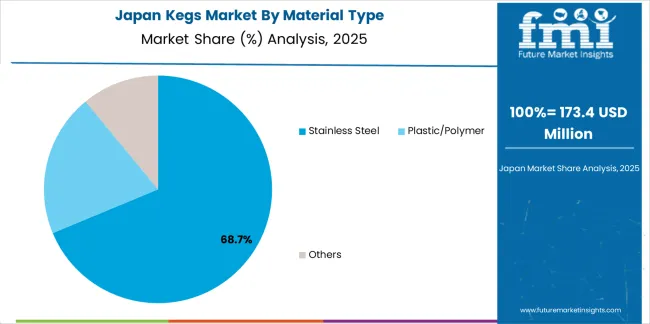
Revenue from kegs in Japan is anticipated to grow at a CAGR of 5.4%, supported by the country's expertise in precision manufacturing, emphasis on quality standards, and growing craft beer market development. Japan's technological capabilities and commitment to product excellence are driving demand for high-quality kegs in domestic brewery operations, import beer distribution, and specialty beverage applications. Leading manufacturers are investing in advanced production technologies to serve stringent quality requirements of domestic beverage producers.
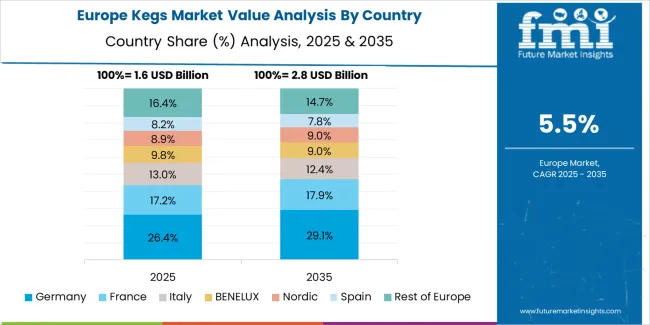
The kegs market in Europe is projected to grow from USD 2.1 billion in 2025 to USD 3.9 billion by 2035, registering a CAGR of 6.4% over the forecast period. Germany is expected to maintain its leadership position with a 28.0% market share in 2025, declining slightly to 27.5% by 2035, supported by its strong brewing industry tradition, extensive brewery infrastructure, and comprehensive draft beverage distribution networks serving diverse keg applications across Europe.
The United Kingdom follows with a 18.5% share in 2025, projected to reach 19.0% by 2035, driven by robust demand for kegs in pub operations, cask ale distribution, and craft brewery applications, combined with established logistics infrastructure and draft system expertise. Belgium holds a 12.5% share in 2025, expected to reach 13.0% by 2035, supported by specialty beer production and premium beverage focus. The Netherlands commands a 11.0% share in 2025, projected to reach 11.3% by 2035, while France accounts for 9.5% in 2025, expected to reach 9.7% by 2035. Poland maintains a 5.0% share in 2025, growing to 5.3% by 2035. The Rest of Europe region, including Czech Republic, Austria, Spain, Italy, and other nations, is anticipated to maintain momentum, with its collective share moving from 15.5% to 14.2% by 2035, attributed to increasing craft brewery establishment in Eastern Europe and growing draft beverage consumption in Mediterranean countries implementing modern keg distribution programs.
The Kegs Market is evolving steadily as breweries, beverage producers, and draft distribution networks prioritize durable, hygienic, and reusable container solutions. The growth of craft breweries, rising global beer consumption, and expanding cold-chain logistics continue to drive the adoption of stainless steel and lightweight PET kegs. At the same time, sustainability initiatives are pushing producers toward reusable packaging formats that reduce waste and lower lifecycle costs.
Blefa GmbH, Schaefer Container Systems, and THIELMANN – The Container Company remain the most influential players in the stainless-steel keg segment, known for manufacturing high-precision, long-life containers designed for breweries of every scale. Their focus on traceability, safety features, and global servicing networks keeps them central to commercial draft ecosystems.
In North America, American Keg Company strengthens domestic supply with U.S.-made stainless kegs, supporting craft brewers seeking local sourcing. Companies such as NDL Keg, Shinhan Industrial Co., Ltd., and Ningbo BestFriends Beverage Container are expanding rapidly in Asia, offering cost-competitive stainless and hybrid keg formats to meet the rising demand from small and mid-sized breweries worldwide.
The single-use and lightweight PET keg segment is shaped by innovators like Petainer and Dolium, whose recyclable, easy-handling designs offer logistical advantages for export markets, events, and small-batch producers. As global beer, cider, and kombucha markets diversify, keg manufacturers are increasingly focused on smart tagging, improved sanitation features, and lifecycle efficiency to meet the needs of modern beverage distribution.
| Item | Value |
|---|---|
| Quantitative Units (2025) | USD 6.4 billion |
| Material Type | Stainless Steel, Plastic/Polymer, Others |
| Capacity | Up to 20 Liters; 20–30 Liters; 30–50 Liters; Above 50 Liters |
| Beverage Type | Beer & Ale; Wine; Soft Drinks & Soda; Coffee & Cold Brew; Others |
| End-Use | Breweries & Beverage Producers; Bars & Restaurants; Stadiums & Events; Others |
| Distribution Channels | Direct Sales; Distributors; Rental/Pooling Services |
| Regions | North America; Europe; East Asia; South Asia & Pacific; Latin America; Middle East & Africa |
| Key Countries | United States, Canada, United Kingdom, Germany, France, China, Japan, South Korea, India, Brazil, Australia, and 40+ others |
| Key Companies | Blefa GmbH, Schaefer Container Systems, THIELMANN – The Container Company, American Keg Company, NDL Keg, Petainer, Dolium, Ningbo BestFriends Beverage Container, Shinhan Industrial Co., Ltd., Schäfer Container Systems |
| Additional Attributes | Dollar sales by material type & beverage category; Regional demand trends; Competitive landscape; Technological advancements in keg tracking systems; Valve design development; Fleet management innovation; Brewery supply chain integration |
The global kegs market is estimated to be valued at USD 6.4 billion in 2025.
The market size for the kegs market is projected to reach USD 11.7 billion by 2035.
The kegs market is expected to grow at a 6.2% CAGR between 2025 and 2035.
The key product types in kegs market are stainless steel , plastic/polymer and others.
In terms of beverage type, beer & ale segment to command 58.0% share in the kegs market in 2025.


Our Research Products

The "Full Research Suite" delivers actionable market intel, deep dives on markets or technologies, so clients act faster, cut risk, and unlock growth.

The Leaderboard benchmarks and ranks top vendors, classifying them as Established Leaders, Leading Challengers, or Disruptors & Challengers.

Locates where complements amplify value and substitutes erode it, forecasting net impact by horizon

We deliver granular, decision-grade intel: market sizing, 5-year forecasts, pricing, adoption, usage, revenue, and operational KPIs—plus competitor tracking, regulation, and value chains—across 60 countries broadly.

Spot the shifts before they hit your P&L. We track inflection points, adoption curves, pricing moves, and ecosystem plays to show where demand is heading, why it is changing, and what to do next across high-growth markets and disruptive tech

Real-time reads of user behavior. We track shifting priorities, perceptions of today’s and next-gen services, and provider experience, then pace how fast tech moves from trial to adoption, blending buyer, consumer, and channel inputs with social signals (#WhySwitch, #UX).

Partner with our analyst team to build a custom report designed around your business priorities. From analysing market trends to assessing competitors or crafting bespoke datasets, we tailor insights to your needs.
Supplier Intelligence
Discovery & Profiling
Capacity & Footprint
Performance & Risk
Compliance & Governance
Commercial Readiness
Who Supplies Whom
Scorecards & Shortlists
Playbooks & Docs
Category Intelligence
Definition & Scope
Demand & Use Cases
Cost Drivers
Market Structure
Supply Chain Map
Trade & Policy
Operating Norms
Deliverables
Buyer Intelligence
Account Basics
Spend & Scope
Procurement Model
Vendor Requirements
Terms & Policies
Entry Strategy
Pain Points & Triggers
Outputs
Pricing Analysis
Benchmarks
Trends
Should-Cost
Indexation
Landed Cost
Commercial Terms
Deliverables
Brand Analysis
Positioning & Value Prop
Share & Presence
Customer Evidence
Go-to-Market
Digital & Reputation
Compliance & Trust
KPIs & Gaps
Outputs
Full Research Suite comprises of:
Market outlook & trends analysis
Interviews & case studies
Strategic recommendations
Vendor profiles & capabilities analysis
5-year forecasts
8 regions and 60+ country-level data splits
Market segment data splits
12 months of continuous data updates
DELIVERED AS:
PDF EXCEL ONLINE
Leading Providers & Market Share in Kegs
Plastic Kegs Market

Thank you!
You will receive an email from our Business Development Manager. Please be sure to check your SPAM/JUNK folder too.
Chat With
MaRIA