Reports

- Global Locations -

Headquarters

Future Market Insights, Inc.

Christiana Corporate, 200
Continental Drive, Suite 401,
Newark, Delaware - 19713,
United States

T: +1-845-579-5705

Americas

Future Market Insights, Inc.

616 Corporate Way, Suite 2-9018,
Valley Cottage, NY 10989, United States

T: +1-347-918-3531

MEA

Future Market Insights

1602-6 Jumeirah Bay X2 Tower, Plot No: JLT-PH2-X2A,
Jumeirah Lakes Towers, Dubai,
United Arab Emirates

Europe

Future Market Insights

3rd Floor, 207 Regent Street,
W1B 3HH London
United Kingdom

T: + 44 (0) 20 8123 9659
D: +44 (0) 20 3287 4268

Asia Pacific

Future Market Insights

IndiaLand Global Tech Park, Unit UG-1, Behind Grand HighStreet, Phase 1, Hinjawadi, MH, Pune – 411057, India

Global Macadamia Market Overview

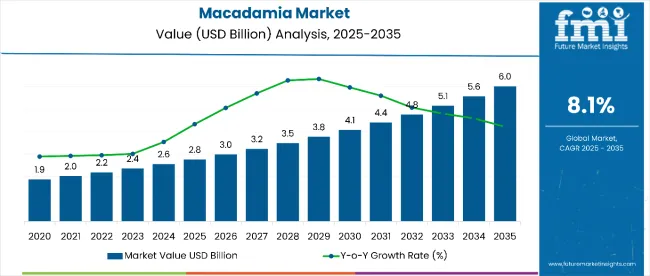
The global macadamia market size was valued at US$ 2.2 billion in 2022. In 2023, the net revenue from total sales of macadamia is estimated to be around US$ 2.37 billion. Over the forecasted years, the overall market value is expected to expand at a compound annual growth rate (CAGR) of 11.2%. By the end of the forecast period 2033, this value is projected to reach an estimated US$ 5.08 billion.

Macadamia Market Trend Analysis

  • Evolving consumer trends toward healthy snack alternatives
  • High levels of monounsaturated fats and other critical elements
  • Adaptability in several culinary applications ranging from baked foods to confectionary
  • The emergence of new market players taking up macadamia cultivation outside Australia's mainland.
Report Attribute Details
Macadamia Market Size (2023) US$ 2.37 billion
Market Anticipated Forecast Value (2033) US$ 5.08 billion
Market Projected Growth Rate (2023 to 2033) 11.2%

Some New Developments that Have Taken Place in the Market Include:

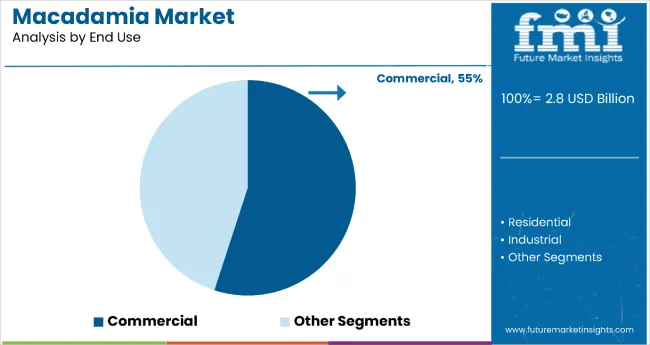
  • The industrial segment is the key growing segment of the market and is estimated to hold around forty-two percent of the market value share. However, demand for these was low in the first two quarters of 2021 and rose in the first quarter of 2022. It is expected to gain momentum in the market in the coming years due to nut application in bakery and confectionery products
  • Based on nature type, the organic segment is expected to boost the market growth in the coming assessment period and is expected to continue its dominance soon, followed by the conventional segment.
  • South Asia is expected to emerge as the key region for the macadamia market owing to several end-use industries where consumption of macadamia is high.
  • Furthermore, East Asia is estimated to collectively hold more than one-third of the market value share in the global market. Companies in these regions plan to implement vertical integration to counter rising raw material prices.

Don't pay for what you don't need

Customize your report by selecting specific countries or regions and save 30%!

Global Macadamia Market Historical Analysis (2018 to 2022) Vs. Forecast Outlook (2023 to 2033)

FMI presents a half-yearly comparison analysis and review of the market growth rates and further development prospects in the global market. Certain demographic and innovation factors predominantly influence the market under the subjective impact of macro and industry factors.

Particulars Details
H1 2021 11.1%
H1 2022 Projected 11.2%
H1 2022 Expected 12.3%
BPS Change - 123.2 ↓

The global market for macadamia has witnessed H1 2021 growth at a magnitude of 11.1%. However, this growth is only evenly spread across some regions, with the developing markets recording higher growth rates of 12.3%. Thus leaving the gap of -123.2 BPS points between expected and projected growth during H1 2022.

Key reasons for this change in growth rate are attributed to slow/rapid uptake of the market during the first half of the forecast period owing to improving end-user demand in key economies and their booming populations.

In particular, the macadamia market in India and China are both seeing an increase in their consumption pattern, resulting in increased demand for the macadamia market. Additionally, many other market segments are expected to perform fairly and attain promising growth prospects in the next half of the projection period.

Despite these positive prospects, some likely challenges stay ahead for the industry, including shifts in consumer preferences, stringent trade barriers, and a low degree of security in raw material supply and other manufacturing inputs.

Constant Demand for Dried Fruits and Nuts to Fuel Demand for Macadamia

Over the previous decade, global consumption of macadamia nuts has climbed by 80%, owing mostly to the increase in consumption of nuts and dried fruits. Over the previous ten years, total tree nut consumption has increased by 60%, the fastest rate in recent memory.

Pecans (70%), cashews (60%), and macadamia (59%) were the tree nuts that grew the most in the last ten years, followed by almonds.

The increased public awareness of the health benefits of nuts and dried fruits has been a key driver of industry growth. Macadamia nuts are also used to manufacture macadamia oil, which has grown in popularity among businesses and consumers alike.

Global demand for healthy and nutritious snacks has risen significantly in recent years, particularly among the younger generation and the working-class population.

Nandini Roy Choudhury

Principal Consultant

Talk to Analyst

Find your sweet spots for generating winning opportunities in this market.

Driving Macadamia nuts market as a substitute for meat products

People are also shifting their protein consumption away from non-vegetarian sources and toward plant-based alternatives. Macadamia nuts are the best option to meet one's daily protein and fat requirements without consuming any animal protein. Customers can keep to their vegan diets while avoiding lactose sensitivity as a result of this.

According to a poll conducted by Beijing-based think tank EO Intelligence, up to 71% of consumers surveyed believe snacks are equally crucial to their physical and mental well-being. Nearly 85% of millennials, the primary buyers of healthy snacks on the market, place a premium on the freshness and health advantages of the vegetarian diet.

Comparative View of Adjacent Macadamia Market

In this section, we have explored the emerging trends and diversification of the macadamia market. For comparison of different markets, growth forecasts have been considered during a specific period, i.e., from 2023 to 2033.

Organic macadamia is becoming more popular, with demand primarily coming from European countries. Processed macadamia nuts' widespread use in several industrial categories, such as the food and beverage industry and the cosmetics and personal care industry, is also boosting its global market share. The world's leading macadamia-producing regions are Australia, Hawaii in the United States, and South Africa.

Macadamia Market:

Attributes Macadamia Market
CAGR (2023 to 2033) 11.2%
Market Value (2023) US$ 2.37 billion
Growth Factor Growing popularity of macadamia in Western countries
Future Opportunities Production of macadamia in tropical climates through precision agriculture
Market Trends Emergence of new participants for sales of macadamia over online sales channel.

Macadamia Milk Market:

Attributes Macadamia Milk Market
CAGR (2023 to 2033) 5.4%
Market Value (2023) US$ 39.1 million
Growth Factor Rising global trends towards vegan or plant-based food ingredients.
Future Opportunities Increasing applications of macadamia milk in the cosmetics industry, besides food & beverages.
Market Trends Leading market players are focusing more on European countries due to the rising consumption of macadamia products.

Macadamia Butter Market:

Attributes Macadamia Butter Market
CAGR (2023 to 2033) 5.9%
Market Value (2023) US$ 1.69 billion
Growth Factor Consumers worldwide shifting their focus to healthier alternatives has increased the demand for functional food and natural health products.
Future Opportunities The growing appeal of food products with butter ingredients in the conventional food & beverage sector.
Market Trends All-natural macadamia butter sales free of stabilizers are in greater demand.

Get the data you need at a Fraction of the cost

Personalize your report by choosing insights you need
and save 40%!

Country-wise analysis

Regional Markets 2023 Value Share in the Global Market
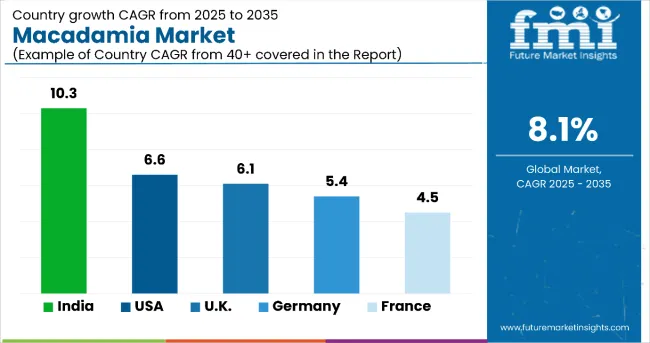
United States 24.4%
China 13.2%
Germany 7.4%
Australia 3.2%
Japan 5.4%

Australia is the World’s Leading Producer and Exporter of Macadamia Nuts

The macadamia nut industry in Australia comprises over 6 million trees and a plantation area of over 16,000 hectares. More than 850 Australian growers support macadamia nut production.

This is critical in meeting the increased demand for macadamia nuts worldwide. By negotiating an arrangement to supply high-quality macadamia nuts, firms have attractive options for high-quality source nuts from these growers. This strategic step may ensure the producers have a consistent supply of macadamia nuts.

These nuts are also exported from Australia to more than 40 nations worldwide. The popularity of macadamia nuts has grown due to customer demand for natural ingredients in food, cosmetics, and personal care goods. For instance, the United States is a valuable importer of macadamia nuts, contributing to nearly 24.4% of the global revenue.

Incorporation of Macadamia Nuts in Chinese Culture and its Demand

China is the main export market for macadamia nuts from Australia, accounting for 36% of total exports. Because of the goods' well-known health advantages - information derived from Traditional Chinese Medicine - nuts are a significant element of the Chinese diet. Similarly, Macadamia nuts are common gifts exchanged during Chinese New Year because of their positive image and the fact that they can be shared and devoured by everybody during the celebration.

The Healthy Snacking Trend in Germany is Driving the Trend for Macadamia Nuts

Germany is a key transit country for macadamia nuts imported from other countries. Germany re-exports around one-quarter of all imported macadamia nuts to other European markets every year. Specialized dealers and agents, many of whom are based in Hamburg, handle the re-export business.

The healthy snacking trend in Germany has increased the consumption of macadamia nuts. Until recently, the macadamia nut was mostly marketed in Germany as a high-end roasted and salty snack. Macadamia nuts, on the other hand, are becoming more popular as an ingredient, particularly in spreads (such as Vitaquell or Nutfield's) and as an ice cream topping. Organic macadamia nut consumption is also rising in Germany, thanks to promotions by specialized suppliers like the German-Kenyan macadamia nut enterprise.

The Emerging Market of the United Kingdom in the Macadamia Market

The United Kingdom is Europe's third-leading importer of macadamia nuts and its fifth-leading consumer. The United Kingdom re-exports only a small percentage of imported macadamia nuts. The United Kingdom is a net importer of macadamia nuts, with the vast majority of those imported being consumed domestically.

With only a few direct importers, the United Kingdom market for macadamia nuts is still emerging. Macadamia nuts are mostly sold as snacks, but a few businesses also make macadamia nut fruit and nut bars. Other firms utilize nuts as an ice cream topping. C.G. Hacking & Sons and Free World Trading are two examples of importers. Green Farms Nut Company, a Macadamia Nut exporter from South Africa, opened a London sales office.

Category-wise Insights

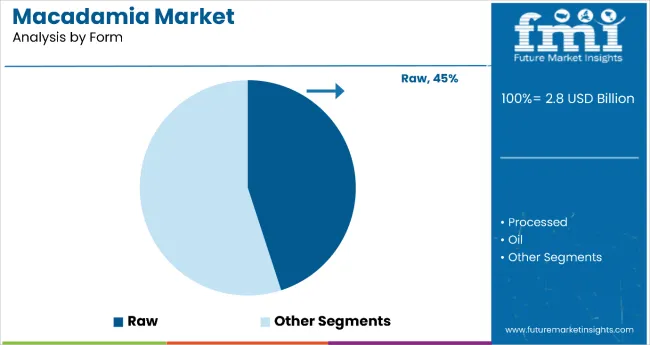
The global macadamia market's raw, roasted, and coated segments can be further classified based on product type. Due to its cost-effectiveness, the raw sector had the highest share in 2022. Raw macadamia nuts are frequently utilized in the preparation of skin-renewing and moisturizing treatments, as well as in a variety of meals.

Rising Demand for Raw Macadamia in the Food and Beverage Industries

Attributes Details
Top Product Type In-shell
Market Share in 2023 60.7%

The global macadamia market is naturally divided into organic and conventional segments, with the latter accounting for the majority of market value. In-shell macadamia currently drives the macadamia nuts market growth due to the rising trend of organic food products. Expansion of the macadamia nut oil thrive market is also a leading factor for the growth of this segment.

Easy Availability of Taste Options and Trustworthiness in Supermarkets

Attributes Details
Top Form Type Processed
Market Share in 2023 42.6%

The global market for macadamia nuts is divided into raw, processed, and oil. Among them, the processed segment is anticipated to account for nearly 42.6% of the worldwide macadamia market in value.

Supermarkets, online stores, convenience stores, and others are the different distribution channels in which the global macadamia market may be classified. Due to the increased investment by key companies, expanding demand for convenience goods, and a one-stop shopping experience, the supermarket segment held the most share in 2022.

Competitive landscape

Companies have used various growth strategies to gain a competitive advantage, including mergers and acquisitions, capacity expansions, internet presence strengthening, and new product introductions. For example, health and Plant Protein Group Limited has declared plans to enter the fast-growing plant-based food alternatives market.

Advances and new techniques have helped the macadamia nut sector. Several product introductions have broadened the industry's consumer base in recent years while increasing market competition.

The key players in the market are

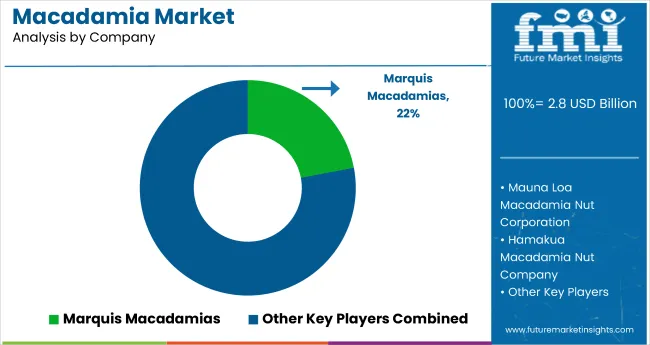
  • Marquis Macadamias
  • Golden Macadamias
  • Mauna Loa Macadamia Nut Corp
  • Buderim Group
  • Kenya Nut Company
  • Nambucca Macnuts
  • Ivory Macadamias
  • Eastern Produce
  • Hamakua Macadamia Nut Company

Scope of Report

Attribute Details
Macadamia Market Size Value in 2023 US$ 2.37 billion
Macadamia Market Forecast Value in 2033 US$ 5.08 billion
Global Growth Rate (2023 to 2033) 11.2%
Forecast Period 2023 to 2033
Historical Data Available for 2018 to 2022
Market Analysis US$ billion for Value
Key regions covered North America, Latin America, Europe, South Asia, East Asia, Oceania and the Middle East & Africa
Key Countries Covered Australia, United States, Canada, Brazil, South Africa, Mexico, Argentina, Germany, France, Spain, United Kingdom, BENELUX, Thailand, Indonesia, Malaysia, China, Japan, South Korea, Australia, New Zealand, GCC, Northern Africa & Southern Africa
Key Segments Covered Product, Application.
Key Companies Profiled
  • Marquis Macadamias
  • Golden Macadamias
  • Mauna Loa Macadamia Nut Corp
  • Buderim Group
  • Ivory Macadamias
  • Eastern Produce
  • Hamakua Macadamia Nut Company
Customization & Pricing Available upon Request

The Market has been Segmented as

By Nature:

  • Organic
  • Conventional

By Form:

  • Raw
  • Processed
  • Oil

By End Use:

  • Residential
  • Commercial
  • Industrial
  • Food Industry
    • Confectionery
    • Bakery
    • Dairy
    • Snacks
    • Others
  • Cosmetic and Personal Care

By Distribution Channel:

  • Direct
  • Indirect

Frequently Asked Questions

How Big is the Macadamia Market?

The overall market is estimated to be around US$ 2.37 billion in 2023.

Who are the Market Leaders in the Macadamia Business?

Marquis, Buderim, and Golden Macadamias are some leading market players.

What is the Projected Growth Rate for Sales of Macadamia Worldwide?

The global sales of macadamia are projected to follow 11.2% CAGR through 2033.

Which is the Most Preferred Form of Macadamia by Consumers?

The processed macadamia market segment contributed 42.6% of revenue in 2022.

What are the Emerging Trends in the Macadamia Industry?

Emerging applications of macadamia in cosmetic products are a recent trend.

Which is the Leading Country for Processing of Macadamia Nuts?

China is the leading country, with an estimated global market share of 13.2% in 2023.

Table of Content

1. Executive Summary

    1.1. Global Market Outlook

    1.2. Demand-side Trends

    1.3. Supply-side Trends

    1.4. Technology Roadmap Analysis

    1.5. Analysis and Recommendations

2. Market Overview

    2.1. Market Coverage / Taxonomy

    2.2. Market Definition / Scope / Limitations

3. Market Background

    3.1. Market Dynamics

        3.1.1. Drivers

        3.1.2. Restraints

        3.1.3. Opportunity

        3.1.4. Trends

    3.2. Scenario Forecast

        3.2.1. Demand in Optimistic Scenario

        3.2.2. Demand in Likely Scenario

        3.2.3. Demand in Conservative Scenario

    3.3. Opportunity Map Analysis

    3.4. Product Life Cycle Analysis

    3.5. Supply Chain Analysis

        3.5.1. Supply Side Participants and their Roles

            3.5.1.1. Producers

            3.5.1.2. Mid-Level Participants (Traders/ Agents/ Brokers)

            3.5.1.3. Wholesalers and Distributors

        3.5.2. Value Added and Value Created at Node in the Supply Chain

        3.5.3. List of Raw Material Suppliers

        3.5.4. List of Existing and Potential Buyer’s

    3.6. Investment Feasibility Matrix

    3.7. Value Chain Analysis

        3.7.1. Profit Margin Analysis

        3.7.2. Wholesalers and Distributors

        3.7.3. Retailers

    3.8. PESTLE and Porter’s Analysis

    3.9. Regulatory Landscape

        3.9.1. By Key Regions

        3.9.2. By Key Countries

    3.10. Regional Parent Market Outlook

    3.11. Production and Consumption Statistics

    3.12. Import and Export Statistics

4. Global Market Analysis 2018 to 2022 and Forecast, 2023 to 2033

    4.1. Historical Market Size Value (US$ Million) & Volume (Tons) Analysis, 2018 to 2022

    4.2. Current and Future Market Size Value (US$ Million) & Volume (Tons) Projections, 2023 to 2033

        4.2.1. Y-o-Y Growth Trend Analysis

        4.2.2. Absolute $ Opportunity Analysis

5. Global Market Analysis 2018 to 2022 and Forecast 2023 to 2033, By Nature

    5.1. Introduction / Key Findings

    5.2. Historical Market Size Value (US$ Million) & Volume (Tons) Analysis By Nature, 2018 to 2022

    5.3. Current and Future Market Size Value (US$ Million) & Volume (Tons) Analysis and Forecast By Nature, 2023 to 2033

        5.3.1. Organic

        5.3.2. Conventional

    5.4. Y-o-Y Growth Trend Analysis By Nature, 2018 to 2022

    5.5. Absolute $ Opportunity Analysis By Nature, 2023 to 2033

6. Global Market Analysis 2018 to 2022 and Forecast 2023 to 2033, By Form

    6.1. Introduction / Key Findings

    6.2. Historical Market Size Value (US$ Million) & Volume (Tons) Analysis By Form, 2018 to 2022

    6.3. Current and Future Market Size Value (US$ Million) & Volume (Tons) Analysis and Forecast By Form, 2023 to 2033

        6.3.1. Raw

        6.3.2. Processed

        6.3.3. Oil

    6.4. Y-o-Y Growth Trend Analysis By Form, 2018 to 2022

    6.5. Absolute $ Opportunity Analysis By Form, 2023 to 2033

7. Global Market Analysis 2018 to 2022 and Forecast 2023 to 2033, By End Use

    7.1. Introduction / Key Findings

    7.2. Historical Market Size Value (US$ Million) & Volume (Tons) Analysis By End Use, 2018 to 2022

    7.3. Current and Future Market Size Value (US$ Million) & Volume (Tons) Analysis and Forecast By End Use, 2023 to 2033

        7.3.1. Residential

        7.3.2. Commercial

        7.3.3. Industrial

        7.3.4. Food Industry

            7.3.4.1. Confectionery

            7.3.4.2. Bakery

            7.3.4.3. Dairy

            7.3.4.4. Snacks

            7.3.4.5. Others

        7.3.5. Cosmetic and Personal Care

    7.4. Y-o-Y Growth Trend Analysis By End Use, 2018 to 2022

    7.5. Absolute $ Opportunity Analysis By End Use, 2023 to 2033

8. Global Market Analysis 2018 to 2022 and Forecast 2023 to 2033, By Distribution Channel

    8.1. Introduction / Key Findings

    8.2. Historical Market Size Value (US$ Million) & Volume (Tons) Analysis By Distribution Channel, 2018 to 2022

    8.3. Current and Future Market Size Value (US$ Million) & Volume (Tons) Analysis and Forecast By Distribution Channel, 2023 to 2033

        8.3.1. Direct

        8.3.2. Indirect

    8.4. Y-o-Y Growth Trend Analysis By Distribution Channel, 2018 to 2022

    8.5. Absolute $ Opportunity Analysis By Distribution Channel, 2023 to 2033

9. Global Market Analysis 2018 to 2022 and Forecast 2023 to 2033, By Region

    9.1. Introduction

    9.2. Historical Market Size Value (US$ Million) & Volume (Tons) Analysis By Region, 2018 to 2022

    9.3. Current Market Size Value (US$ Million) & Volume (Tons) Analysis and Forecast By Region, 2023 to 2033

        9.3.1. North America

        9.3.2. Latin America

        9.3.3. Western Europe

        9.3.4. Eastern Europe

        9.3.5. South Asia and Pacific

        9.3.6. East Asia

        9.3.7. Middle East and Africa

    9.4. Market Attractiveness Analysis By Region

10. North America Market Analysis 2018 to 2022 and Forecast 2023 to 2033, By Country

    10.1. Historical Market Size Value (US$ Million) & Volume (Tons) Trend Analysis By Market Taxonomy, 2018 to 2022

    10.2. Market Size Value (US$ Million) & Volume (Tons) Forecast By Market Taxonomy, 2023 to 2033

        10.2.1. By Country

            10.2.1.1. The USA

            10.2.1.2. Canada

        10.2.2. By Nature

        10.2.3. By Form

        10.2.4. By End Use

        10.2.5. By Distribution Channel

    10.3. Market Attractiveness Analysis

        10.3.1. By Country

        10.3.2. By Nature

        10.3.3. By Form

        10.3.4. By End Use

        10.3.5. By Distribution Channel

    10.4. Key Takeaways

11. Latin America Market Analysis 2018 to 2022 and Forecast 2023 to 2033, By Country

    11.1. Historical Market Size Value (US$ Million) & Volume (Tons) Trend Analysis By Market Taxonomy, 2018 to 2022

    11.2. Market Size Value (US$ Million) & Volume (Tons) Forecast By Market Taxonomy, 2023 to 2033

        11.2.1. By Country

            11.2.1.1. Brazil

            11.2.1.2. Mexico

            11.2.1.3. Rest of Latin America

        11.2.2. By Nature

        11.2.3. By Form

        11.2.4. By End Use

        11.2.5. By Distribution Channel

    11.3. Market Attractiveness Analysis

        11.3.1. By Country

        11.3.2. By Nature

        11.3.3. By Form

        11.3.4. By End Use

        11.3.5. By Distribution Channel

    11.4. Key Takeaways

12. Western Europe Market Analysis 2018 to 2022 and Forecast 2023 to 2033, By Country

    12.1. Historical Market Size Value (US$ Million) & Volume (Tons) Trend Analysis By Market Taxonomy, 2018 to 2022

    12.2. Market Size Value (US$ Million) & Volume (Tons) Forecast By Market Taxonomy, 2023 to 2033

        12.2.1. By Country

            12.2.1.1. Germany

            12.2.1.2. United Kingdom

            12.2.1.3. France

            12.2.1.4. Spain

            12.2.1.5. Italy

            12.2.1.6. Rest of Western Europe

        12.2.2. By Nature

        12.2.3. By Form

        12.2.4. By End Use

        12.2.5. By Distribution Channel

    12.3. Market Attractiveness Analysis

        12.3.1. By Country

        12.3.2. By Nature

        12.3.3. By Form

        12.3.4. By End Use

        12.3.5. By Distribution Channel

    12.4. Key Takeaways

13. Eastern Europe Market Analysis 2018 to 2022 and Forecast 2023 to 2033, By Country

    13.1. Historical Market Size Value (US$ Million) & Volume (Tons) Trend Analysis By Market Taxonomy, 2018 to 2022

    13.2. Market Size Value (US$ Million) & Volume (Tons) Forecast By Market Taxonomy, 2023 to 2033

        13.2.1. By Country

            13.2.1.1. Poland

            13.2.1.2. Russia

            13.2.1.3. Czech Republic

            13.2.1.4. Romania

            13.2.1.5. Rest of Eastern Europe

        13.2.2. By Nature

        13.2.3. By Form

        13.2.4. By End Use

        13.2.5. By Distribution Channel

    13.3. Market Attractiveness Analysis

        13.3.1. By Country

        13.3.2. By Nature

        13.3.3. By Form

        13.3.4. By End Use

        13.3.5. By Distribution Channel

    13.4. Key Takeaways

14. South Asia and Pacific Market Analysis 2018 to 2022 and Forecast 2023 to 2033, By Country

    14.1. Historical Market Size Value (US$ Million) & Volume (Tons) Trend Analysis By Market Taxonomy, 2018 to 2022

    14.2. Market Size Value (US$ Million) & Volume (Tons) Forecast By Market Taxonomy, 2023 to 2033

        14.2.1. By Country

            14.2.1.1. India

            14.2.1.2. Bangladesh

            14.2.1.3. Australia

            14.2.1.4. New Zealand

            14.2.1.5. Rest of South Asia and Pacific

        14.2.2. By Nature

        14.2.3. By Form

        14.2.4. By End Use

        14.2.5. By Distribution Channel

    14.3. Market Attractiveness Analysis

        14.3.1. By Country

        14.3.2. By Nature

        14.3.3. By Form

        14.3.4. By End Use

        14.3.5. By Distribution Channel

    14.4. Key Takeaways

15. East Asia Market Analysis 2018 to 2022 and Forecast 2023 to 2033, By Country

    15.1. Historical Market Size Value (US$ Million) & Volume (Tons) Trend Analysis By Market Taxonomy, 2018 to 2022

    15.2. Market Size Value (US$ Million) & Volume (Tons) Forecast By Market Taxonomy, 2023 to 2033

        15.2.1. By Country

            15.2.1.1. China

            15.2.1.2. Japan

            15.2.1.3. South Korea

        15.2.2. By Nature

        15.2.3. By Form

        15.2.4. By End Use

        15.2.5. By Distribution Channel

    15.3. Market Attractiveness Analysis

        15.3.1. By Country

        15.3.2. By Nature

        15.3.3. By Form

        15.3.4. By End Use

        15.3.5. By Distribution Channel

    15.4. Key Takeaways

16. Middle East and Africa Market Analysis 2018 to 2022 and Forecast 2023 to 2033, By Country

    16.1. Historical Market Size Value (US$ Million) & Volume (Tons) Trend Analysis By Market Taxonomy, 2018 to 2022

    16.2. Market Size Value (US$ Million) & Volume (Tons) Forecast By Market Taxonomy, 2023 to 2033

        16.2.1. By Country

            16.2.1.1. GCC Countries

            16.2.1.2. South Africa

            16.2.1.3. Israel

            16.2.1.4. Rest of MEA

        16.2.2. By Nature

        16.2.3. By Form

        16.2.4. By End Use

        16.2.5. By Distribution Channel

    16.3. Market Attractiveness Analysis

        16.3.1. By Country

        16.3.2. By Nature

        16.3.3. By Form

        16.3.4. By End Use

        16.3.5. By Distribution Channel

    16.4. Key Takeaways

17. Key Countries Market Analysis

    17.1. USA

        17.1.1. Pricing Analysis

        17.1.2. Market Share Analysis, 2022

            17.1.2.1. By Nature

            17.1.2.2. By Form

            17.1.2.3. By End Use

            17.1.2.4. By Distribution Channel

    17.2. Canada

        17.2.1. Pricing Analysis

        17.2.2. Market Share Analysis, 2022

            17.2.2.1. By Nature

            17.2.2.2. By Form

            17.2.2.3. By End Use

            17.2.2.4. By Distribution Channel

    17.3. Brazil

        17.3.1. Pricing Analysis

        17.3.2. Market Share Analysis, 2022

            17.3.2.1. By Nature

            17.3.2.2. By Form

            17.3.2.3. By End Use

            17.3.2.4. By Distribution Channel

    17.4. Mexico

        17.4.1. Pricing Analysis

        17.4.2. Market Share Analysis, 2022

            17.4.2.1. By Nature

            17.4.2.2. By Form

            17.4.2.3. By End Use

            17.4.2.4. By Distribution Channel

    17.5. Germany

        17.5.1. Pricing Analysis

        17.5.2. Market Share Analysis, 2022

            17.5.2.1. By Nature

            17.5.2.2. By Form

            17.5.2.3. By End Use

            17.5.2.4. By Distribution Channel

    17.6. United Kingdom

        17.6.1. Pricing Analysis

        17.6.2. Market Share Analysis, 2022

            17.6.2.1. By Nature

            17.6.2.2. By Form

            17.6.2.3. By End Use

            17.6.2.4. By Distribution Channel

    17.7. France

        17.7.1. Pricing Analysis

        17.7.2. Market Share Analysis, 2022

            17.7.2.1. By Nature

            17.7.2.2. By Form

            17.7.2.3. By End Use

            17.7.2.4. By Distribution Channel

    17.8. Spain

        17.8.1. Pricing Analysis

        17.8.2. Market Share Analysis, 2022

            17.8.2.1. By Nature

            17.8.2.2. By Form

            17.8.2.3. By End Use

            17.8.2.4. By Distribution Channel

    17.9. Italy

        17.9.1. Pricing Analysis

        17.9.2. Market Share Analysis, 2022

            17.9.2.1. By Nature

            17.9.2.2. By Form

            17.9.2.3. By End Use

            17.9.2.4. By Distribution Channel

    17.10. Poland

        17.10.1. Pricing Analysis

        17.10.2. Market Share Analysis, 2022

            17.10.2.1. By Nature

            17.10.2.2. By Form

            17.10.2.3. By End Use

            17.10.2.4. By Distribution Channel

    17.11. Russia

        17.11.1. Pricing Analysis

        17.11.2. Market Share Analysis, 2022

            17.11.2.1. By Nature

            17.11.2.2. By Form

            17.11.2.3. By End Use

            17.11.2.4. By Distribution Channel

    17.12. Czech Republic

        17.12.1. Pricing Analysis

        17.12.2. Market Share Analysis, 2022

            17.12.2.1. By Nature

            17.12.2.2. By Form

            17.12.2.3. By End Use

            17.12.2.4. By Distribution Channel

    17.13. Romania

        17.13.1. Pricing Analysis

        17.13.2. Market Share Analysis, 2022

            17.13.2.1. By Nature

            17.13.2.2. By Form

            17.13.2.3. By End Use

            17.13.2.4. By Distribution Channel

    17.14. India

        17.14.1. Pricing Analysis

        17.14.2. Market Share Analysis, 2022

            17.14.2.1. By Nature

            17.14.2.2. By Form

            17.14.2.3. By End Use

            17.14.2.4. By Distribution Channel

    17.15. Bangladesh

        17.15.1. Pricing Analysis

        17.15.2. Market Share Analysis, 2022

            17.15.2.1. By Nature

            17.15.2.2. By Form

            17.15.2.3. By End Use

            17.15.2.4. By Distribution Channel

    17.16. Australia

        17.16.1. Pricing Analysis

        17.16.2. Market Share Analysis, 2022

            17.16.2.1. By Nature

            17.16.2.2. By Form

            17.16.2.3. By End Use

            17.16.2.4. By Distribution Channel

    17.17. New Zealand

        17.17.1. Pricing Analysis

        17.17.2. Market Share Analysis, 2022

            17.17.2.1. By Nature

            17.17.2.2. By Form

            17.17.2.3. By End Use

            17.17.2.4. By Distribution Channel

    17.18. China

        17.18.1. Pricing Analysis

        17.18.2. Market Share Analysis, 2022

            17.18.2.1. By Nature

            17.18.2.2. By Form

            17.18.2.3. By End Use

            17.18.2.4. By Distribution Channel

    17.19. Japan

        17.19.1. Pricing Analysis

        17.19.2. Market Share Analysis, 2022

            17.19.2.1. By Nature

            17.19.2.2. By Form

            17.19.2.3. By End Use

            17.19.2.4. By Distribution Channel

    17.20. South Korea

        17.20.1. Pricing Analysis

        17.20.2. Market Share Analysis, 2022

            17.20.2.1. By Nature

            17.20.2.2. By Form

            17.20.2.3. By End Use

            17.20.2.4. By Distribution Channel

    17.21. GCC Countries

        17.21.1. Pricing Analysis

        17.21.2. Market Share Analysis, 2022

            17.21.2.1. By Nature

            17.21.2.2. By Form

            17.21.2.3. By End Use

            17.21.2.4. By Distribution Channel

    17.22. South Africa

        17.22.1. Pricing Analysis

        17.22.2. Market Share Analysis, 2022

            17.22.2.1. By Nature

            17.22.2.2. By Form

            17.22.2.3. By End Use

            17.22.2.4. By Distribution Channel

    17.23. Israel

        17.23.1. Pricing Analysis

        17.23.2. Market Share Analysis, 2022

            17.23.2.1. By Nature

            17.23.2.2. By Form

            17.23.2.3. By End Use

            17.23.2.4. By Distribution Channel

18. Market Structure Analysis

    18.1. Competition Dashboard

    18.2. Competition Benchmarking

    18.3. Market Share Analysis of Top Players

        18.3.1. By Regional

        18.3.2. By Nature

        18.3.3. By Form

        18.3.4. By End Use

        18.3.5. By Distribution Channel

19. Competition Analysis

    19.1. Competition Deep Dive

        19.1.1. Marquis Macadamias

            19.1.1.1. Overview

            19.1.1.2. Product Portfolio

            19.1.1.3. Profitability by Market Segments

            19.1.1.4. Sales Footprint

            19.1.1.5. Strategy Overview

                19.1.1.5.1. Marketing Strategy

                19.1.1.5.2. Product Strategy

                19.1.1.5.3. Channel Strategy

        19.1.2. Golden Macadamias

            19.1.2.1. Overview

            19.1.2.2. Product Portfolio

            19.1.2.3. Profitability by Market Segments

            19.1.2.4. Sales Footprint

            19.1.2.5. Strategy Overview

                19.1.2.5.1. Marketing Strategy

                19.1.2.5.2. Product Strategy

                19.1.2.5.3. Channel Strategy

        19.1.3. Mauna Loa Nut Corp

            19.1.3.1. Overview

            19.1.3.2. Product Portfolio

            19.1.3.3. Profitability by Market Segments

            19.1.3.4. Sales Footprint

            19.1.3.5. Strategy Overview

                19.1.3.5.1. Marketing Strategy

                19.1.3.5.2. Product Strategy

                19.1.3.5.3. Channel Strategy

        19.1.4. Buderim Group

            19.1.4.1. Overview

            19.1.4.2. Product Portfolio

            19.1.4.3. Profitability by Market Segments

            19.1.4.4. Sales Footprint

            19.1.4.5. Strategy Overview

                19.1.4.5.1. Marketing Strategy

                19.1.4.5.2. Product Strategy

                19.1.4.5.3. Channel Strategy

        19.1.5. Kenya Nut Company

            19.1.5.1. Overview

            19.1.5.2. Product Portfolio

            19.1.5.3. Profitability by Market Segments

            19.1.5.4. Sales Footprint

            19.1.5.5. Strategy Overview

                19.1.5.5.1. Marketing Strategy

                19.1.5.5.2. Product Strategy

                19.1.5.5.3. Channel Strategy

        19.1.6. Nambucca Macnuts

            19.1.6.1. Overview

            19.1.6.2. Product Portfolio

            19.1.6.3. Profitability by Market Segments

            19.1.6.4. Sales Footprint

            19.1.6.5. Strategy Overview

                19.1.6.5.1. Marketing Strategy

                19.1.6.5.2. Product Strategy

                19.1.6.5.3. Channel Strategy

        19.1.7. Ivory Macadamias

            19.1.7.1. Overview

            19.1.7.2. Product Portfolio

            19.1.7.3. Profitability by Market Segments

            19.1.7.4. Sales Footprint

            19.1.7.5. Strategy Overview

                19.1.7.5.1. Marketing Strategy

                19.1.7.5.2. Product Strategy

                19.1.7.5.3. Channel Strategy

        19.1.8. Eastern Produce

            19.1.8.1. Overview

            19.1.8.2. Product Portfolio

            19.1.8.3. Profitability by Market Segments

            19.1.8.4. Sales Footprint

            19.1.8.5. Strategy Overview

                19.1.8.5.1. Marketing Strategy

                19.1.8.5.2. Product Strategy

                19.1.8.5.3. Channel Strategy

        19.1.9. Hamakua Nut Company

            19.1.9.1. Overview

            19.1.9.2. Product Portfolio

            19.1.9.3. Profitability by Market Segments

            19.1.9.4. Sales Footprint

            19.1.9.5. Strategy Overview

                19.1.9.5.1. Marketing Strategy

                19.1.9.5.2. Product Strategy

                19.1.9.5.3. Channel Strategy

        19.1.10. MacFarms.

            19.1.10.1. Overview

            19.1.10.2. Product Portfolio

            19.1.10.3. Profitability by Market Segments

            19.1.10.4. Sales Footprint

            19.1.10.5. Strategy Overview

                19.1.10.5.1. Marketing Strategy

                19.1.10.5.2. Product Strategy

                19.1.10.5.3. Channel Strategy

20. Assumptions & Acronyms Used

21. Research Methodology

Don't pay for what you don't need

Customize your report by selecting specific countries or regions and save 30%!

List of Tables

Table 1: Global Market Value (US$ Million) Forecast by Region, 2018 to 2033

Table 2: Global Market Volume (Tons) Forecast by Region, 2018 to 2033

Table 3: Global Market Value (US$ Million) Forecast by Nature, 2018 to 2033

Table 4: Global Market Volume (Tons) Forecast by Nature, 2018 to 2033

Table 5: Global Market Value (US$ Million) Forecast by Form, 2018 to 2033

Table 6: Global Market Volume (Tons) Forecast by Form, 2018 to 2033

Table 7: Global Market Value (US$ Million) Forecast by End Use, 2018 to 2033

Table 8: Global Market Volume (Tons) Forecast by End Use, 2018 to 2033

Table 9: Global Market Value (US$ Million) Forecast by Distribution Channel, 2018 to 2033

Table 10: Global Market Volume (Tons) Forecast by Distribution Channel, 2018 to 2033

Table 11: North America Market Value (US$ Million) Forecast by Country, 2018 to 2033

Table 12: North America Market Volume (Tons) Forecast by Country, 2018 to 2033

Table 13: North America Market Value (US$ Million) Forecast by Nature, 2018 to 2033

Table 14: North America Market Volume (Tons) Forecast by Nature, 2018 to 2033

Table 15: North America Market Value (US$ Million) Forecast by Form, 2018 to 2033

Table 16: North America Market Volume (Tons) Forecast by Form, 2018 to 2033

Table 17: North America Market Value (US$ Million) Forecast by End Use, 2018 to 2033

Table 18: North America Market Volume (Tons) Forecast by End Use, 2018 to 2033

Table 19: North America Market Value (US$ Million) Forecast by Distribution Channel, 2018 to 2033

Table 20: North America Market Volume (Tons) Forecast by Distribution Channel, 2018 to 2033

Table 21: Latin America Market Value (US$ Million) Forecast by Country, 2018 to 2033

Table 22: Latin America Market Volume (Tons) Forecast by Country, 2018 to 2033

Table 23: Latin America Market Value (US$ Million) Forecast by Nature, 2018 to 2033

Table 24: Latin America Market Volume (Tons) Forecast by Nature, 2018 to 2033

Table 25: Latin America Market Value (US$ Million) Forecast by Form, 2018 to 2033

Table 26: Latin America Market Volume (Tons) Forecast by Form, 2018 to 2033

Table 27: Latin America Market Value (US$ Million) Forecast by End Use, 2018 to 2033

Table 28: Latin America Market Volume (Tons) Forecast by End Use, 2018 to 2033

Table 29: Latin America Market Value (US$ Million) Forecast by Distribution Channel, 2018 to 2033

Table 30: Latin America Market Volume (Tons) Forecast by Distribution Channel, 2018 to 2033

Table 31: Western Europe Market Value (US$ Million) Forecast by Country, 2018 to 2033

Table 32: Western Europe Market Volume (Tons) Forecast by Country, 2018 to 2033

Table 33: Western Europe Market Value (US$ Million) Forecast by Nature, 2018 to 2033

Table 34: Western Europe Market Volume (Tons) Forecast by Nature, 2018 to 2033

Table 35: Western Europe Market Value (US$ Million) Forecast by Form, 2018 to 2033

Table 36: Western Europe Market Volume (Tons) Forecast by Form, 2018 to 2033

Table 37: Western Europe Market Value (US$ Million) Forecast by End Use, 2018 to 2033

Table 38: Western Europe Market Volume (Tons) Forecast by End Use, 2018 to 2033

Table 39: Western Europe Market Value (US$ Million) Forecast by Distribution Channel, 2018 to 2033

Table 40: Western Europe Market Volume (Tons) Forecast by Distribution Channel, 2018 to 2033

Table 41: Eastern Europe Market Value (US$ Million) Forecast by Country, 2018 to 2033

Table 42: Eastern Europe Market Volume (Tons) Forecast by Country, 2018 to 2033

Table 43: Eastern Europe Market Value (US$ Million) Forecast by Nature, 2018 to 2033

Table 44: Eastern Europe Market Volume (Tons) Forecast by Nature, 2018 to 2033

Table 45: Eastern Europe Market Value (US$ Million) Forecast by Form, 2018 to 2033

Table 46: Eastern Europe Market Volume (Tons) Forecast by Form, 2018 to 2033

Table 47: Eastern Europe Market Value (US$ Million) Forecast by End Use, 2018 to 2033

Table 48: Eastern Europe Market Volume (Tons) Forecast by End Use, 2018 to 2033

Table 49: Eastern Europe Market Value (US$ Million) Forecast by Distribution Channel, 2018 to 2033

Table 50: Eastern Europe Market Volume (Tons) Forecast by Distribution Channel, 2018 to 2033

Table 51: South Asia and Pacific Market Value (US$ Million) Forecast by Country, 2018 to 2033

Table 52: South Asia and Pacific Market Volume (Tons) Forecast by Country, 2018 to 2033

Table 53: South Asia and Pacific Market Value (US$ Million) Forecast by Nature, 2018 to 2033

Table 54: South Asia and Pacific Market Volume (Tons) Forecast by Nature, 2018 to 2033

Table 55: South Asia and Pacific Market Value (US$ Million) Forecast by Form, 2018 to 2033

Table 56: South Asia and Pacific Market Volume (Tons) Forecast by Form, 2018 to 2033

Table 57: South Asia and Pacific Market Value (US$ Million) Forecast by End Use, 2018 to 2033

Table 58: South Asia and Pacific Market Volume (Tons) Forecast by End Use, 2018 to 2033

Table 59: South Asia and Pacific Market Value (US$ Million) Forecast by Distribution Channel, 2018 to 2033

Table 60: South Asia and Pacific Market Volume (Tons) Forecast by Distribution Channel, 2018 to 2033

Table 61: East Asia Market Value (US$ Million) Forecast by Country, 2018 to 2033

Table 62: East Asia Market Volume (Tons) Forecast by Country, 2018 to 2033

Table 63: East Asia Market Value (US$ Million) Forecast by Nature, 2018 to 2033

Table 64: East Asia Market Volume (Tons) Forecast by Nature, 2018 to 2033

Table 65: East Asia Market Value (US$ Million) Forecast by Form, 2018 to 2033

Table 66: East Asia Market Volume (Tons) Forecast by Form, 2018 to 2033

Table 67: East Asia Market Value (US$ Million) Forecast by End Use, 2018 to 2033

Table 68: East Asia Market Volume (Tons) Forecast by End Use, 2018 to 2033

Table 69: East Asia Market Value (US$ Million) Forecast by Distribution Channel, 2018 to 2033

Table 70: East Asia Market Volume (Tons) Forecast by Distribution Channel, 2018 to 2033

Table 71: Middle East and Africa Market Value (US$ Million) Forecast by Country, 2018 to 2033

Table 72: Middle East and Africa Market Volume (Tons) Forecast by Country, 2018 to 2033

Table 73: Middle East and Africa Market Value (US$ Million) Forecast by Nature, 2018 to 2033

Table 74: Middle East and Africa Market Volume (Tons) Forecast by Nature, 2018 to 2033

Table 75: Middle East and Africa Market Value (US$ Million) Forecast by Form, 2018 to 2033

Table 76: Middle East and Africa Market Volume (Tons) Forecast by Form, 2018 to 2033

Table 77: Middle East and Africa Market Value (US$ Million) Forecast by End Use, 2018 to 2033

Table 78: Middle East and Africa Market Volume (Tons) Forecast by End Use, 2018 to 2033

Table 79: Middle East and Africa Market Value (US$ Million) Forecast by Distribution Channel, 2018 to 2033

Table 80: Middle East and Africa Market Volume (Tons) Forecast by Distribution Channel, 2018 to 2033
Nandini Roy Choudhury

Principal Consultant

Talk to Analyst

Find your sweet spots for generating winning opportunities in this market.

List of Charts

Figure 1: Global Market Value (US$ Million) by Nature, 2023 to 2033

Figure 2: Global Market Value (US$ Million) by Form, 2023 to 2033

Figure 3: Global Market Value (US$ Million) by End Use, 2023 to 2033

Figure 4: Global Market Value (US$ Million) by Distribution Channel, 2023 to 2033

Figure 5: Global Market Value (US$ Million) by Region, 2023 to 2033

Figure 6: Global Market Value (US$ Million) Analysis by Region, 2018 to 2033

Figure 7: Global Market Volume (Tons) Analysis by Region, 2018 to 2033

Figure 8: Global Market Value Share (%) and BPS Analysis by Region, 2023 to 2033

Figure 9: Global Market Y-o-Y Growth (%) Projections by Region, 2023 to 2033

Figure 10: Global Market Value (US$ Million) Analysis by Nature, 2018 to 2033

Figure 11: Global Market Volume (Tons) Analysis by Nature, 2018 to 2033

Figure 12: Global Market Value Share (%) and BPS Analysis by Nature, 2023 to 2033

Figure 13: Global Market Y-o-Y Growth (%) Projections by Nature, 2023 to 2033

Figure 14: Global Market Value (US$ Million) Analysis by Form, 2018 to 2033

Figure 15: Global Market Volume (Tons) Analysis by Form, 2018 to 2033

Figure 16: Global Market Value Share (%) and BPS Analysis by Form, 2023 to 2033

Figure 17: Global Market Y-o-Y Growth (%) Projections by Form, 2023 to 2033

Figure 18: Global Market Value (US$ Million) Analysis by End Use, 2018 to 2033

Figure 19: Global Market Volume (Tons) Analysis by End Use, 2018 to 2033

Figure 20: Global Market Value Share (%) and BPS Analysis by End Use, 2023 to 2033

Figure 21: Global Market Y-o-Y Growth (%) Projections by End Use, 2023 to 2033

Figure 22: Global Market Value (US$ Million) Analysis by Distribution Channel, 2018 to 2033

Figure 23: Global Market Volume (Tons) Analysis by Distribution Channel, 2018 to 2033

Figure 24: Global Market Value Share (%) and BPS Analysis by Distribution Channel, 2023 to 2033

Figure 25: Global Market Y-o-Y Growth (%) Projections by Distribution Channel, 2023 to 2033

Figure 26: Global Market Attractiveness by Nature, 2023 to 2033

Figure 27: Global Market Attractiveness by Form, 2023 to 2033

Figure 28: Global Market Attractiveness by End Use, 2023 to 2033

Figure 29: Global Market Attractiveness by Distribution Channel, 2023 to 2033

Figure 30: Global Market Attractiveness by Region, 2023 to 2033

Figure 31: North America Market Value (US$ Million) by Nature, 2023 to 2033

Figure 32: North America Market Value (US$ Million) by Form, 2023 to 2033

Figure 33: North America Market Value (US$ Million) by End Use, 2023 to 2033

Figure 34: North America Market Value (US$ Million) by Distribution Channel, 2023 to 2033

Figure 35: North America Market Value (US$ Million) by Country, 2023 to 2033

Figure 36: North America Market Value (US$ Million) Analysis by Country, 2018 to 2033

Figure 37: North America Market Volume (Tons) Analysis by Country, 2018 to 2033

Figure 38: North America Market Value Share (%) and BPS Analysis by Country, 2023 to 2033

Figure 39: North America Market Y-o-Y Growth (%) Projections by Country, 2023 to 2033

Figure 40: North America Market Value (US$ Million) Analysis by Nature, 2018 to 2033

Figure 41: North America Market Volume (Tons) Analysis by Nature, 2018 to 2033

Figure 42: North America Market Value Share (%) and BPS Analysis by Nature, 2023 to 2033

Figure 43: North America Market Y-o-Y Growth (%) Projections by Nature, 2023 to 2033

Figure 44: North America Market Value (US$ Million) Analysis by Form, 2018 to 2033

Figure 45: North America Market Volume (Tons) Analysis by Form, 2018 to 2033

Figure 46: North America Market Value Share (%) and BPS Analysis by Form, 2023 to 2033

Figure 47: North America Market Y-o-Y Growth (%) Projections by Form, 2023 to 2033

Figure 48: North America Market Value (US$ Million) Analysis by End Use, 2018 to 2033

Figure 49: North America Market Volume (Tons) Analysis by End Use, 2018 to 2033

Figure 50: North America Market Value Share (%) and BPS Analysis by End Use, 2023 to 2033

Figure 51: North America Market Y-o-Y Growth (%) Projections by End Use, 2023 to 2033

Figure 52: North America Market Value (US$ Million) Analysis by Distribution Channel, 2018 to 2033

Figure 53: North America Market Volume (Tons) Analysis by Distribution Channel, 2018 to 2033

Figure 54: North America Market Value Share (%) and BPS Analysis by Distribution Channel, 2023 to 2033

Figure 55: North America Market Y-o-Y Growth (%) Projections by Distribution Channel, 2023 to 2033

Figure 56: North America Market Attractiveness by Nature, 2023 to 2033

Figure 57: North America Market Attractiveness by Form, 2023 to 2033

Figure 58: North America Market Attractiveness by End Use, 2023 to 2033

Figure 59: North America Market Attractiveness by Distribution Channel, 2023 to 2033

Figure 60: North America Market Attractiveness by Country, 2023 to 2033

Figure 61: Latin America Market Value (US$ Million) by Nature, 2023 to 2033

Figure 62: Latin America Market Value (US$ Million) by Form, 2023 to 2033

Figure 63: Latin America Market Value (US$ Million) by End Use, 2023 to 2033

Figure 64: Latin America Market Value (US$ Million) by Distribution Channel, 2023 to 2033

Figure 65: Latin America Market Value (US$ Million) by Country, 2023 to 2033

Figure 66: Latin America Market Value (US$ Million) Analysis by Country, 2018 to 2033

Figure 67: Latin America Market Volume (Tons) Analysis by Country, 2018 to 2033

Figure 68: Latin America Market Value Share (%) and BPS Analysis by Country, 2023 to 2033

Figure 69: Latin America Market Y-o-Y Growth (%) Projections by Country, 2023 to 2033

Figure 70: Latin America Market Value (US$ Million) Analysis by Nature, 2018 to 2033

Figure 71: Latin America Market Volume (Tons) Analysis by Nature, 2018 to 2033

Figure 72: Latin America Market Value Share (%) and BPS Analysis by Nature, 2023 to 2033

Figure 73: Latin America Market Y-o-Y Growth (%) Projections by Nature, 2023 to 2033

Figure 74: Latin America Market Value (US$ Million) Analysis by Form, 2018 to 2033

Figure 75: Latin America Market Volume (Tons) Analysis by Form, 2018 to 2033

Figure 76: Latin America Market Value Share (%) and BPS Analysis by Form, 2023 to 2033

Figure 77: Latin America Market Y-o-Y Growth (%) Projections by Form, 2023 to 2033

Figure 78: Latin America Market Value (US$ Million) Analysis by End Use, 2018 to 2033

Figure 79: Latin America Market Volume (Tons) Analysis by End Use, 2018 to 2033

Figure 80: Latin America Market Value Share (%) and BPS Analysis by End Use, 2023 to 2033

Figure 81: Latin America Market Y-o-Y Growth (%) Projections by End Use, 2023 to 2033

Figure 82: Latin America Market Value (US$ Million) Analysis by Distribution Channel, 2018 to 2033

Figure 83: Latin America Market Volume (Tons) Analysis by Distribution Channel, 2018 to 2033

Figure 84: Latin America Market Value Share (%) and BPS Analysis by Distribution Channel, 2023 to 2033

Figure 85: Latin America Market Y-o-Y Growth (%) Projections by Distribution Channel, 2023 to 2033

Figure 86: Latin America Market Attractiveness by Nature, 2023 to 2033

Figure 87: Latin America Market Attractiveness by Form, 2023 to 2033

Figure 88: Latin America Market Attractiveness by End Use, 2023 to 2033

Figure 89: Latin America Market Attractiveness by Distribution Channel, 2023 to 2033

Figure 90: Latin America Market Attractiveness by Country, 2023 to 2033

Figure 91: Western Europe Market Value (US$ Million) by Nature, 2023 to 2033

Figure 92: Western Europe Market Value (US$ Million) by Form, 2023 to 2033

Figure 93: Western Europe Market Value (US$ Million) by End Use, 2023 to 2033

Figure 94: Western Europe Market Value (US$ Million) by Distribution Channel, 2023 to 2033

Figure 95: Western Europe Market Value (US$ Million) by Country, 2023 to 2033

Figure 96: Western Europe Market Value (US$ Million) Analysis by Country, 2018 to 2033

Figure 97: Western Europe Market Volume (Tons) Analysis by Country, 2018 to 2033

Figure 98: Western Europe Market Value Share (%) and BPS Analysis by Country, 2023 to 2033

Figure 99: Western Europe Market Y-o-Y Growth (%) Projections by Country, 2023 to 2033

Figure 100: Western Europe Market Value (US$ Million) Analysis by Nature, 2018 to 2033

Figure 101: Western Europe Market Volume (Tons) Analysis by Nature, 2018 to 2033

Figure 102: Western Europe Market Value Share (%) and BPS Analysis by Nature, 2023 to 2033

Figure 103: Western Europe Market Y-o-Y Growth (%) Projections by Nature, 2023 to 2033

Figure 104: Western Europe Market Value (US$ Million) Analysis by Form, 2018 to 2033

Figure 105: Western Europe Market Volume (Tons) Analysis by Form, 2018 to 2033

Figure 106: Western Europe Market Value Share (%) and BPS Analysis by Form, 2023 to 2033

Figure 107: Western Europe Market Y-o-Y Growth (%) Projections by Form, 2023 to 2033

Figure 108: Western Europe Market Value (US$ Million) Analysis by End Use, 2018 to 2033

Figure 109: Western Europe Market Volume (Tons) Analysis by End Use, 2018 to 2033

Figure 110: Western Europe Market Value Share (%) and BPS Analysis by End Use, 2023 to 2033

Figure 111: Western Europe Market Y-o-Y Growth (%) Projections by End Use, 2023 to 2033

Figure 112: Western Europe Market Value (US$ Million) Analysis by Distribution Channel, 2018 to 2033

Figure 113: Western Europe Market Volume (Tons) Analysis by Distribution Channel, 2018 to 2033

Figure 114: Western Europe Market Value Share (%) and BPS Analysis by Distribution Channel, 2023 to 2033

Figure 115: Western Europe Market Y-o-Y Growth (%) Projections by Distribution Channel, 2023 to 2033

Figure 116: Western Europe Market Attractiveness by Nature, 2023 to 2033

Figure 117: Western Europe Market Attractiveness by Form, 2023 to 2033

Figure 118: Western Europe Market Attractiveness by End Use, 2023 to 2033

Figure 119: Western Europe Market Attractiveness by Distribution Channel, 2023 to 2033

Figure 120: Western Europe Market Attractiveness by Country, 2023 to 2033

Figure 121: Eastern Europe Market Value (US$ Million) by Nature, 2023 to 2033

Figure 122: Eastern Europe Market Value (US$ Million) by Form, 2023 to 2033

Figure 123: Eastern Europe Market Value (US$ Million) by End Use, 2023 to 2033

Figure 124: Eastern Europe Market Value (US$ Million) by Distribution Channel, 2023 to 2033

Figure 125: Eastern Europe Market Value (US$ Million) by Country, 2023 to 2033

Figure 126: Eastern Europe Market Value (US$ Million) Analysis by Country, 2018 to 2033

Figure 127: Eastern Europe Market Volume (Tons) Analysis by Country, 2018 to 2033

Figure 128: Eastern Europe Market Value Share (%) and BPS Analysis by Country, 2023 to 2033

Figure 129: Eastern Europe Market Y-o-Y Growth (%) Projections by Country, 2023 to 2033

Figure 130: Eastern Europe Market Value (US$ Million) Analysis by Nature, 2018 to 2033

Figure 131: Eastern Europe Market Volume (Tons) Analysis by Nature, 2018 to 2033

Figure 132: Eastern Europe Market Value Share (%) and BPS Analysis by Nature, 2023 to 2033

Figure 133: Eastern Europe Market Y-o-Y Growth (%) Projections by Nature, 2023 to 2033

Figure 134: Eastern Europe Market Value (US$ Million) Analysis by Form, 2018 to 2033

Figure 135: Eastern Europe Market Volume (Tons) Analysis by Form, 2018 to 2033

Figure 136: Eastern Europe Market Value Share (%) and BPS Analysis by Form, 2023 to 2033

Figure 137: Eastern Europe Market Y-o-Y Growth (%) Projections by Form, 2023 to 2033

Figure 138: Eastern Europe Market Value (US$ Million) Analysis by End Use, 2018 to 2033

Figure 139: Eastern Europe Market Volume (Tons) Analysis by End Use, 2018 to 2033

Figure 140: Eastern Europe Market Value Share (%) and BPS Analysis by End Use, 2023 to 2033

Figure 141: Eastern Europe Market Y-o-Y Growth (%) Projections by End Use, 2023 to 2033

Figure 142: Eastern Europe Market Value (US$ Million) Analysis by Distribution Channel, 2018 to 2033

Figure 143: Eastern Europe Market Volume (Tons) Analysis by Distribution Channel, 2018 to 2033

Figure 144: Eastern Europe Market Value Share (%) and BPS Analysis by Distribution Channel, 2023 to 2033

Figure 145: Eastern Europe Market Y-o-Y Growth (%) Projections by Distribution Channel, 2023 to 2033

Figure 146: Eastern Europe Market Attractiveness by Nature, 2023 to 2033

Figure 147: Eastern Europe Market Attractiveness by Form, 2023 to 2033

Figure 148: Eastern Europe Market Attractiveness by End Use, 2023 to 2033

Figure 149: Eastern Europe Market Attractiveness by Distribution Channel, 2023 to 2033

Figure 150: Eastern Europe Market Attractiveness by Country, 2023 to 2033

Figure 151: South Asia and Pacific Market Value (US$ Million) by Nature, 2023 to 2033

Figure 152: South Asia and Pacific Market Value (US$ Million) by Form, 2023 to 2033

Figure 153: South Asia and Pacific Market Value (US$ Million) by End Use, 2023 to 2033

Figure 154: South Asia and Pacific Market Value (US$ Million) by Distribution Channel, 2023 to 2033

Figure 155: South Asia and Pacific Market Value (US$ Million) by Country, 2023 to 2033

Figure 156: South Asia and Pacific Market Value (US$ Million) Analysis by Country, 2018 to 2033

Figure 157: South Asia and Pacific Market Volume (Tons) Analysis by Country, 2018 to 2033

Figure 158: South Asia and Pacific Market Value Share (%) and BPS Analysis by Country, 2023 to 2033

Figure 159: South Asia and Pacific Market Y-o-Y Growth (%) Projections by Country, 2023 to 2033

Figure 160: South Asia and Pacific Market Value (US$ Million) Analysis by Nature, 2018 to 2033

Figure 161: South Asia and Pacific Market Volume (Tons) Analysis by Nature, 2018 to 2033

Figure 162: South Asia and Pacific Market Value Share (%) and BPS Analysis by Nature, 2023 to 2033

Figure 163: South Asia and Pacific Market Y-o-Y Growth (%) Projections by Nature, 2023 to 2033

Figure 164: South Asia and Pacific Market Value (US$ Million) Analysis by Form, 2018 to 2033

Figure 165: South Asia and Pacific Market Volume (Tons) Analysis by Form, 2018 to 2033

Figure 166: South Asia and Pacific Market Value Share (%) and BPS Analysis by Form, 2023 to 2033

Figure 167: South Asia and Pacific Market Y-o-Y Growth (%) Projections by Form, 2023 to 2033

Figure 168: South Asia and Pacific Market Value (US$ Million) Analysis by End Use, 2018 to 2033

Figure 169: South Asia and Pacific Market Volume (Tons) Analysis by End Use, 2018 to 2033

Figure 170: South Asia and Pacific Market Value Share (%) and BPS Analysis by End Use, 2023 to 2033

Figure 171: South Asia and Pacific Market Y-o-Y Growth (%) Projections by End Use, 2023 to 2033

Figure 172: South Asia and Pacific Market Value (US$ Million) Analysis by Distribution Channel, 2018 to 2033

Figure 173: South Asia and Pacific Market Volume (Tons) Analysis by Distribution Channel, 2018 to 2033

Figure 174: South Asia and Pacific Market Value Share (%) and BPS Analysis by Distribution Channel, 2023 to 2033

Figure 175: South Asia and Pacific Market Y-o-Y Growth (%) Projections by Distribution Channel, 2023 to 2033

Figure 176: South Asia and Pacific Market Attractiveness by Nature, 2023 to 2033

Figure 177: South Asia and Pacific Market Attractiveness by Form, 2023 to 2033

Figure 178: South Asia and Pacific Market Attractiveness by End Use, 2023 to 2033

Figure 179: South Asia and Pacific Market Attractiveness by Distribution Channel, 2023 to 2033

Figure 180: South Asia and Pacific Market Attractiveness by Country, 2023 to 2033

Figure 181: East Asia Market Value (US$ Million) by Nature, 2023 to 2033

Figure 182: East Asia Market Value (US$ Million) by Form, 2023 to 2033

Figure 183: East Asia Market Value (US$ Million) by End Use, 2023 to 2033

Figure 184: East Asia Market Value (US$ Million) by Distribution Channel, 2023 to 2033

Figure 185: East Asia Market Value (US$ Million) by Country, 2023 to 2033

Figure 186: East Asia Market Value (US$ Million) Analysis by Country, 2018 to 2033

Figure 187: East Asia Market Volume (Tons) Analysis by Country, 2018 to 2033

Figure 188: East Asia Market Value Share (%) and BPS Analysis by Country, 2023 to 2033

Figure 189: East Asia Market Y-o-Y Growth (%) Projections by Country, 2023 to 2033

Figure 190: East Asia Market Value (US$ Million) Analysis by Nature, 2018 to 2033

Figure 191: East Asia Market Volume (Tons) Analysis by Nature, 2018 to 2033

Figure 192: East Asia Market Value Share (%) and BPS Analysis by Nature, 2023 to 2033

Figure 193: East Asia Market Y-o-Y Growth (%) Projections by Nature, 2023 to 2033

Figure 194: East Asia Market Value (US$ Million) Analysis by Form, 2018 to 2033

Figure 195: East Asia Market Volume (Tons) Analysis by Form, 2018 to 2033

Figure 196: East Asia Market Value Share (%) and BPS Analysis by Form, 2023 to 2033

Figure 197: East Asia Market Y-o-Y Growth (%) Projections by Form, 2023 to 2033

Figure 198: East Asia Market Value (US$ Million) Analysis by End Use, 2018 to 2033

Figure 199: East Asia Market Volume (Tons) Analysis by End Use, 2018 to 2033

Figure 200: East Asia Market Value Share (%) and BPS Analysis by End Use, 2023 to 2033

Figure 201: East Asia Market Y-o-Y Growth (%) Projections by End Use, 2023 to 2033

Figure 202: East Asia Market Value (US$ Million) Analysis by Distribution Channel, 2018 to 2033

Figure 203: East Asia Market Volume (Tons) Analysis by Distribution Channel, 2018 to 2033

Figure 204: East Asia Market Value Share (%) and BPS Analysis by Distribution Channel, 2023 to 2033

Figure 205: East Asia Market Y-o-Y Growth (%) Projections by Distribution Channel, 2023 to 2033

Figure 206: East Asia Market Attractiveness by Nature, 2023 to 2033

Figure 207: East Asia Market Attractiveness by Form, 2023 to 2033

Figure 208: East Asia Market Attractiveness by End Use, 2023 to 2033

Figure 209: East Asia Market Attractiveness by Distribution Channel, 2023 to 2033

Figure 210: East Asia Market Attractiveness by Country, 2023 to 2033

Figure 211: Middle East and Africa Market Value (US$ Million) by Nature, 2023 to 2033

Figure 212: Middle East and Africa Market Value (US$ Million) by Form, 2023 to 2033

Figure 213: Middle East and Africa Market Value (US$ Million) by End Use, 2023 to 2033

Figure 214: Middle East and Africa Market Value (US$ Million) by Distribution Channel, 2023 to 2033

Figure 215: Middle East and Africa Market Value (US$ Million) by Country, 2023 to 2033

Figure 216: Middle East and Africa Market Value (US$ Million) Analysis by Country, 2018 to 2033

Figure 217: Middle East and Africa Market Volume (Tons) Analysis by Country, 2018 to 2033

Figure 218: Middle East and Africa Market Value Share (%) and BPS Analysis by Country, 2023 to 2033

Figure 219: Middle East and Africa Market Y-o-Y Growth (%) Projections by Country, 2023 to 2033

Figure 220: Middle East and Africa Market Value (US$ Million) Analysis by Nature, 2018 to 2033

Figure 221: Middle East and Africa Market Volume (Tons) Analysis by Nature, 2018 to 2033

Figure 222: Middle East and Africa Market Value Share (%) and BPS Analysis by Nature, 2023 to 2033

Figure 223: Middle East and Africa Market Y-o-Y Growth (%) Projections by Nature, 2023 to 2033

Figure 224: Middle East and Africa Market Value (US$ Million) Analysis by Form, 2018 to 2033

Figure 225: Middle East and Africa Market Volume (Tons) Analysis by Form, 2018 to 2033

Figure 226: Middle East and Africa Market Value Share (%) and BPS Analysis by Form, 2023 to 2033

Figure 227: Middle East and Africa Market Y-o-Y Growth (%) Projections by Form, 2023 to 2033

Figure 228: Middle East and Africa Market Value (US$ Million) Analysis by End Use, 2018 to 2033

Figure 229: Middle East and Africa Market Volume (Tons) Analysis by End Use, 2018 to 2033

Figure 230: Middle East and Africa Market Value Share (%) and BPS Analysis by End Use, 2023 to 2033

Figure 231: Middle East and Africa Market Y-o-Y Growth (%) Projections by End Use, 2023 to 2033

Figure 232: Middle East and Africa Market Value (US$ Million) Analysis by Distribution Channel, 2018 to 2033

Figure 233: Middle East and Africa Market Volume (Tons) Analysis by Distribution Channel, 2018 to 2033

Figure 234: Middle East and Africa Market Value Share (%) and BPS Analysis by Distribution Channel, 2023 to 2033

Figure 235: Middle East and Africa Market Y-o-Y Growth (%) Projections by Distribution Channel, 2023 to 2033

Figure 236: Middle East and Africa Market Attractiveness by Nature, 2023 to 2033

Figure 237: Middle East and Africa Market Attractiveness by Form, 2023 to 2033

Figure 238: Middle East and Africa Market Attractiveness by End Use, 2023 to 2033

Figure 239: Middle East and Africa Market Attractiveness by Distribution Channel, 2023 to 2033

Figure 240: Middle East and Africa Market Attractiveness by Country, 2023 to 2033

Recommendations

Food and Beverage

Edible Nuts Market

Published : February 2023

Food and Beverage

Macadamia Milk Market

Published : May 2022

Explore Food and Beverage Insights

View Reports