Non-Thermal Pasteurization Market
Market Insights on Non-Thermal Pasteurization covering sales outlook, demand forecast & up-to-date key trends
Non-Thermal Pasteurization Market by Technique, Form, Application & Region - Forecast 2022 - 2032
Non-Thermal Pasteurization Market Outlook (2022-2032)
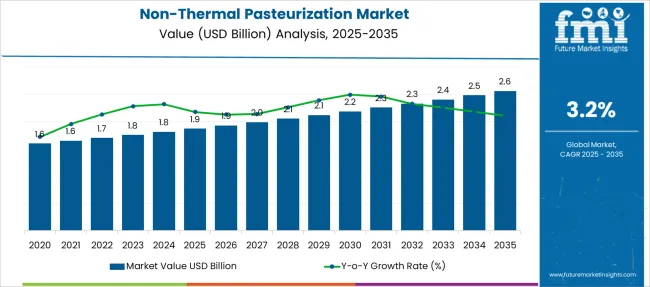
[350 Pages Report] The global non-thermal pasteurization market is expected to reach a market valuation of USD 1.7 Bn by the year 2022, accelerating with a CAGR of 3.2% by 2022-2032.
Non-Thermal Pasteurization Market Size (2022E) |
USD 1.7 Bn |
Non-Thermal Pasteurization Market Projected Size (2032F) |
USD 2.3 Bn |
Value CAGR (2022-2032) |
3.2% |
Top 3 Countries Marketing Share |
35.6% |
Non-Thermal Pasteurization market sales are likely to account for a part of the demand in the global food processing market in 2022.
FMI analysis indicates that the expansion of the convenience food sector, which includes products such as frozen foods and ready-to-eat foods, has increased demand for non-thermal pasteurization, as these technologies reduce processing time and increase production capacity to meet rising market demand. However, high capital investment is impeding the growth of the non-thermal pasteurization market.
Don't pay for what you don't need
Customize your report by selecting specific countries or regions and save 30%!
How The Market Progressed Till June 2022?
Market Statistics |
Details |
H1,2021 (A) |
3.2% |
H1,2022 Projected (P) |
3.2% |
H1,2022 Outlook (O) |
3.5% |
BPS Change : H1,2022 (O) - H1,2022 (P) |
(+) 32 ↑ |
BPS Change : H1,2022 (O) - H1,2021 (A) |
(+) 35.2 ↑ |
An increasing number of cases of foodborne illness are being observed, which is another factor that is expected to cause a great need for non-thermal pasteurization technology to eliminate the potential for food poisoning. Some new developments that have taken place in these market include, PEF (Pulsed Electric Field) is a widely used tool to keep food burning while also extending its shelf life.
It also meets consumers' need for raw, fresh, and processed foods without the use of preservatives or additives. This process helps to preserve the nutrients, colour and taste of food to satisfy the global need for snacks.
The global market for non-thermal pasteurization technology is witnessed H1 2021 growth at magnitude of 3.2%. However, this growth is not evenly spread across all regions, with the developing markets recording higher growth rates of 3.5% (H1 2022 Expected). Thus, leaving the gap of -35.2 BPS points between expected and projected growth during H1 2022.
Non-thermal pasteurization gains market share in North America at a faster rate. Forwarding incorporation is used by producers in the country to increase their participation in the value chain.
The new trend in the industry is expected to be a combination of processes ranging from imports to post-sales services using strategies (Pulsed Electric Field) and HPP (High-Pressure Processing). This is expected to result in high quality and inexpensive finished products that deliver good output and lifetime value.
How Does Non-Thermal Pasteurization Market Historic and Future Outlook Compare?
The increasing demand for the preservation of vegetables, meat, seafood, fruits, and other types of packaged food is driving the non-thermal pasteurization market. People's changing lifestyles and hectic schedules are compelling them to seek out packaged, ready-to-eat, and frozen foods. Despite this, there is a significant increase in demand for higher quality and healthier items, making non-thermal pasteurization extremely important in the food industry.
Non-thermal pasteurization is gaining popularity as a preferred food processing technology for converting raw food items into products fit for human consumption. Non-thermal pasteurization does not expose the food to high temperatures, which helps to preserve the flavor, nutritional value, and appearance of the food. The technology also aids in the killing of pathogens, thereby keeping food safe.
The growing consumer demand for tastier, safer, and additive-free food is also driving the global market for non-thermal pasteurization. Increased use of high-pressure processors, as well as rising government investments in food processing equipment and machinery, are opening up new opportunities for market growth.
How is the demand in the convenience food segment driving the demand for the market?
The convenience food category includes ready meals such as ready-to-eat foods, shelf-stable items, and prepared mixes such as cake mix. Pre-cut vegetables, canned and bottled foods, frozen meat, ready-to-cook or ready-to-serve foods, and a variety of other convenience foods are available.
As consumer meal consumption habits change, there is an increasing demand for dinner-time solutions among today's consumers. Many customers are able to invest in the ready-to-eat market because they lack the resources or skills to prepare food at home.
Marketers have used a variety of tactics in recent years, including portion-controlled packaging, in-store promotions, mergers and acquisitions, and health statements on labels. People want food that reduces cooking time and effort, which is driving the Non-Thermal Pasteurization Industry.
Find your sweet spots for generating winning opportunities in this market.
Talk to AnalystWhat is the Impact of COVID-19 on the Non-Thermal Pasteurization Market?
COVID-19 had an adverse impact on the global non-thermal pasteurization market. With lockdown and stringent regulations imposed worldwide manufacturing activities were shut down in the first half of the year 2020.
Complex manufacturing processes, product-related safety standards such as Pulsed electric fields, and stringent government regulations are impeding the growth of the Non-Thermal Pasteurization market. The high initial investment required to enter the non-thermal pasteurization market may limit the market growth. However, the market is expected to recover with a year-on-year growth of 3.2% in 2022.
Country-wise Insights
What is the market outlook in the U.S?
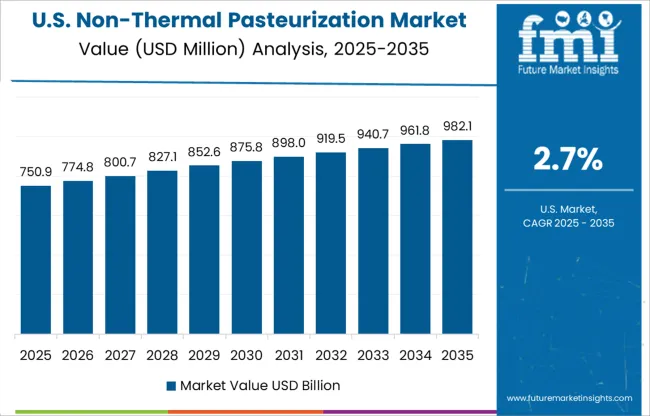
A growing number of food product manufacturers in the U.S recognize the value of non-thermal pasteurization. The country also has a high meat consumption rate, which increases growth opportunities for the non-thermal pasteurization market. The country will continue to be profitable, manufacturers are likely to shift their focus to emerging markets as well.
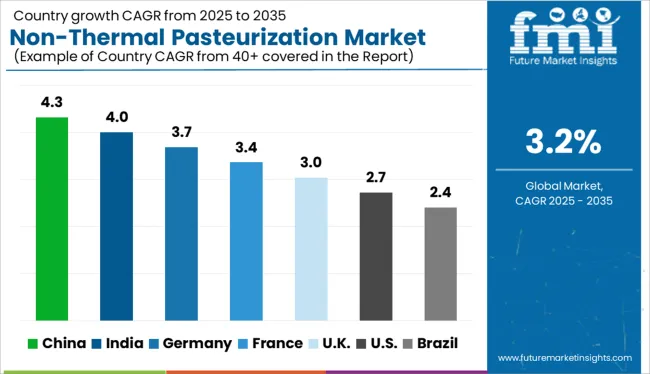
What is the market outlook in China?
With the Asia-Pacific region's rapid economic growth, demand for meat is increasing, particularly in China. This increased demand for meat products has fueled meat production in this region, contributing to market growth. Consumers' changing busy lifestyles and rising health awareness are also driving the market growth.
Get the data you need at a Fraction of the cost
Personalize your report by choosing insights you need
and save 40%!
Category-wise Insights
How will the growth in the PEF segment unfold?
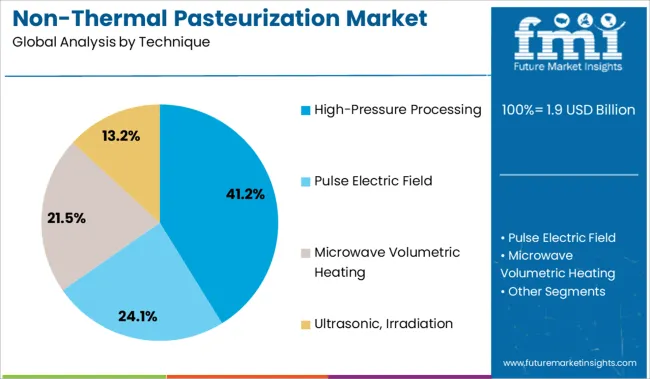
The PEF segment is expected to grow at the fastest CAGR over the next five years. This technology maintains the freshness of food products while also extending their shelf life. It also meets consumer demand for natural, fresh, and minimally processed foods because no preservatives or additives are used in the manufacturing process.
Although PEF is newer than HPP, the processed potato industry has accepted it globally. Because of these factors, the market is expected to grow at a rapid pace in the future.
How will the growth in the beverage segment unfold?
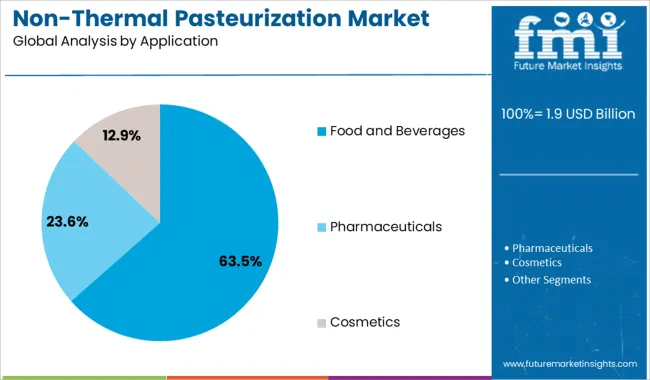
The beverages segment is expected to grow at the fastest rate during the forecasted period. Non-thermal pasteurization processes, such as HPP and PEF, are becoming more popular in the beverage market because they effectively extend beverage shelf life and prevent the development of microbial.
Furthermore, with the help of these colors, technology, nutrients, and flavors can be efficiently preserved. This technology aids in the preservation of nutrients, color, and flavor in products, as well as the gentle preservation of beverages at room temperature.
How will the growth in the solid segment unfold?
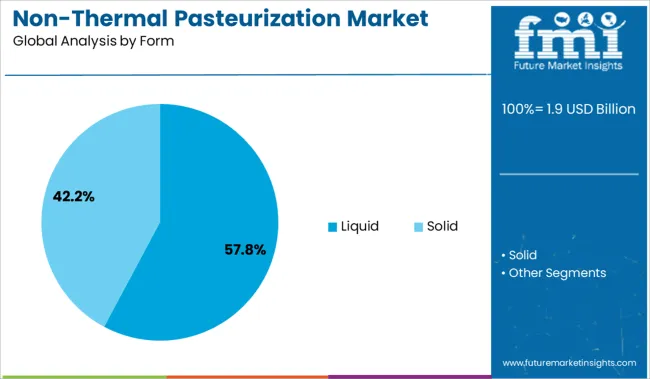
The solid food form is expected to have a larger market share during the forecasted period. This is because non-thermal pasteurization techniques are used in food products such as jellies, cheese, jam, meat products, processed foods, and so on. However, several technologies such as HPP and PEF are used to improve the extraction of sugars and various bioactive components in order to keep food fresher for longer.
Competitive Landscape
The adoption of novel food processing technologies for the retention of food nutrients and sensory attributes is driving an increase in R&D activities for technology development in non-thermal pasteurization.
- Emerson will pay USD 1.6 Bn in cash for Open Systems International, Inc. in October 2020. This acquisition will add to Emerson's existing USD 1 Bn portfolio of independent software and engineering delivery services.
Scope of the Report
Attribute |
Details |
Forecast Period |
2022-2032 |
Historical Data Available for |
2017-2022 |
Market Analysis |
USD Mn for Value and Mn. Sq. M. for Volume |
Key Regions Covered |
North America, Latin America, Europe, East Asia, South Asia, and the Middle East & Africa |
Key Countries Covered |
US, Brazil, Mexico, Germany, U.K., China, India, Japan, Australia, and GCC Countries |
Key Segments Covered |
Technique, Form, Application, Region |
Key Companies Profiled |
|
Report Coverage |
Market Forecast, Company Share Analysis, Competition Intelligence, DROT Analysis, Market Dynamics and Challenges, and Strategic Growth Initiatives |
Customization & Pricing |
Available upon Request |
Non-Thermal Pasteurization Market by Category
By Technique:
- High-Pressure Processing
- Pulse Electric Field
- Microwave Volumetric Heating
- Ultrasonic, Irradiation
By Form:
- Solid
- Liquid
By Application:
- Food and Beverages
- Pharmaceuticals
- Cosmetics
By Region:
- North America
- Latin America
- Europe
- Middle east and Africa
- East Asia
- South Asia
- Oceania
Frequently Asked Questions
At what rate will the Non-Thermal Pasteurization Market grow?
Throughout the forecast period, the Non-Thermal Pasteurization Market is expected to grow at a CAGR of 3.2%.
What is the expected value of the Non-Thermal Pasteurization Market by 2032?
By 2032, the Non-Thermal Pasteurization Market is expected to be worth USD 2.3 Mn.
What are the key factors driving the Non-Thermal Pasteurization Market?
Demand for convenience food is driving the market.
Which region adds to the highest Non-Thermal Pasteurization Market Valuation?
The North american region is one of the most important consumers and has the largest market share.
What are the key strategies adopted by the major players of the Non-Thermal Pasteurization Market?
Major market players use strategies such as introducing new products and improving them, as well as investing in research and development.
Who are the key players in the Non-Thermal Pasteurization Market?
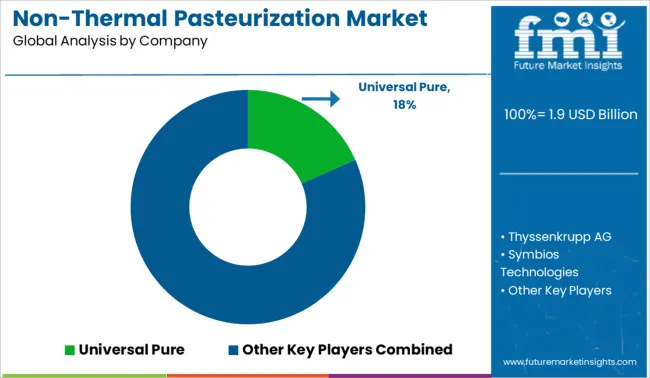
Some of the key players in the Non-Thermal Pasteurization Market include Universal Pure, Thyssenkrupp AG, Symbios Technologies, Stansted Fluid Powder Ltd, Pulsemaster, Nordion, Next HPP, Multivac Sepp Haggenmuller Se & Co. Kg, Kobe Steel Ltd, Hormel Foods, Hiperbaric Espana , Hain Celestial, Elea Technology, Dukane Corporation, Chic Freshertech, Bosch, BaoTou KeFa High-Pressure Technology, Avure Technologies, American Pasteurization, and Advanced Microwave Technologies.
Table of Content
1. Executive Summary 1.1. Global Market Outlook 1.2. Demand-side Trends 1.3. Supply-side Trends 1.4. Technology Roadmap Analysis 1.5. Analysis and Recommendations 2. Market Overview 2.1. Market Coverage / Taxonomy 2.2. Market Definition / Scope / Limitations 3. Market Background 3.1. Market Dynamics 3.1.1. Drivers 3.1.2. Restraints 3.1.3. Opportunity 3.1.4. Trends 3.2. Scenario Forecast 3.2.1. Demand in Optimistic Scenario 3.2.2. Demand in Likely Scenario 3.2.3. Demand in Conservative Scenario 3.3. Product launches & Recent Developments 3.4. Product Life Cycle Analysis 3.5. Value Chain Analysis 3.5.1. Supply Side Participants and their Roles 3.5.1.1. Producers 3.5.1.2. Mid-Level Participants (Traders/ Agents/ Brokers) 3.5.1.3. Wholesalers and Distributors 3.5.2. % of Operating Margin Analysis 3.5.3. List of Raw Material Suppliers 3.5.4. List of Existing and Potential Buyer’s 3.6. Global Market - Pricing Analysis 3.6.1. Price Point Assessment by Region 3.6.2. Price Point Assessment by Product Type 3.6.3. Price Forecast till 2032 3.6.4. Factors affecting Pricing 3.7. Forecast Factors - Relevance & Impact 3.8. PESTLE and Porter’s Analysis 3.9. Regulatory Landscape 3.9.1. Packaging & Labelling Regulations 3.9.2. Certifications and Certifying Agency Overview 3.9.3. Import/Export Policies 3.10. Regional Parent Market Outlook 3.11. Consumers Survey Analysis 3.12. Macro-Economic Factors 3.13. Product Claims & Nutritional Information Scan by Buyers 4. Global Market Analysis 2017-2021 and Forecast, 2022-2032 4.1. Historical Market Size Value (US$ Mn) & Volume (MT) Analysis, 2017-2021 4.2. Current and Future Market Size Value (US$ Mn) & Volume (MT) Projections, 2022-2032 4.2.1. Y-o-Y Growth Trend Analysis 4.2.2. Absolute $ Opportunity Analysis 5. Global Market Analysis 2017-2021 and Forecast 2022-2032, By Technique 5.1. Introduction / Key Findings 5.2. Historical Market Size Value (US$ Mn) & Volume (MT) Analysis By Technique, 2017-2021 5.3. Current and Future Market Size Value (US$ Mn) & Volume (MT) Analysis and Forecast By Technique, 2022-2032 5.3.1. High-Pressure Processing 5.3.2. Pulse Electric Field 5.3.3. Microwave Volumetric Heating 5.3.4. Ultrasonic, Irradiation 5.4. Y-o-Y Growth Trend Analysis By Technique, 2017-2021 5.5. Absolute $ Opportunity Analysis By Technique, 2022-2032 6. Global Market Analysis 2017-2021 and Forecast 2022-2032, By Form 6.1. Introduction / Key Findings 6.2. Historical Market Size Value (US$ Mn) & Volume (MT) Analysis By Form, 2017-2021 6.3. Current and Future Market Size Value (US$ Mn) & Volume (MT) Analysis and Forecast By Form, 2022-2032 6.3.1. Solid 6.3.2. Liquid 6.4. Y-o-Y Growth Trend Analysis By Form, 2017-2021 6.5. Absolute $ Opportunity Analysis By Form, 2022-2032 7. Global Market Analysis 2017-2021 and Forecast 2022-2032, By Application 7.1. Introduction / Key Findings 7.2. Historical Market Size Value (US$ Mn) & Volume (MT) Analysis By Application, 2017-2021 7.3. Current and Future Market Size Value (US$ Mn) & Volume (MT) Analysis and Forecast By Application, 2022-2032 7.3.1. Food and Beverages 7.3.2. Pharmaceuticals 7.3.3. Cosmetics 7.4. Y-o-Y Growth Trend Analysis By Application, 2017-2021 7.5. Absolute $ Opportunity Analysis By Application, 2022-2032 8. Global Market Analysis 2017-2021 and Forecast 2022-2032, By Region 8.1. Introduction 8.2. Historical Market Size Value (US$ Mn) & Volume (MT) Analysis By Region, 2017-2021 8.3. Current Market Size Value (US$ Mn) & Volume (MT) Analysis and Forecast By Region, 2022-2032 8.3.1. North America 8.3.2. Latin America 8.3.3. Europe 8.3.4. East Asia 8.3.5. South Asia 8.3.6. Oceania 8.3.7. MEA 8.4. Market Attractiveness Analysis By Region 9. North America Market Analysis 2017-2021 and Forecast 2022-2032, By Country 9.1. Historical Market Size Value (US$ Mn) & Volume (MT) Trend Analysis By Market Taxonomy, 2017-2021 9.2. Market Size Value (US$ Mn) & Volume (MT) Forecast By Market Taxonomy, 2022-2032 9.2.1. By Country 9.2.1.1. U.S. 9.2.1.2. Canada 9.2.2. By Technique 9.2.3. By Form 9.2.4. By Application 9.3. Market Attractiveness Analysis 9.3.1. By Country 9.3.2. By Technique 9.3.3. By Form 9.3.4. By Application 9.4. Key Takeaways 10. Latin America Market Analysis 2017-2021 and Forecast 2022-2032, By Country 10.1. Historical Market Size Value (US$ Mn) & Volume (MT) Trend Analysis By Market Taxonomy, 2017-2021 10.2. Market Size Value (US$ Mn) & Volume (MT) Forecast By Market Taxonomy, 2022-2032 10.2.1. By Country 10.2.1.1. Brazil 10.2.1.2. Mexico 10.2.1.3. Argentina 10.2.1.4. Chile 10.2.1.5. Peru 10.2.1.6. Rest of Latin America 10.2.2. By Technique 10.2.3. By Form 10.2.4. By Application 10.3. Market Attractiveness Analysis 10.3.1. By Country 10.3.2. By Technique 10.3.3. By Form 10.3.4. By Application 10.4. Key Takeaways 11. Europe Market Analysis 2017-2021 and Forecast 2022-2032, By Country 11.1. Historical Market Size Value (US$ Mn) & Volume (MT) Trend Analysis By Market Taxonomy, 2017-2021 11.2. Market Size Value (US$ Mn) & Volume (MT) Forecast By Market Taxonomy, 2022-2032 11.2.1. By Country 11.2.1.1. Germany 11.2.1.2. Italy 11.2.1.3. France 11.2.1.4. U.K. 11.2.1.5. Spain 11.2.1.6. Russia 11.2.1.7. BENELUX 11.2.1.8. Poland 11.2.1.9. Nordic Countries 11.2.1.10. Rest of Europe 11.2.2. By Technique 11.2.3. By Form 11.2.4. By Application 11.3. Market Attractiveness Analysis 11.3.1. By Country 11.3.2. By Technique 11.3.3. By Form 11.3.4. By Application 11.4. Key Takeaways 12. East Asia Market Analysis 2017-2021 and Forecast 2022-2032, By Country 12.1. Historical Market Size Value (US$ Mn) & Volume (MT) Trend Analysis By Market Taxonomy, 2017-2021 12.2. Market Size Value (US$ Mn) & Volume (MT) Forecast By Market Taxonomy, 2022-2032 12.2.1. By Country 12.2.1.1. China 12.2.1.2. Japan 12.2.1.3. South Korea 12.2.2. By Technique 12.2.3. By Form 12.2.4. By Application 12.3. Market Attractiveness Analysis 12.3.1. By Country 12.3.2. By Technique 12.3.3. By Form 12.3.4. By Application 12.4. Key Takeaways 13. South Asia Market Analysis 2017-2021 and Forecast 2022-2032, By Country 13.1. Historical Market Size Value (US$ Mn) & Volume (MT) Trend Analysis By Market Taxonomy, 2017-2021 13.2. Market Size Value (US$ Mn) & Volume (MT) Forecast By Market Taxonomy, 2022-2032 13.2.1. By Country 13.2.1.1. India 13.2.1.2. Thailand 13.2.1.3. Malaysia 13.2.1.4. Indonesia 13.2.1.5. Rest of South Asia 13.2.2. By Technique 13.2.3. By Form 13.2.4. By Application 13.3. Market Attractiveness Analysis 13.3.1. By Country 13.3.2. By Technique 13.3.3. By Form 13.3.4. By Application 13.4. Key Takeaways 14. Oceania Market Analysis 2017-2021 and Forecast 2022-2032, By Country 14.1. Historical Market Size Value (US$ Mn) & Volume (MT) Trend Analysis By Market Taxonomy, 2017-2021 14.2. Market Size Value (US$ Mn) & Volume (MT) Forecast By Market Taxonomy, 2022-2032 14.2.1. By Country 14.2.1.1. Australia 14.2.1.2. New Zealand 14.2.2. By Technique 14.2.3. By Form 14.2.4. By Application 14.3. Market Attractiveness Analysis 14.3.1. By Country 14.3.2. By Technique 14.3.3. By Form 14.3.4. By Application 14.4. Key Takeaways 15. MEA Market Analysis 2017-2021 and Forecast 2022-2032, By Country 15.1. Historical Market Size Value (US$ Mn) & Volume (MT) Trend Analysis By Market Taxonomy, 2017-2021 15.2. Market Size Value (US$ Mn) & Volume (MT) Forecast By Market Taxonomy, 2022-2032 15.2.1. By Country 15.2.1.1. GCC Countries 15.2.1.2. South Africa 15.2.1.3. Central Africa 15.2.1.4. North Africa 15.2.2. By Technique 15.2.3. By Form 15.2.4. By Application 15.3. Market Attractiveness Analysis 15.3.1. By Country 15.3.2. By Technique 15.3.3. By Form 15.3.4. By Application 15.4. Key Takeaways 16. Key Countries Market Analysis 16.1. U.S. 16.1.1. Pricing Analysis 16.1.2. Market Share Analysis, 2021 16.1.2.1. By Technique 16.1.2.2. By Form 16.1.2.3. By Application 16.2. Canada 16.2.1. Pricing Analysis 16.2.2. Market Share Analysis, 2021 16.2.2.1. By Technique 16.2.2.2. By Form 16.2.2.3. By Application 16.3. Brazil 16.3.1. Pricing Analysis 16.3.2. Market Share Analysis, 2021 16.3.2.1. By Technique 16.3.2.2. By Form 16.3.2.3. By Application 16.4. Mexico 16.4.1. Pricing Analysis 16.4.2. Market Share Analysis, 2021 16.4.2.1. By Technique 16.4.2.2. By Form 16.4.2.3. By Application 16.5. Argentina 16.5.1. Pricing Analysis 16.5.2. Market Share Analysis, 2021 16.5.2.1. By Technique 16.5.2.2. By Form 16.5.2.3. By Application 16.6. Chile 16.6.1. Pricing Analysis 16.6.2. Market Share Analysis, 2021 16.6.2.1. By Technique 16.6.2.2. By Form 16.6.2.3. By Application 16.7. Peru 16.7.1. Pricing Analysis 16.7.2. Market Share Analysis, 2021 16.7.2.1. By Technique 16.7.2.2. By Form 16.7.2.3. By Application 16.8. Germany 16.8.1. Pricing Analysis 16.8.2. Market Share Analysis, 2021 16.8.2.1. By Technique 16.8.2.2. By Form 16.8.2.3. By Application 16.9. Italy 16.9.1. Pricing Analysis 16.9.2. Market Share Analysis, 2021 16.9.2.1. By Technique 16.9.2.2. By Form 16.9.2.3. By Application 16.10. France 16.10.1. Pricing Analysis 16.10.2. Market Share Analysis, 2021 16.10.2.1. By Technique 16.10.2.2. By Form 16.10.2.3. By Application 16.11. Spain 16.11.1. Pricing Analysis 16.11.2. Market Share Analysis, 2021 16.11.2.1. By Technique 16.11.2.2. By Form 16.11.2.3. By Application 16.12. U.K. 16.12.1. Pricing Analysis 16.12.2. Market Share Analysis, 2021 16.12.2.1. By Technique 16.12.2.2. By Form 16.12.2.3. By Application 16.13. Russia 16.13.1. Pricing Analysis 16.13.2. Market Share Analysis, 2021 16.13.2.1. By Technique 16.13.2.2. By Form 16.13.2.3. By Application 16.14. Poland 16.14.1. Pricing Analysis 16.14.2. Market Share Analysis, 2021 16.14.2.1. By Technique 16.14.2.2. By Form 16.14.2.3. By Application 16.15. BENELUX 16.15.1. Pricing Analysis 16.15.2. Market Share Analysis, 2021 16.15.2.1. By Technique 16.15.2.2. By Form 16.15.2.3. By Application 16.16. Nordic Countries 16.16.1. Pricing Analysis 16.16.2. Market Share Analysis, 2021 16.16.2.1. By Technique 16.16.2.2. By Form 16.16.2.3. By Application 16.17. China 16.17.1. Pricing Analysis 16.17.2. Market Share Analysis, 2021 16.17.2.1. By Technique 16.17.2.2. By Form 16.17.2.3. By Application 16.18. Japan 16.18.1. Pricing Analysis 16.18.2. Market Share Analysis, 2021 16.18.2.1. By Technique 16.18.2.2. By Form 16.18.2.3. By Application 16.19. South Korea 16.19.1. Pricing Analysis 16.19.2. Market Share Analysis, 2021 16.19.2.1. By Technique 16.19.2.2. By Form 16.19.2.3. By Application 16.20. India 16.20.1. Pricing Analysis 16.20.2. Market Share Analysis, 2021 16.20.2.1. By Technique 16.20.2.2. By Form 16.20.2.3. By Application 16.21. Thailand 16.21.1. Pricing Analysis 16.21.2. Market Share Analysis, 2021 16.21.2.1. By Technique 16.21.2.2. By Form 16.21.2.3. By Application 16.22. Indonesia 16.22.1. Pricing Analysis 16.22.2. Market Share Analysis, 2021 16.22.2.1. By Technique 16.22.2.2. By Form 16.22.2.3. By Application 16.23. Malaysia 16.23.1. Pricing Analysis 16.23.2. Market Share Analysis, 2021 16.23.2.1. By Technique 16.23.2.2. By Form 16.23.2.3. By Application 16.24. Singapore 16.24.1. Pricing Analysis 16.24.2. Market Share Analysis, 2021 16.24.2.1. By Technique 16.24.2.2. By Form 16.24.2.3. By Application 16.25. GCC Countries 16.25.1. Pricing Analysis 16.25.2. Market Share Analysis, 2021 16.25.2.1. By Technique 16.25.2.2. By Form 16.25.2.3. By Application 16.26. South Africa 16.26.1. Pricing Analysis 16.26.2. Market Share Analysis, 2021 16.26.2.1. By Technique 16.26.2.2. By Form 16.26.2.3. By Application 16.27. Central Africa 16.27.1. Pricing Analysis 16.27.2. Market Share Analysis, 2021 16.27.2.1. By Technique 16.27.2.2. By Form 16.27.2.3. By Application 16.28. North Africa 16.28.1. Pricing Analysis 16.28.2. Market Share Analysis, 2021 16.28.2.1. By Technique 16.28.2.2. By Form 16.28.2.3. By Application 17. Market Structure Analysis 17.1. Competition Dashboard 17.2. Competition Benchmarking 17.3. Market Share Analysis of Top Players 17.3.1. By Regional 17.3.2. By Technique 17.3.3. By Form 17.3.4. By Application 18. Competition Analysis 18.1. Competition Deep Dive 18.1.1. Universal Pure 18.1.1.1. Overview 18.1.1.2. Product Portfolio 18.1.1.3. Profitability by Market Segments (Product/Age /Sales Channel/Region) 18.1.1.4. Sales Footprint 18.1.1.5. Strategy Overview 18.1.1.5.1. Marketing Strategy 18.1.1.5.2. Product Strategy 18.1.1.5.3. Channel Strategy 18.1.2. Thyssenkrupp AG 18.1.2.1. Overview 18.1.2.2. Product Portfolio 18.1.2.3. Profitability by Market Segments (Product/Age /Sales Channel/Region) 18.1.2.4. Sales Footprint 18.1.2.5. Strategy Overview 18.1.2.5.1. Marketing Strategy 18.1.2.5.2. Product Strategy 18.1.2.5.3. Channel Strategy 18.1.3. Symbios Technologies 18.1.3.1. Overview 18.1.3.2. Product Portfolio 18.1.3.3. Profitability by Market Segments (Product/Age /Sales Channel/Region) 18.1.3.4. Sales Footprint 18.1.3.5. Strategy Overview 18.1.3.5.1. Marketing Strategy 18.1.3.5.2. Product Strategy 18.1.3.5.3. Channel Strategy 18.1.4. Stansted Fluid Powder Ltd 18.1.4.1. Overview 18.1.4.2. Product Portfolio 18.1.4.3. Profitability by Market Segments (Product/Age /Sales Channel/Region) 18.1.4.4. Sales Footprint 18.1.4.5. Strategy Overview 18.1.4.5.1. Marketing Strategy 18.1.4.5.2. Product Strategy 18.1.4.5.3. Channel Strategy 18.1.5. Pulsemaster 18.1.5.1. Overview 18.1.5.2. Product Portfolio 18.1.5.3. Profitability by Market Segments (Product/Age /Sales Channel/Region) 18.1.5.4. Sales Footprint 18.1.5.5. Strategy Overview 18.1.5.5.1. Marketing Strategy 18.1.5.5.2. Product Strategy 18.1.5.5.3. Channel Strategy 18.1.6. Nordion 18.1.6.1. Overview 18.1.6.2. Product Portfolio 18.1.6.3. Profitability by Market Segments (Product/Age /Sales Channel/Region) 18.1.6.4. Sales Footprint 18.1.6.5. Strategy Overview 18.1.6.5.1. Marketing Strategy 18.1.6.5.2. Product Strategy 18.1.6.5.3. Channel Strategy 18.1.7. Next HPP 18.1.7.1. Overview 18.1.7.2. Product Portfolio 18.1.7.3. Profitability by Market Segments (Product/Age /Sales Channel/Region) 18.1.7.4. Sales Footprint 18.1.7.5. Strategy Overview 18.1.7.5.1. Marketing Strategy 18.1.7.5.2. Product Strategy 18.1.7.5.3. Channel Strategy 18.1.8. Multivac Sepp Haggenmuller Se & Co. Kg 18.1.8.1. Overview 18.1.8.2. Product Portfolio 18.1.8.3. Profitability by Market Segments (Product/Age /Sales Channel/Region) 18.1.8.4. Sales Footprint 18.1.8.5. Strategy Overview 18.1.8.5.1. Marketing Strategy 18.1.8.5.2. Product Strategy 18.1.8.5.3. Channel Strategy 18.1.9. Kobe Steel Ltd 18.1.9.1. Overview 18.1.9.2. Product Portfolio 18.1.9.3. Profitability by Market Segments (Product/Age /Sales Channel/Region) 18.1.9.4. Sales Footprint 18.1.9.5. Strategy Overview 18.1.9.5.1. Marketing Strategy 18.1.9.5.2. Product Strategy 18.1.9.5.3. Channel Strategy 18.1.10. Hormel Foods 18.1.10.1. Overview 18.1.10.2. Product Portfolio 18.1.10.3. Profitability by Market Segments (Product/Age /Sales Channel/Region) 18.1.10.4. Sales Footprint 18.1.10.5. Strategy Overview 18.1.10.5.1. Marketing Strategy 18.1.10.5.2. Product Strategy 18.1.10.5.3. Channel Strategy 18.1.11. Hiperbaric Espana 18.1.11.1. Overview 18.1.11.2. Product Portfolio 18.1.11.3. Profitability by Market Segments (Product/Age /Sales Channel/Region) 18.1.11.4. Sales Footprint 18.1.11.5. Strategy Overview 18.1.11.5.1. Marketing Strategy 18.1.11.5.2. Product Strategy 18.1.11.5.3. Channel Strategy 18.1.12. Hain Celestial 18.1.12.1. Overview 18.1.12.2. Product Portfolio 18.1.12.3. Profitability by Market Segments (Product/Age /Sales Channel/Region) 18.1.12.4. Sales Footprint 18.1.12.5. Strategy Overview 18.1.12.5.1. Marketing Strategy 18.1.12.5.2. Product Strategy 18.1.12.5.3. Channel Strategy 18.1.13. Elea Technology 18.1.13.1. Overview 18.1.13.2. Product Portfolio 18.1.13.3. Profitability by Market Segments (Product/Age /Sales Channel/Region) 18.1.13.4. Sales Footprint 18.1.13.5. Strategy Overview 18.1.13.5.1. Marketing Strategy 18.1.13.5.2. Product Strategy 18.1.13.5.3. Channel Strategy 18.1.14. Dukane Corporation 18.1.14.1. Overview 18.1.14.2. Product Portfolio 18.1.14.3. Profitability by Market Segments (Product/Age /Sales Channel/Region) 18.1.14.4. Sales Footprint 18.1.14.5. Strategy Overview 18.1.14.5.1. Marketing Strategy 18.1.14.5.2. Product Strategy 18.1.14.5.3. Channel Strategy 18.1.15. Chic Freshertech 18.1.15.1. Overview 18.1.15.2. Product Portfolio 18.1.15.3. Profitability by Market Segments (Product/Age /Sales Channel/Region) 18.1.15.4. Sales Footprint 18.1.15.5. Strategy Overview 18.1.15.5.1. Marketing Strategy 18.1.15.5.2. Product Strategy 18.1.15.5.3. Channel Strategy 18.1.16. Bosch 18.1.16.1. Overview 18.1.16.2. Product Portfolio 18.1.16.3. Profitability by Market Segments (Product/Age /Sales Channel/Region) 18.1.16.4. Sales Footprint 18.1.16.5. Strategy Overview 18.1.16.5.1. Marketing Strategy 18.1.16.5.2. Product Strategy 18.1.16.5.3. Channel Strategy 18.1.17. BaoTou KeFa High-Pressure Technology 18.1.17.1. Overview 18.1.17.2. Product Portfolio 18.1.17.3. Profitability by Market Segments (Product/Age /Sales Channel/Region) 18.1.17.4. Sales Footprint 18.1.17.5. Strategy Overview 18.1.17.5.1. Marketing Strategy 18.1.17.5.2. Product Strategy 18.1.17.5.3. Channel Strategy 18.1.18. Avure Technologies, American Pasteurization 18.1.18.1. Overview 18.1.18.2. Product Portfolio 18.1.18.3. Profitability by Market Segments (Product/Age /Sales Channel/Region) 18.1.18.4. Sales Footprint 18.1.18.5. Strategy Overview 18.1.18.5.1. Marketing Strategy 18.1.18.5.2. Product Strategy 18.1.18.5.3. Channel Strategy 18.1.19. Advanced Microwave Technologies 18.1.19.1. Overview 18.1.19.2. Product Portfolio 18.1.19.3. Profitability by Market Segments (Product/Age /Sales Channel/Region) 18.1.19.4. Sales Footprint 18.1.19.5. Strategy Overview 18.1.19.5.1. Marketing Strategy 18.1.19.5.2. Product Strategy 18.1.19.5.3. Channel Strategy 18.1.20. Others 19. Assumptions & Acronyms Used 20. Research Methodology
Don't pay for what you don't need
Customize your report by selecting specific countries or regions and save 30%!
List of Tables
Table 1: Global Market Value (US$ Mn) Forecast by Region, 2017-2032 Table 2: Global Market Volume (MT) Forecast by Region, 2017-2032 Table 3: Global Market Value (US$ Mn) Forecast by Technique, 2017-2032 Table 4: Global Market Volume (MT) Forecast by Technique, 2017-2032 Table 5: Global Market Value (US$ Mn) Forecast by Form, 2017-2032 Table 6: Global Market Volume (MT) Forecast by Form, 2017-2032 Table 7: Global Market Value (US$ Mn) Forecast by Application, 2017-2032 Table 8: Global Market Volume (MT) Forecast by Application, 2017-2032 Table 9: North America Market Value (US$ Mn) Forecast by Country, 2017-2032 Table 10: North America Market Volume (MT) Forecast by Country, 2017-2032 Table 11: North America Market Value (US$ Mn) Forecast by Technique, 2017-2032 Table 12: North America Market Volume (MT) Forecast by Technique, 2017-2032 Table 13: North America Market Value (US$ Mn) Forecast by Form, 2017-2032 Table 14: North America Market Volume (MT) Forecast by Form, 2017-2032 Table 15: North America Market Value (US$ Mn) Forecast by Application, 2017-2032 Table 16: North America Market Volume (MT) Forecast by Application, 2017-2032 Table 17: Latin America Market Value (US$ Mn) Forecast by Country, 2017-2032 Table 18: Latin America Market Volume (MT) Forecast by Country, 2017-2032 Table 19: Latin America Market Value (US$ Mn) Forecast by Technique, 2017-2032 Table 20: Latin America Market Volume (MT) Forecast by Technique, 2017-2032 Table 21: Latin America Market Value (US$ Mn) Forecast by Form, 2017-2032 Table 22: Latin America Market Volume (MT) Forecast by Form, 2017-2032 Table 23: Latin America Market Value (US$ Mn) Forecast by Application, 2017-2032 Table 24: Latin America Market Volume (MT) Forecast by Application, 2017-2032 Table 25: Europe Market Value (US$ Mn) Forecast by Country, 2017-2032 Table 26: Europe Market Volume (MT) Forecast by Country, 2017-2032 Table 27: Europe Market Value (US$ Mn) Forecast by Technique, 2017-2032 Table 28: Europe Market Volume (MT) Forecast by Technique, 2017-2032 Table 29: Europe Market Value (US$ Mn) Forecast by Form, 2017-2032 Table 30: Europe Market Volume (MT) Forecast by Form, 2017-2032 Table 31: Europe Market Value (US$ Mn) Forecast by Application, 2017-2032 Table 32: Europe Market Volume (MT) Forecast by Application, 2017-2032 Table 33: East Asia Market Value (US$ Mn) Forecast by Country, 2017-2032 Table 34: East Asia Market Volume (MT) Forecast by Country, 2017-2032 Table 35: East Asia Market Value (US$ Mn) Forecast by Technique, 2017-2032 Table 36: East Asia Market Volume (MT) Forecast by Technique, 2017-2032 Table 37: East Asia Market Value (US$ Mn) Forecast by Form, 2017-2032 Table 38: East Asia Market Volume (MT) Forecast by Form, 2017-2032 Table 39: East Asia Market Value (US$ Mn) Forecast by Application, 2017-2032 Table 40: East Asia Market Volume (MT) Forecast by Application, 2017-2032 Table 41: South Asia Market Value (US$ Mn) Forecast by Country, 2017-2032 Table 42: South Asia Market Volume (MT) Forecast by Country, 2017-2032 Table 43: South Asia Market Value (US$ Mn) Forecast by Technique, 2017-2032 Table 44: South Asia Market Volume (MT) Forecast by Technique, 2017-2032 Table 45: South Asia Market Value (US$ Mn) Forecast by Form, 2017-2032 Table 46: South Asia Market Volume (MT) Forecast by Form, 2017-2032 Table 47: South Asia Market Value (US$ Mn) Forecast by Application, 2017-2032 Table 48: South Asia Market Volume (MT) Forecast by Application, 2017-2032 Table 49: Oceania Market Value (US$ Mn) Forecast by Country, 2017-2032 Table 50: Oceania Market Volume (MT) Forecast by Country, 2017-2032 Table 51: Oceania Market Value (US$ Mn) Forecast by Technique, 2017-2032 Table 52: Oceania Market Volume (MT) Forecast by Technique, 2017-2032 Table 53: Oceania Market Value (US$ Mn) Forecast by Form, 2017-2032 Table 54: Oceania Market Volume (MT) Forecast by Form, 2017-2032 Table 55: Oceania Market Value (US$ Mn) Forecast by Application, 2017-2032 Table 56: Oceania Market Volume (MT) Forecast by Application, 2017-2032 Table 57: MEA Market Value (US$ Mn) Forecast by Country, 2017-2032 Table 58: MEA Market Volume (MT) Forecast by Country, 2017-2032 Table 59: MEA Market Value (US$ Mn) Forecast by Technique, 2017-2032 Table 60: MEA Market Volume (MT) Forecast by Technique, 2017-2032 Table 61: MEA Market Value (US$ Mn) Forecast by Form, 2017-2032 Table 62: MEA Market Volume (MT) Forecast by Form, 2017-2032 Table 63: MEA Market Value (US$ Mn) Forecast by Application, 2017-2032 Table 64: MEA Market Volume (MT) Forecast by Application, 2017-2032
Find your sweet spots for generating winning opportunities in this market.
Talk to AnalystList of Charts
Figure 1: Global Market Value (US$ Mn) by Technique, 2022-2032 Figure 2: Global Market Value (US$ Mn) by Form, 2022-2032 Figure 3: Global Market Value (US$ Mn) by Application, 2022-2032 Figure 4: Global Market Value (US$ Mn) by Region, 2022-2032 Figure 5: Global Market Value (US$ Mn) Analysis by Region, 2017-2032 Figure 6: Global Market Volume (MT) Analysis by Region, 2017-2032 Figure 7: Global Market Value Share (%) and BPS Analysis by Region, 2022-2032 Figure 8: Global Market Y-o-Y Growth (%) Projections by Region, 2022-2032 Figure 9: Global Market Value (US$ Mn) Analysis by Technique, 2017-2032 Figure 10: Global Market Volume (MT) Analysis by Technique, 2017-2032 Figure 11: Global Market Value Share (%) and BPS Analysis by Technique, 2022-2032 Figure 12: Global Market Y-o-Y Growth (%) Projections by Technique, 2022-2032 Figure 13: Global Market Value (US$ Mn) Analysis by Form, 2017-2032 Figure 14: Global Market Volume (MT) Analysis by Form, 2017-2032 Figure 15: Global Market Value Share (%) and BPS Analysis by Form, 2022-2032 Figure 16: Global Market Y-o-Y Growth (%) Projections by Form, 2022-2032 Figure 17: Global Market Value (US$ Mn) Analysis by Application, 2017-2032 Figure 18: Global Market Volume (MT) Analysis by Application, 2017-2032 Figure 19: Global Market Value Share (%) and BPS Analysis by Application, 2022-2032 Figure 20: Global Market Y-o-Y Growth (%) Projections by Application, 2022-2032 Figure 21: Global Market Attractiveness by Technique, 2022-2032 Figure 22: Global Market Attractiveness by Form, 2022-2032 Figure 23: Global Market Attractiveness by Application, 2022-2032 Figure 24: Global Market Attractiveness by Region, 2022-2032 Figure 25: North America Market Value (US$ Mn) by Technique, 2022-2032 Figure 26: North America Market Value (US$ Mn) by Form, 2022-2032 Figure 27: North America Market Value (US$ Mn) by Application, 2022-2032 Figure 28: North America Market Value (US$ Mn) by Country, 2022-2032 Figure 29: North America Market Value (US$ Mn) Analysis by Country, 2017-2032 Figure 30: North America Market Volume (MT) Analysis by Country, 2017-2032 Figure 31: North America Market Value Share (%) and BPS Analysis by Country, 2022-2032 Figure 32: North America Market Y-o-Y Growth (%) Projections by Country, 2022-2032 Figure 33: North America Market Value (US$ Mn) Analysis by Technique, 2017-2032 Figure 34: North America Market Volume (MT) Analysis by Technique, 2017-2032 Figure 35: North America Market Value Share (%) and BPS Analysis by Technique, 2022-2032 Figure 36: North America Market Y-o-Y Growth (%) Projections by Technique, 2022-2032 Figure 37: North America Market Value (US$ Mn) Analysis by Form, 2017-2032 Figure 38: North America Market Volume (MT) Analysis by Form, 2017-2032 Figure 39: North America Market Value Share (%) and BPS Analysis by Form, 2022-2032 Figure 40: North America Market Y-o-Y Growth (%) Projections by Form, 2022-2032 Figure 41: North America Market Value (US$ Mn) Analysis by Application, 2017-2032 Figure 42: North America Market Volume (MT) Analysis by Application, 2017-2032 Figure 43: North America Market Value Share (%) and BPS Analysis by Application, 2022-2032 Figure 44: North America Market Y-o-Y Growth (%) Projections by Application, 2022-2032 Figure 45: North America Market Attractiveness by Technique, 2022-2032 Figure 46: North America Market Attractiveness by Form, 2022-2032 Figure 47: North America Market Attractiveness by Application, 2022-2032 Figure 48: North America Market Attractiveness by Country, 2022-2032 Figure 49: Latin America Market Value (US$ Mn) by Technique, 2022-2032 Figure 50: Latin America Market Value (US$ Mn) by Form, 2022-2032 Figure 51: Latin America Market Value (US$ Mn) by Application, 2022-2032 Figure 52: Latin America Market Value (US$ Mn) by Country, 2022-2032 Figure 53: Latin America Market Value (US$ Mn) Analysis by Country, 2017-2032 Figure 54: Latin America Market Volume (MT) Analysis by Country, 2017-2032 Figure 55: Latin America Market Value Share (%) and BPS Analysis by Country, 2022-2032 Figure 56: Latin America Market Y-o-Y Growth (%) Projections by Country, 2022-2032 Figure 57: Latin America Market Value (US$ Mn) Analysis by Technique, 2017-2032 Figure 58: Latin America Market Volume (MT) Analysis by Technique, 2017-2032 Figure 59: Latin America Market Value Share (%) and BPS Analysis by Technique, 2022-2032 Figure 60: Latin America Market Y-o-Y Growth (%) Projections by Technique, 2022-2032 Figure 61: Latin America Market Value (US$ Mn) Analysis by Form, 2017-2032 Figure 62: Latin America Market Volume (MT) Analysis by Form, 2017-2032 Figure 63: Latin America Market Value Share (%) and BPS Analysis by Form, 2022-2032 Figure 64: Latin America Market Y-o-Y Growth (%) Projections by Form, 2022-2032 Figure 65: Latin America Market Value (US$ Mn) Analysis by Application, 2017-2032 Figure 66: Latin America Market Volume (MT) Analysis by Application, 2017-2032 Figure 67: Latin America Market Value Share (%) and BPS Analysis by Application, 2022-2032 Figure 68: Latin America Market Y-o-Y Growth (%) Projections by Application, 2022-2032 Figure 69: Latin America Market Attractiveness by Technique, 2022-2032 Figure 70: Latin America Market Attractiveness by Form, 2022-2032 Figure 71: Latin America Market Attractiveness by Application, 2022-2032 Figure 72: Latin America Market Attractiveness by Country, 2022-2032 Figure 73: Europe Market Value (US$ Mn) by Technique, 2022-2032 Figure 74: Europe Market Value (US$ Mn) by Form, 2022-2032 Figure 75: Europe Market Value (US$ Mn) by Application, 2022-2032 Figure 76: Europe Market Value (US$ Mn) by Country, 2022-2032 Figure 77: Europe Market Value (US$ Mn) Analysis by Country, 2017-2032 Figure 78: Europe Market Volume (MT) Analysis by Country, 2017-2032 Figure 79: Europe Market Value Share (%) and BPS Analysis by Country, 2022-2032 Figure 80: Europe Market Y-o-Y Growth (%) Projections by Country, 2022-2032 Figure 81: Europe Market Value (US$ Mn) Analysis by Technique, 2017-2032 Figure 82: Europe Market Volume (MT) Analysis by Technique, 2017-2032 Figure 83: Europe Market Value Share (%) and BPS Analysis by Technique, 2022-2032 Figure 84: Europe Market Y-o-Y Growth (%) Projections by Technique, 2022-2032 Figure 85: Europe Market Value (US$ Mn) Analysis by Form, 2017-2032 Figure 86: Europe Market Volume (MT) Analysis by Form, 2017-2032 Figure 87: Europe Market Value Share (%) and BPS Analysis by Form, 2022-2032 Figure 88: Europe Market Y-o-Y Growth (%) Projections by Form, 2022-2032 Figure 89: Europe Market Value (US$ Mn) Analysis by Application, 2017-2032 Figure 90: Europe Market Volume (MT) Analysis by Application, 2017-2032 Figure 91: Europe Market Value Share (%) and BPS Analysis by Application, 2022-2032 Figure 92: Europe Market Y-o-Y Growth (%) Projections by Application, 2022-2032 Figure 93: Europe Market Attractiveness by Technique, 2022-2032 Figure 94: Europe Market Attractiveness by Form, 2022-2032 Figure 95: Europe Market Attractiveness by Application, 2022-2032 Figure 96: Europe Market Attractiveness by Country, 2022-2032 Figure 97: East Asia Market Value (US$ Mn) by Technique, 2022-2032 Figure 98: East Asia Market Value (US$ Mn) by Form, 2022-2032 Figure 99: East Asia Market Value (US$ Mn) by Application, 2022-2032 Figure 100: East Asia Market Value (US$ Mn) by Country, 2022-2032 Figure 101: East Asia Market Value (US$ Mn) Analysis by Country, 2017-2032 Figure 102: East Asia Market Volume (MT) Analysis by Country, 2017-2032 Figure 103: East Asia Market Value Share (%) and BPS Analysis by Country, 2022-2032 Figure 104: East Asia Market Y-o-Y Growth (%) Projections by Country, 2022-2032 Figure 105: East Asia Market Value (US$ Mn) Analysis by Technique, 2017-2032 Figure 106: East Asia Market Volume (MT) Analysis by Technique, 2017-2032 Figure 107: East Asia Market Value Share (%) and BPS Analysis by Technique, 2022-2032 Figure 108: East Asia Market Y-o-Y Growth (%) Projections by Technique, 2022-2032 Figure 109: East Asia Market Value (US$ Mn) Analysis by Form, 2017-2032 Figure 110: East Asia Market Volume (MT) Analysis by Form, 2017-2032 Figure 111: East Asia Market Value Share (%) and BPS Analysis by Form, 2022-2032 Figure 112: East Asia Market Y-o-Y Growth (%) Projections by Form, 2022-2032 Figure 113: East Asia Market Value (US$ Mn) Analysis by Application, 2017-2032 Figure 114: East Asia Market Volume (MT) Analysis by Application, 2017-2032 Figure 115: East Asia Market Value Share (%) and BPS Analysis by Application, 2022-2032 Figure 116: East Asia Market Y-o-Y Growth (%) Projections by Application, 2022-2032 Figure 117: East Asia Market Attractiveness by Technique, 2022-2032 Figure 118: East Asia Market Attractiveness by Form, 2022-2032 Figure 119: East Asia Market Attractiveness by Application, 2022-2032 Figure 120: East Asia Market Attractiveness by Country, 2022-2032 Figure 121: South Asia Market Value (US$ Mn) by Technique, 2022-2032 Figure 122: South Asia Market Value (US$ Mn) by Form, 2022-2032 Figure 123: South Asia Market Value (US$ Mn) by Application, 2022-2032 Figure 124: South Asia Market Value (US$ Mn) by Country, 2022-2032 Figure 125: South Asia Market Value (US$ Mn) Analysis by Country, 2017-2032 Figure 126: South Asia Market Volume (MT) Analysis by Country, 2017-2032 Figure 127: South Asia Market Value Share (%) and BPS Analysis by Country, 2022-2032 Figure 128: South Asia Market Y-o-Y Growth (%) Projections by Country, 2022-2032 Figure 129: South Asia Market Value (US$ Mn) Analysis by Technique, 2017-2032 Figure 130: South Asia Market Volume (MT) Analysis by Technique, 2017-2032 Figure 131: South Asia Market Value Share (%) and BPS Analysis by Technique, 2022-2032 Figure 132: South Asia Market Y-o-Y Growth (%) Projections by Technique, 2022-2032 Figure 133: South Asia Market Value (US$ Mn) Analysis by Form, 2017-2032 Figure 134: South Asia Market Volume (MT) Analysis by Form, 2017-2032 Figure 135: South Asia Market Value Share (%) and BPS Analysis by Form, 2022-2032 Figure 136: South Asia Market Y-o-Y Growth (%) Projections by Form, 2022-2032 Figure 137: South Asia Market Value (US$ Mn) Analysis by Application, 2017-2032 Figure 138: South Asia Market Volume (MT) Analysis by Application, 2017-2032 Figure 139: South Asia Market Value Share (%) and BPS Analysis by Application, 2022-2032 Figure 140: South Asia Market Y-o-Y Growth (%) Projections by Application, 2022-2032 Figure 141: South Asia Market Attractiveness by Technique, 2022-2032 Figure 142: South Asia Market Attractiveness by Form, 2022-2032 Figure 143: South Asia Market Attractiveness by Application, 2022-2032 Figure 144: South Asia Market Attractiveness by Country, 2022-2032 Figure 145: Oceania Market Value (US$ Mn) by Technique, 2022-2032 Figure 146: Oceania Market Value (US$ Mn) by Form, 2022-2032 Figure 147: Oceania Market Value (US$ Mn) by Application, 2022-2032 Figure 148: Oceania Market Value (US$ Mn) by Country, 2022-2032 Figure 149: Oceania Market Value (US$ Mn) Analysis by Country, 2017-2032 Figure 150: Oceania Market Volume (MT) Analysis by Country, 2017-2032 Figure 151: Oceania Market Value Share (%) and BPS Analysis by Country, 2022-2032 Figure 152: Oceania Market Y-o-Y Growth (%) Projections by Country, 2022-2032 Figure 153: Oceania Market Value (US$ Mn) Analysis by Technique, 2017-2032 Figure 154: Oceania Market Volume (MT) Analysis by Technique, 2017-2032 Figure 155: Oceania Market Value Share (%) and BPS Analysis by Technique, 2022-2032 Figure 156: Oceania Market Y-o-Y Growth (%) Projections by Technique, 2022-2032 Figure 157: Oceania Market Value (US$ Mn) Analysis by Form, 2017-2032 Figure 158: Oceania Market Volume (MT) Analysis by Form, 2017-2032 Figure 159: Oceania Market Value Share (%) and BPS Analysis by Form, 2022-2032 Figure 160: Oceania Market Y-o-Y Growth (%) Projections by Form, 2022-2032 Figure 161: Oceania Market Value (US$ Mn) Analysis by Application, 2017-2032 Figure 162: Oceania Market Volume (MT) Analysis by Application, 2017-2032 Figure 163: Oceania Market Value Share (%) and BPS Analysis by Application, 2022-2032 Figure 164: Oceania Market Y-o-Y Growth (%) Projections by Application, 2022-2032 Figure 165: Oceania Market Attractiveness by Technique, 2022-2032 Figure 166: Oceania Market Attractiveness by Form, 2022-2032 Figure 167: Oceania Market Attractiveness by Application, 2022-2032 Figure 168: Oceania Market Attractiveness by Country, 2022-2032 Figure 169: MEA Market Value (US$ Mn) by Technique, 2022-2032 Figure 170: MEA Market Value (US$ Mn) by Form, 2022-2032 Figure 171: MEA Market Value (US$ Mn) by Application, 2022-2032 Figure 172: MEA Market Value (US$ Mn) by Country, 2022-2032 Figure 173: MEA Market Value (US$ Mn) Analysis by Country, 2017-2032 Figure 174: MEA Market Volume (MT) Analysis by Country, 2017-2032 Figure 175: MEA Market Value Share (%) and BPS Analysis by Country, 2022-2032 Figure 176: MEA Market Y-o-Y Growth (%) Projections by Country, 2022-2032 Figure 177: MEA Market Value (US$ Mn) Analysis by Technique, 2017-2032 Figure 178: MEA Market Volume (MT) Analysis by Technique, 2017-2032 Figure 179: MEA Market Value Share (%) and BPS Analysis by Technique, 2022-2032 Figure 180: MEA Market Y-o-Y Growth (%) Projections by Technique, 2022-2032 Figure 181: MEA Market Value (US$ Mn) Analysis by Form, 2017-2032 Figure 182: MEA Market Volume (MT) Analysis by Form, 2017-2032 Figure 183: MEA Market Value Share (%) and BPS Analysis by Form, 2022-2032 Figure 184: MEA Market Y-o-Y Growth (%) Projections by Form, 2022-2032 Figure 185: MEA Market Value (US$ Mn) Analysis by Application, 2017-2032 Figure 186: MEA Market Volume (MT) Analysis by Application, 2017-2032 Figure 187: MEA Market Value Share (%) and BPS Analysis by Application, 2022-2032 Figure 188: MEA Market Y-o-Y Growth (%) Projections by Application, 2022-2032 Figure 189: MEA Market Attractiveness by Technique, 2022-2032 Figure 190: MEA Market Attractiveness by Form, 2022-2032 Figure 191: MEA Market Attractiveness by Application, 2022-2032 Figure 192: MEA Market Attractiveness by Country, 2022-2032
Recommendations
Explore Food and Beverage Insights
View Reports